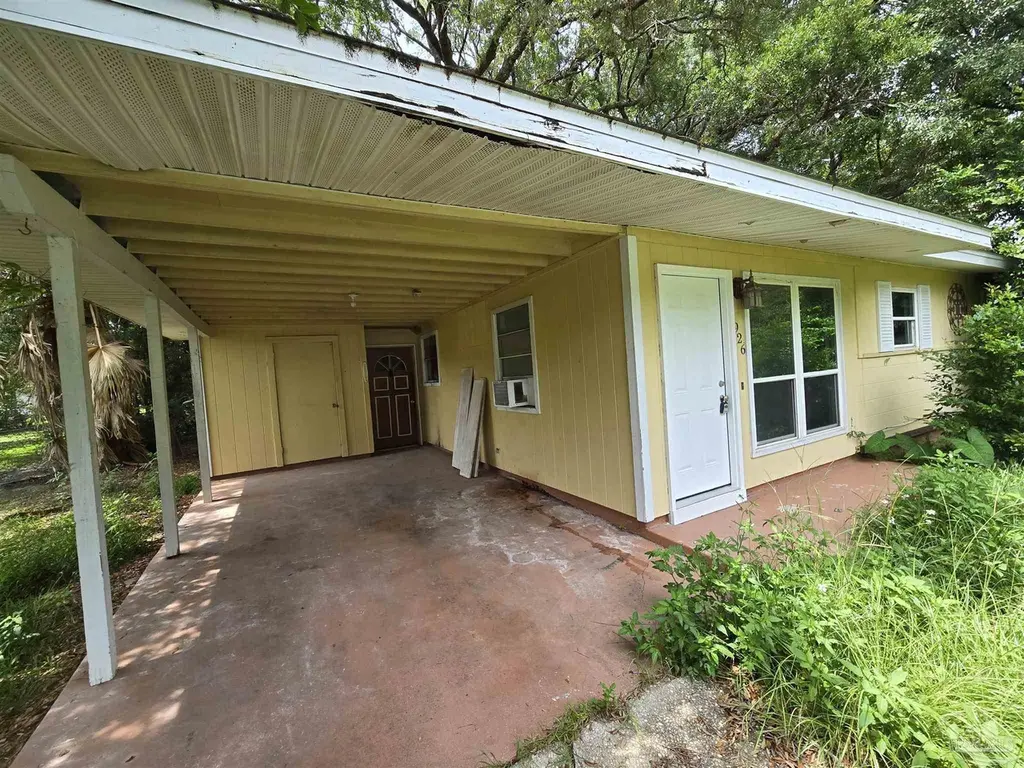
926 Lucerne Ave · Brent, FL
Flood risk 1/10 · Minimal
- FEMA flood zone
- X (unshaded)
- Chance of flooding over 30 yrs
- 0.0%
- Est. flood insurance / yr
- $507 – $1,088
Fire risk 1/10 · Minimal
- Est. fire insurance / yr
- $947 – $1,759
Heat risk 10/10 · Severe
- Hot days now (above 106°F)
- 7 days/yr
- Hot days in 30 yrs
- 20 days/yr
Wind risk 9/10 · Severe
- Chance of severe wind over 30 yrs
- 99.0%
Air-quality risk 1/10 · Minimal
- Unhealthy air days now
- 0 days/yr
- Unhealthy air days in 30 yrs
- 0 days/yr
Risk factors via First Street. Map © Google.
Why this score? — see what drove the B+ grade
The composite is a weighted blend of 9 inputs, each scored 0–100. Each bar is that input's sub-score; the figure is the points it added to the 100-point composite (weight × sub-score).
- Cash flow +29.0/30.0
- ARV discount +15.0/15.0
- DSCR +10.0/10.0
- 1% rule +7.8/10.0
- Rent growth +3.7/5.0
- Schools +3.6/10.0
- Livability +3.5/5.0
- Condition / age +2.5/5.0
- Appreciation +0.0/10.0
$125,000
🖨 Deal sheet (PDF) 📄 Offer letter ✓ Due diligence
Listing remarks MLS
Move in ready investor Buy and hold or great starter home for first time buyers! Some recent updates made to this 3br/1ba home in kitchen and bathroom. Close to mall, hospital, and interstate. This is a solid property with great curb appeal. This property is being offered at wholesale value and is easy to show.
Key facts
- 8,276 sq ft lot
- Parking
- Built 1959
Property features AI
Finance
- Other: Directions: Turn right off Michigan, then turn left on Lucerne. House is located on left
- Financial info: No investor or cash-flow details provided
- HOA & community: No homeowners association
Exterior
- Parking: Carport providing covered parking (1 covered space, total 1 parking space)
- Security: No security features provided
- Utilities: Public water; Public sewer; Copper electrical wiring
- Home design: One-story single family home; Not attached to another property; Gable and hip roof
- Construction: Frame construction; Slab foundation; Building area reported as 1,500 square feet
- Exterior features: Interior lot; Does not allow horses; County-maintained road access
Interior
- Kitchen: Kitchen condition not updated; Electric water heater
- Bedrooms: Master bedroom on the first floor, approx. 15 x 11; Additional bedroom on the first floor, approx. 12 x 10
- Flooring: No flooring details provided
- Bathrooms: 1 full bathroom
- Heating & cooling: Central heating; Central air; Ceiling fans
- Interior features: Living/dining combo; Resale condition (not new construction)
- Laundry & utility: No specific laundry details provided
Neighborhood map
What this means for you Summary
Snapshot
- This is a 3-bed/1.0-bath single-family listed at $125k.
Deal economics
- At list price, monthly cash flow is $427 ($5k/yr) — positive.
- The deal already cash-flows at list — no discount required.
- Meets the 1% rule at list price ($2k rent vs $125k).
- Cap rate 10.4% vs local median 6.6% in Brent — top-decile yield for the area; either an underpriced asset or a hidden risk that comps aren't pricing in. Stress-test before assuming the spread holds.
Location & tenants
- Location reads 69/100 on livability (#484 in FL) — a middle-class / working-renter tenant base. Strengths: cost of living A+, housing A+, health & safety A+; Watch: crime D, amenities F, commute F.
- Escambia (suburban): math 40% / reading 45% proficiency, ranked #56 of 73 in FL (top 77%) — families likely to look elsewhere, expect single-tenant / working-renter base with shorter leases.
- Zoned schools: Montclair Elementary School (math 42% / reading 29%, grade F, #1,684 of 2,144 statewide, top 79%, 379 students, 91% FRL); Pensacola High School (math 29% / reading 50%, grade F, #304 of 667 statewide, top 47%, 1,229 students, 55% FRL).
- Market conditions: Rents rising fast (+4.9%/yr); 203 active listings in the ZIP; 12 comparable units currently listed for rent nearby; rentals at typical pace (median 25d on market — plan ~3-4 weeks tenant-placement turnaround); lower-income renter base — watch delinquency; 1,479 units permitted in Escambia County in 2024 (0 in 5+ unit buildings).
- This rent runs 43% of the median local income ($45k/yr) — at the standard rent-burdened threshold; future hikes will face affordability resistance.
Forward outlook
- Local home prices are declining (-3.0%/yr); year-one equity from $864 of loan paydown is wiped out by about $4k of value loss. Plan a longer hold.
- Escambia County population projected at +13% by 2050 — modest demand growth; plan on rents tracking national, not racing it.
- At projected returns (-3.0% appreciation + 4.9% rent growth), your $35k cash investment doubles in ~7 years — after that, you're playing with house money.
Negotiation context
- Only 8 days on market — expect competitive offers; lowballing is unlikely to land.
- 3 sale attempts since 25y ago with the ask held roughly flat each time — persistent listings suggest the price (not the market) is what's stuck; bring a comps-based counter.
- Current owner paid $30k; list at $125k implies a 317% gain — meaningful room to come down on a strong offer.
Risks & watch-outs
- Watch-outs: built in 1959 — expect roof / HVAC / electrical / plumbing capex.
- Climate carrying-cost: severe wind risk, 99% chance of damaging wind over 30y; extreme-heat days projected 7→20/yr by 2055 (HVAC capex compounding) — expect insurance premiums to compound above CPI over the hold.
Questions for the listing agent
- Built in 1959 — when were the roof, HVAC, electrical panel, plumbing, and water heater last replaced?
- Is there a deadline driving the sale (1031 exchange, divorce, estate, relocation)? That informs how much negotiation room exists.
- Crime grade is D in this area — have there been break-ins, vandalism, or insurance claims at this property in the last 3 years? What carrier currently insures it and at what premium?
- What's the average days-on-market for RENTAL listings here right now (not sales)? A rising rental-DOM trend means longer vacancies and softer asking-rent achievability than the comps imply.
- What's the recent tenant-quality profile in this submarket — average credit score on applications, eviction rate, late-payment / NSF rate, and stable-employment percentage? A property-management company in the area should have these aggregated.
- How much new for-sale + rental construction is in the pipeline within 1–3 miles? Heavy new supply typically softens prices + rents 12–24 months out; constrained supply supports both.
Investment metrics
- 1% rule
- 1.28% ✓
- Cap rate
- 10.40%
- Cash-on-cash
- 14.65%
- DSCR
- 1.65
- GRM
- 6.5
CMA / ARV
- ARV (on-the-fly)
- $176,400
- Comps found
- 12
Show comp detail 12 sales within ~0.75 mi
| Address | Dist | Beds/Ba | Sqft | Sold | Price | $/sf | Match |
|---|---|---|---|---|---|---|---|
| 1016 Fremont Ave | 0.08mi | 3/1.0 | 1,150 (-4%) | 2mo | $175,000 | $152 | 88 |
| 5100 Cranston Ave | 0.23mi | 3/2.0 | 1,218 (+2%) | 4mo | $229,500 | $188 | 80 |
| 1032 Fremont Ave | 0.08mi | 3/1.0 | 1,092 (-9%) | 4mo | $107,500 | $98 | 78 |
| 911 Medford Ave | 0.32mi | 3/2.0 | 1,279 (+7%) | 2mo | $206,000 | $161 | 68 |
| 5505 Fairview Dr | 0.21mi | 3/2.0 | 1,066 (-11%) | 2mo | $160,000 | $150 | 66 |
| 800 Montclair Rd | 0.44mi | 4/1.0 (+1) | 1,158 (-4%) | 4mo | $170,000 | $147 | 66 |
| 4505 Ellysee Way | 0.41mi | 3/2.0 | 1,279 (+7%) | 4mo | $182,500 | $143 | 62 |
| 5107 Burlington Ave | 0.49mi | 3/1.0 | 1,085 (-10%) | 1mo | $150,000 | $138 | 60 |
| 914 Twinbrook Ave | 0.41mi | 3/1.0 | 1,328 (+11%) | 4mo | $132,000 | $99 | 59 |
| 702 Loire Way | 0.63mi | 3/1.0 | 1,297 (+8%) | 3mo | $100,000 | $77 | 55 |
| 4509 Cherbourg Way | 0.53mi | 3/1.5 | 1,040 (-13%) | 2mo | $159,000 | $153 | 49 |
| 4517 Monpellier Dr | 0.45mi | 3/2.0 | 1,357 (+13%) | 7mo | $198,000 | $146 | 48 |
Match score weights: distance 35% · size 25% · config 20% · recency 20%. Top-matched comps best support the ARV.
Projected returns pro-forma
-3.0% appreciation · 4.92% rent growth · sell at horizon
- IRR
- 7.2%
- Equity multiple
- 1.29×
- Total profit
- $10,129
- Equity at exit
- $18,638
- IRR
- 18.1%
- Equity multiple
- 2.64×
- Total profit
- $57,376
- Equity at exit
- $10,808
Cash invested: $35,000 (down + closing). Projections, not guarantees.
Landlord ↔ Tenant lean methodology
- Overall (STATE)
- 87 Strongly Landlord-Friendly
- State Florida
- 87 Strongly Landlord-Friendly · R+3
- County
- — inherits STATE
- City
- — inherits STATE
ZIP-level market 32505
- Home prices YoY
- -26.5%
- Rents YoY
- 4.9%
- Active inventory
- 203
- Price-to-rent
- 6.5×
Monthly cashflow live
- Estimated rent
- $1,603 high interval (Pro) →
- Mortgage (P&I)
- −$656
- Tax from tax record
- −$132 /mo · $1,579/yr
- Insurance
- −$52
- HOA
- −$0
- Vacancy / Maint / Mgmt
- −$337
- Net cashflow
- $427
Break-even live
Sensitivity live
| Price | -10% $498 | -5% $463 | +0% $427 | +5% $392 | +10% $357 |
|---|---|---|---|---|---|
| Rent | -10% $301 | -5% $364 | +0% $427 | +5% $491 | +10% $554 |
| Rate | -1.0pp $490 | -0.5pp $459 | base $427 | +0.5pp $395 | +1.0pp $362 |
UW: 25.0% down · 7.5% · 30yr · 1.5% tax · 5.0% vac · 8.0% maint · 8.0% mgmt
Financing live
Cash to close
- Down payment
- $31,250
- Closing costs
- $3,750
- Reserves months
- —
- Total cash needed
- —
Loan-product check · same deal, 3 products live
Conventional
25% down · 7.5% · 30yr
- Down + closing
- —
- Monthly P&I
- —
- Monthly cashflow
- —
- DSCR
- —
- Eligible?
- —
Personal DTI + credit; lowest rate.
DSCR
20% down · 8.5% · 30yr
- Down + closing
- —
- Monthly P&I
- —
- Monthly cashflow
- —
- DSCR
- —
- Eligible?
- —
No personal income docs; deal must DSCR.
Hard money
10% down · 12.0% · 12mo
- Down + closing
- —
- Monthly P&I
- —
- Monthly cashflow
- —
- DSCR
- —
- Eligible?
- —
Short-term bridge; refi at stabilization.
Rent comps 12 comps
| Address | Beds | Baths | Sqft | Rent | $/sqft | DOM | Units | Dist |
|---|---|---|---|---|---|---|---|---|
| 902 Lucerne Ave Pensacola, FL | 3.0 | 2.0 | 1276 | $1,600 | $1.25 | 25d | 1 | 0.16mi |
| 918 Montclair Rd Pensacola, FL | 3.0 | 1.0 | 1012 | $1,500 | $1.48 | 15d | 1 | 0.22mi |
| 925 Twinbrook Ave Pensacola, FL | 3.0 | 1.0 | 1105 | $1,750 | $1.58 | 25d | 1 | 0.37mi |
| 2301 W Michigan Ave #21 Pensacola, FL | 2.0 | 2.5 | 1164 | $1,325 | $1.14 | 25d | 1 | 0.45mi |
| 5602 W Shore Dr Unit B Pensacola, FL | 2.0 | 2.0 | 920 | $1,250 | $1.36 | 25d | 1 | 0.52mi |
| 2303 W Michigan Ave Unit A6 Pensacola, FL | 2.0 | 2.0 | 1014 | $1,300 | $1.28 | 25d | 1 | 0.53mi |
| 5180 Burlington Ave Pensacola, FL | 3.0 | 2.0 | 1184 | $1,650 | $1.39 | 25d | 1 | 0.54mi |
| 2300 W Michigan Ave #12 Pensacola, FL | 2.0 | 2.0 | 1050 | $1,300 | $1.24 | 25d | 1 | 0.76mi |
| 2355 W Michigan Ave Pensacola, FL | 1.0–2.0 | 1.0–2.0 | 850 | $1,450 | $1.71 | 15d | 9 | 0.91mi |
| 5877 Tryton Cir Pensacola, FL | 4.0 | 2.0 | 1419 | $1,825 | $1.29 | 25d | 1 | 1.14mi |
| 3216 Two Sisters Way Pensacola, FL | 3.0 | 2.0 | 1117 | $1,700 | $1.52 | 25d | 1 | 1.40mi |
| 6111 Enterprise Dr Pensacola, FL | 1.0–3.0 | 1.0–2.0 | 1224 | $1,688 | $1.38 | 15d | 19 | 1.44mi |
Listing history 7 events
-
2026-06-21days on market $125,000 Active 8 DOM
-
2026-06-18days on market $125,000 Active 5 DOM
-
2026-06-17days on market $125,000 Active 4 DOM
-
2026-06-16days on market $125,000 Active 3 DOM
-
2026-06-15days on market $125,000 Active 2 DOM
-
2026-06-14remarks 276-char remark
-
2026-06-14$125,000 Active 1 DOM
ⓘ Source: listings_history table (triggers on properties + properties_extension) + one-shot
backfill from property_details.listing_events for pre-trigger history.
Tax reassessment forecast FL · Resets to sale price
- Current annual tax
- $1,579 · $132/mo
- Projected year-2 tax
- $1,579 · $132/mo
- Expected delta
- $0/yr ($0/mo · 0.0%)
ⓘ Screening estimate from a state-policy table — verify with the county assessor before closing.
Climate risk First Street
- Flood 1/10 Low FEMA zone X (unshaded) · 0% chance over 30 yrs
- Wildfire 1/10 Low
- Heat 10/10 Extreme 7 d/yr ≥106°F today · 20 d/yr by 30 yrs out
- Wind 9/10 Extreme 99% chance of damaging wind over 30 yrs
- Air quality 1/10 Low 0 unhealthy d/yr today · 0 by 30 yrs out
Nearby sold comps map
Loading sold comps map…
Walkable amenities ~0.75 mi
Loading nearby amenities…
Taxation est. · year 1
- Rental income
- $19,238
- − Mortgage interest
- −$7,002
- − Property taxes
- −$1,579
- − Insurance
- −$625
- − Repairs & maintenance
- −$1,539
- − Management
- −$1,539
- − Depreciation
- −$3,636
- Taxable income
- $3,318
- Est. tax owed @ 24.0%
- −$796
- After-tax cash flow
- $4,332/yr
For passive investors: Depreciation is non-cash, so a rental often shows a tax loss while cash-flowing — sheltering income. Rental losses are passive: they offset passive income freely, and up to $25,000/yr can offset ordinary (W-2) income if you actively participate and your MAGI is under $100k (phasing out to $0 by $150k); unused losses carry forward. On sale, claimed depreciation is recaptured at up to 25%, and gains may owe capital-gains tax (a 1031 exchange can defer both). Figures are a year-1 estimate at your 24.0% rate — not tax advice; consult a CPA.
Schools (NCES district)
- District
- Escambia
- NCES district ID
- 1200510
- Math proficiency
- 40% ▼ -9.00%
- Reading proficiency
- 45% ▼ -4.00%
- Median HH income
- $44,649
- Composite
- 36.04/100
- National rank
- #4773
- State rank
- #56 of 73 in FL
Livability — Brent
- Score
- 69/100
- State rank
- #484
- US rank
- #8921
Category grades
Schools grade is shown separately in the Schools card above.
Census & demographics
- Census place
- Brent, FL
- County
- Escambia County · 301,722 people
- City population
- 27,543
- Metro
- Pensacola-Ferry Pass-Brent, FL
- Population (ZIP)
- 27,877
- Household income
- $44,783
- Rent vs Own
- Severe rent burden
- 1458.0
Population outlook (Escambia County) Hauer SSP2
- Today (2025)
- 334,637 people
- By 2030
- 345,779 · +3.3%
- By 2040
- 364,828 · +9.0%
- By 2050
- 378,514 · +13.1%
- By 2075
- 403,220 · +20.5%
- By 2100
- 386,125 · +15.4%
Race, ethnicity, and origin ACS 2023
- Neighborhood character
- Diverse neighborhood (Simpson 0.66)
- Race & ethnicity
- Black 48% White 32% Hispanic / Latino 11% Two or more races 9% Asian 2%
- Hispanic origin (detail)
- Mexican 5% Cuban 2%
- Common ancestry
- Slovak 2% Italian 1% Serbian 1%
- Foreign-born
- 9% · Canada, Vietnam
- Languages at home
- 87% English-only · Spanish 9% Other Indo-European 1% Vietnamese 1%
Political lean MEDSL · Escambia
- 2024 margin
- R (+19.5) · D 39.7% · R 59.2% · Other 1.1%
- 2008→2024 swing
- -0.2pp no change · 2008: -19.3pp · 2024: -19.5pp
- All cycles
- 2024: R+19.5 2020: R+15.1 2016: R+20.6 2012: R+20.6 2008: R+19.3
Not yet ingested
- Civics
- —
Market trends
- HPI YoY
- ▼ -74.10%
- Current HPI
- 205.45
- Rent YoY
- ▲ 4.92%
- Metro
- Pensacola-Ferry Pass-Brent, FL
- State GDP YoY
- ▲ 3.28%
- F500 in state
- 36
Industry mix (Fortune 500 HQ in FL)
| Industry | F500 HQs | Revenue |
|---|---|---|
| Industrial Technology | 2 | $29B |
|
||
| Insurance | 2 | $17B |
|
||
| Retail | 1 | $60B |
|
||
| Technology Distribution | 1 | $58B |
|
||
| Homebuilding | 1 | $35B |
|
||
| Technology Manufacturing | 1 | $35B |
|
||
Price history
+323.7% since first listed8 events — show timeline
- 2026-06-13 Listed $125,000 PARMLS
- 2017-08-25 Sold (MLS) $30,000 PARMLS
- 2017-05-01 Listed $37,900 PARMLS
- 2001-05-10 Sold (Public Records) $47,000 Public Records
- 2001-05-03 Sold (MLS) $47,000 PARMLS
- 2001-03-06 Listed $47,900 PARMLS
- 1992-11-01 Sold (Public Records) $23,600 Public Records
- 1985-10-01 Sold (Public Records) $29,500 Public Records
Property tax history
+17.0%/yrLatest (2025): $1,579 · +19.4% YoY. Source: county tax records.
Cash-flow waterfall
monthlySold comps — $/sqft
last 12 mo · ≤1 miLoading sold comps…