7405 Harper Rd · Middle Valley, TN
Flood risk 8/10 · Major
- FEMA flood zone
- X (unshaded)
- Chance of flooding over 30 yrs
- 0.99%
- Est. flood insurance / yr
- $507 – $1,088
Fire risk 4/10 · Minor
- Est. fire insurance / yr
- $949 – $1,763
Heat risk 5/10 · Moderate
- Hot days now (above 104°F)
- 7 days/yr
- Hot days in 30 yrs
- 21 days/yr
Wind risk 4/10 · Minor
- Chance of severe wind over 30 yrs
- 10.0%
Air-quality risk 3/10 · Minor
- Unhealthy air days now
- 2 days/yr
- Unhealthy air days in 30 yrs
- 2 days/yr
Risk factors via First Street. Map © Google.
Why this score? — see what drove the B+ grade
The composite is a weighted blend of 9 inputs, each scored 0–100. Each bar is that input's sub-score; the figure is the points it added to the 100-point composite (weight × sub-score).
- Cash flow +30.0/30.0
- ARV discount +15.0/15.0
- DSCR +10.0/10.0
- 1% rule +9.5/10.0
- Livability +3.3/5.0
- Rent growth +3.1/5.0
- Schools +2.7/10.0
- Condition / age +2.5/5.0
- Appreciation +0.0/10.0
$134,900
🖨 Deal sheet 📄 Offer letter ✓ Due diligence
Listing remarks
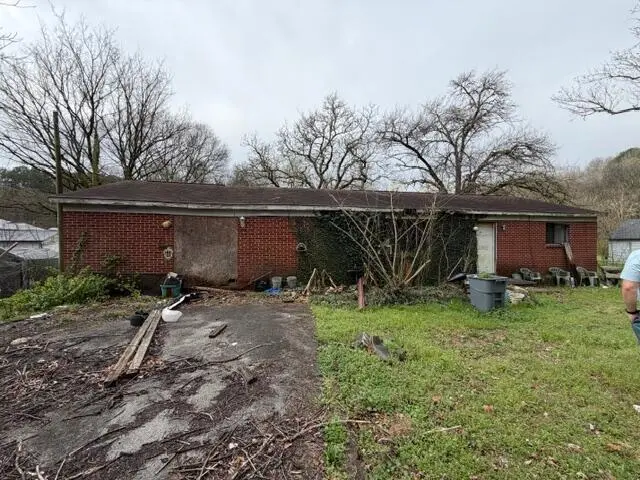
Calling all investors and visionaries! This rare Hixson multi-parcel opportunity offers incredible potential for the right buyer looking to renovate, rebuild, or redevelop. The property includes three adjoining parcels. The main parcel features a brick ranch home ready for renovation, perfect for those looking to add value through updates and improvements. A second parcel includes an older structure that may require extensive repairs or possible removal, offering an opportunity for new construction or redevelopment. The third parcel is a vacant lot, providing even more possibilities. With the parcels already adjoining, this property presents multiple investment strategies, whether you choos
Key facts
- Vacant lot
- Brick ranch home
- 0.48 acre lot
Tags
Property features AI
Exterior
- Parking: Off-street parking
- Utilities: Public water; Public sewer; Electricity available
- Home design: Single-family residence; Residential property
- Construction: Brick construction; Block foundation; Approximately 1,358 above-grade finished square feet
- Exterior features: No notable exterior features listed; Lot roughly 0.48 acres (approximately 105 x 200) with additional parcels 082K A 018 & 082K A 017
Interior
- Bathrooms: 1 full bathroom; 1 half bathroom
- Heating & cooling: Central air conditioning
- Interior features: Fireplace; Central air conditioning
Neighborhood map
What this means for you Summary
Snapshot
- This is a 3-bed/1.5-bath single-family listed at $135k.
Deal economics
- At list price, monthly cash flow is $670 ($8k/yr) — positive.
- The deal already cash-flows at list — no discount required.
- Meets the 1% rule at list price ($2k rent vs $135k).
- Recommended offer: $127k (6.0% below list) — sets the bar for market timing.
- Cap rate 12.8% vs local median 3.9% in Middle Valley — top-decile yield for the area; either an underpriced asset or a hidden risk that comps aren't pricing in. Stress-test before assuming the spread holds.
Location & tenants
- Location reads 66/100 on livability (#127 in TN) — a middle-class / working-renter tenant base. Strengths: cost of living A+, housing A+, employment A; Watch: crime C-, amenities F, commute F.
- Hamilton County (urban): math 31% / reading 31% proficiency, ranked #42 of 139 in TN (top 30%) — families likely to look elsewhere, expect single-tenant / working-renter base with shorter leases.
- Zoned schools: Middle Valley Elementary (math 53% / reading 43%, grade D, #138 of 952 statewide, top 14%, 782 students, 0% FRL); Hixson Middle School (math 27% / reading 20%, grade F, #162 of 333 statewide, top 50%, 607 students, 0% FRL); Hixson High School (math 22% / reading 32%, grade F, #104 of 332 statewide, top 33%, 935 students, 0% FRL) — zoned schools average 0% FRL vs 52% district-wide (52 pts lower); this property's tenant base skews higher-income than the district average.
- Market conditions: Rents rising (+2.4%/yr); 459 active listings in the ZIP; 3 comparable units currently listed for rent nearby; rentals at typical pace (median 24d on market — plan ~3-4 weeks tenant-placement turnaround); solid renter incomes; 2,133 units permitted in Hamilton County in 2024 (405 in 5+ unit buildings).
Forward outlook
- Local home prices are declining (-3.0%/yr); year-one equity from $933 of loan paydown is wiped out by about $4k of value loss. Plan a longer hold.
- Hamilton County population projected at +23% by 2050 — long-run rental-demand tailwind backs the buy-and-hold thesis.
- At projected returns (-3.0% appreciation + 2.4% rent growth), your $38k cash investment doubles in ~6 years — after that, you're playing with house money.
Negotiation context
- It's been on market 70 days — a 6% lower offer ($127k) is reasonable based on typical stale-listing flexibility.
- Current owner paid $34k; list at $135k implies a 296% gain — meaningful room to come down on a strong offer.
Risks & watch-outs
- Watch-outs: flood insurance adds $66/mo.
- Climate carrying-cost: severe flood risk; extreme-heat days projected 7→21/yr by 2055 (HVAC capex compounding) — expect insurance premiums to compound above CPI over the hold.
Questions for the listing agent
- It's been on market 70 days. Have you received any prior offers? Is the seller open to a 6% concession, seller financing, or rate buy-down credit?
- Built in 1960 — when were the roof, HVAC, electrical panel, plumbing, and water heater last replaced?
- What's the actual annual flood-insurance premium (NFIP or private), and is the property in a SFHA with mandatory coverage?
- Why hasn't it sold? Are there any deal-killer items the seller is aware of (foundation, flood, title, zoning, code violations)?
- Is there a deadline driving the sale (1031 exchange, divorce, estate, relocation)? That informs how much negotiation room exists.
- What's the average days-on-market for RENTAL listings here right now (not sales)? A rising rental-DOM trend means longer vacancies and softer asking-rent achievability than the comps imply.
- What's the recent tenant-quality profile in this submarket — average credit score on applications, eviction rate, late-payment / NSF rate, and stable-employment percentage? A property-management company in the area should have these aggregated.
- How much new for-sale + rental construction is in the pipeline within 1–3 miles? Heavy new supply typically softens prices + rents 12–24 months out; constrained supply supports both.
Investment metrics
- 1% rule
- 1.45% ✓
- Cap rate
- 12.84%
- Cash-on-cash
- 23.39%
- DSCR
- 2.04
- GRM
- 5.7
CMA / ARV
- ARV (on-the-fly)
- $226,786
- Comps found
- 3
Show comp detail 3 sales within ~0.75 mi
| Address | Dist | Beds/Ba | Sqft | Sold | Price | $/sf | Match |
|---|---|---|---|---|---|---|---|
| 7208 Cane Hollow Rd | 0.33mi | 3/2.5 | 1,420 (+5%) | 4mo | $375,000 | $264 | 70 |
| 1153 Coffelt Rd | 0.07mi | 2/1.0 (-1) | 1,224 (-10%) | 10mo | $204,000 | $167 | 66 |
| 1050 Hillcrest Rd | 0.44mi | 3/2.5 | 1,532 (+13%) | 9mo | $250,000 | $163 | 46 |
Match score weights: distance 35% · size 25% · config 20% · recency 20%. Top-matched comps best support the ARV.
Projected returns pro-forma
-3.0% appreciation · 2.41% rent growth · sell at horizon
- IRR
- 13.1%
- Equity multiple
- 1.52×
- Total profit
- $19,635
- Equity at exit
- $20,114
- IRR
- 21.5%
- Equity multiple
- 2.78×
- Total profit
- $67,320
- Equity at exit
- $11,664
Cash invested: $37,772 (down + closing). Projections, not guarantees.
Landlord ↔ Tenant lean methodology
- Overall (STATE)
- 87 Strongly Landlord-Friendly
- State Tennessee
- 87 Strongly Landlord-Friendly · R+13
- County
- — inherits STATE
- City
- — inherits STATE
ZIP-level market 37343
- Rents YoY
- 2.4%
- Active inventory
- 459
- Price-to-rent
- 5.7×
Monthly cashflow live
- Estimated rent
- $1,957 medium interval (Pro) →
- Mortgage (P&I)
- −$707
- Tax from tax record
- −$47 /mo · $559/yr
- Insurance
- −$56
- Flood insurance flood zone
- −$66 /mo · $798/yr
- HOA
- −$0
- Vacancy / Maint / Mgmt
- −$411
- Net cashflow
- $670
Break-even live
UW: 25.0% down · 7.5% · 30yr · 1.5% tax · 5.0% vac · 8.0% maint · 8.0% mgmt
Financing live
Cash to close
- Down payment
- $33,725
- Closing costs
- $4,047
- Reserves months
- —
- Total cash needed
- —
Loan-product check · same deal, 3 products live
Conventional
25% down · 7.5% · 30yr
- Down + closing
- —
- Monthly P&I
- —
- Monthly cashflow
- —
- DSCR
- —
- Eligible?
- —
Personal DTI + credit; lowest rate.
DSCR
20% down · 8.5% · 30yr
- Down + closing
- —
- Monthly P&I
- —
- Monthly cashflow
- —
- DSCR
- —
- Eligible?
- —
No personal income docs; deal must DSCR.
Hard money
10% down · 12.0% · 12mo
- Down + closing
- —
- Monthly P&I
- —
- Monthly cashflow
- —
- DSCR
- —
- Eligible?
- —
Short-term bridge; refi at stabilization.
Rent comps 3 comps
| Address | Beds | Baths | Sqft | Rent | $/sqft | DOM | Units | Dist |
|---|---|---|---|---|---|---|---|---|
| 151 Integra Vistas Dr Hixson, TN | 1.0–3.0 | 1.0–2.0 | 1022 | $1,883 | $1.84 | 14d | 36 | 1.26mi |
| 6553 Old Dayton Pike Hixson, TN | 3.0 | 2.0 | 1700 | $1,695 | $1.00 | 23d | 1 | 1.32mi |
| 825 S Valleywood Cir Hixson, TN | 3.0 | 2.5 | 1828 | $2,000 | $1.09 | 23d | 1 | 1.40mi |
Listing history 5 events
-
2026-05-08price $134,900
-
2026-04-21price $139,900
-
2026-03-31price $149,900
-
2026-03-15$169,900 Active
-
1986-02-14soldstatus $34,064
ⓘ Source: listings_history table (triggers on properties + properties_extension) + one-shot
backfill from property_details.listing_events for pre-trigger history.
Tax reassessment forecast TN · Resets to sale price
- Current annual tax
- $559 · $47/mo
- Projected year-2 tax
- $958 · $80/mo
- Expected delta
- +$399/yr (+$33/mo · 71.4%)
ⓘ Screening estimate from a state-policy table — verify with the county assessor before closing.
Climate risk First Street
- Flood 8/10 Severe FEMA zone X (unshaded) · 99% chance over 30 yrs
- Wildfire 4/10 Moderate
- Heat 5/10 Major 7 d/yr ≥104°F today · 21 d/yr by 30 yrs out
- Wind 4/10 Moderate 10% chance of damaging wind over 30 yrs
- Air quality 3/10 Moderate 2 unhealthy d/yr today · 2 by 30 yrs out
Nearby sold comps map
Loading sold comps map…
Walkable amenities ~0.75 mi
Loading nearby amenities…
Taxation est. · year 1
- Rental income
- $23,489
- − Mortgage interest
- −$7,556
- − Property taxes
- −$559
- − Insurance
- −$1,472
- − Repairs & maintenance
- −$1,879
- − Management
- −$1,879
- − Depreciation
- −$3,924
- Taxable income
- $6,219
- Est. tax owed @ 24.0%
- −$1,493
- After-tax cash flow
- $6,544/yr
For passive investors: Depreciation is non-cash, so a rental often shows a tax loss while cash-flowing — sheltering income. Rental losses are passive: they offset passive income freely, and up to $25,000/yr can offset ordinary (W-2) income if you actively participate and your MAGI is under $100k (phasing out to $0 by $150k); unused losses carry forward. On sale, claimed depreciation is recaptured at up to 25%, and gains may owe capital-gains tax (a 1031 exchange can defer both). Figures are a year-1 estimate at your 24.0% rate — not tax advice; consult a CPA.
Schools (NCES district)
- District
- Hamilton County
- NCES district ID
- 4701590
- Math proficiency
- 31% ▼ -10.00%
- Reading proficiency
- 31% ▼ -3.00%
- Median HH income
- $47,456
- Composite
- 26.8/100
- National rank
- #7122
- State rank
- #42 of 139 in TN
Livability — Middle Valley
- Score
- 66/100
- State rank
- #127
- US rank
- #11835
Category grades
Schools grade is shown separately in the Schools card above.
Census & demographics
- Census place
- Middle Valley, TN
- County
- Hamilton County · 312,777 people
- City population
- 44,572
- Metro
- Chattanooga, TN-GA
- Population (ZIP)
- 45,101
- Household income
- $82,227
- Rent vs Own
- Severe rent burden
- 1152.0
Population outlook (Hamilton County) Hauer SSP2
- Today (2025)
- 393,784 people
- By 2030
- 412,983 · +4.9%
- By 2040
- 449,502 · +14.1%
- By 2050
- 484,341 · +23.0%
- By 2075
- 565,746 · +43.7%
- By 2100
- 618,394 · +57.0%
Race, ethnicity, and origin ACS 2023
- Neighborhood character
- Predominantly White (83%)
- Race & ethnicity
- White 83% Hispanic / Latino 7% Two or more races 6% Black 5% Asian 2%
- Hispanic origin (detail)
- Mexican 4%
- Common ancestry
- Slovak 2% Romanian 2% Lithuanian 2%
- Foreign-born
- 5% · Canada, Vietnam, South Korea
- Languages at home
- 92% English-only · Spanish 5% Other Indo-European 1% Chinese 1%
Political lean MEDSL · Hamilton
- 2024 margin
- R (+13.1) · D 42.7% · R 55.7% · Other 1.6%
- 2008→2024 swing
- -1.2pp toward R · 2008: -11.8pp · 2024: -13.1pp
- All cycles
- 2024: R+13.1 2020: R+9.7 2016: R+16.6 2012: R+14.8 2008: R+11.8
Not yet ingested
- Civics
- —
Market trends
- HPI YoY
- ▼ -324.61%
- Current HPI
- 260.3778
- Rent YoY
- ▲ 2.41%
- Metro
- Chattanooga, TN-GA
- State GDP YoY
- ▲ 2.78%
- F500 in state
- 22
Industry mix (Fortune 500 HQ in TN)
| Industry | F500 HQs | Revenue |
|---|---|---|
| Healthcare | 3 | $91B |
|
||
| Retail | 3 | $72B |
|
||
| Transportation / Logistics | 1 | $88B |
|
||
| Paper / Packaging | 1 | $19B |
|
||
| Insurance | 1 | $13B |
|
||
| Energy | 1 | $12B |
|
||
Price history
+296.0% since first listed5 events — show timeline
- 2026-05-08 Price Changed $134,900 GCAR
- 2026-04-21 Price Changed $139,900 GCAR
- 2026-03-31 Price Changed $149,900 GCAR
- 2026-03-15 Listed $169,900 GCAR
- 1986-02-14 Sold (Public Records) $34,064 Public Records
Property tax history
+1.4%/yrLatest (2025): $559 · +20.4% YoY. Source: county tax records.
Cash-flow waterfall
monthlySold comps — $/sqft
last 12 mo · ≤1 miLoading sold comps…