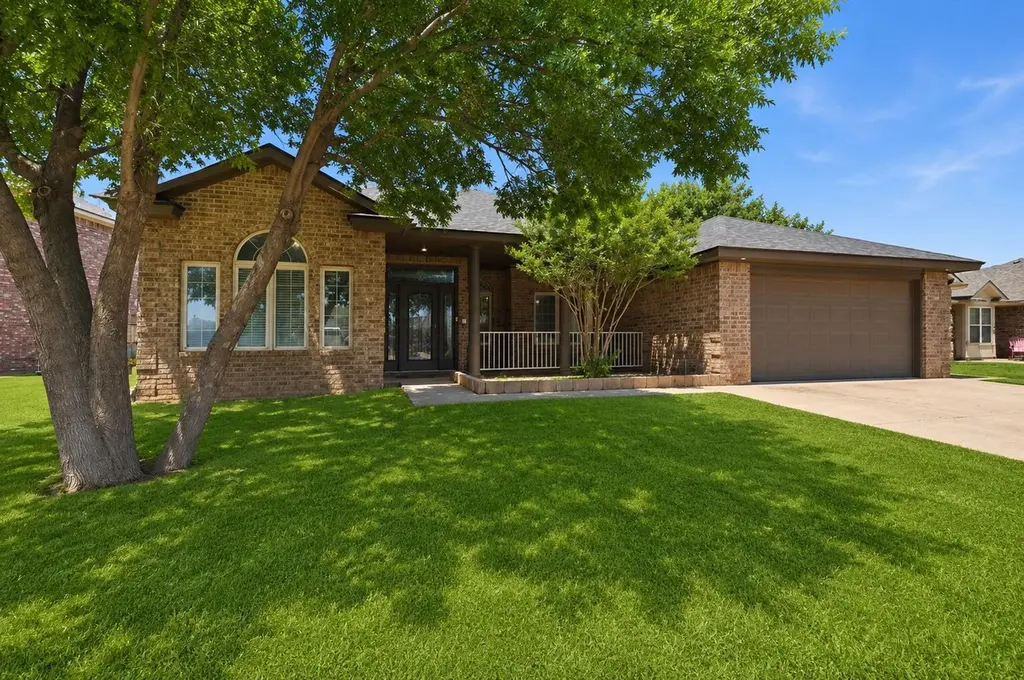
616 N 8th St · Wolfforth, TX
Flood risk 1/10 · Minimal
- FEMA flood zone
- X (unshaded)
- Chance of flooding over 30 yrs
- 0.0%
- Est. flood insurance / yr
- $507 – $1,088
Fire risk 6/10 · Moderate
- Est. fire insurance / yr
- $1,222 – $2,270
Heat risk 5/10 · Moderate
- Hot days now (above 99°F)
- 7 days/yr
- Hot days in 30 yrs
- 20 days/yr
Wind risk 2/10 · Minimal
- Chance of severe wind over 30 yrs
- —
Air-quality risk 2/10 · Minimal
- Unhealthy air days now
- 1 days/yr
- Unhealthy air days in 30 yrs
- 1 days/yr
Risk factors via First Street. Map © Google.
Why this score? — see what drove the D- grade
The composite is a weighted blend of 9 inputs, each scored 0–100. Each bar is that input's sub-score; the figure is the points it added to the 100-point composite (weight × sub-score).
- Appreciation +10.0/10.0
- ARV discount +7.5/15.0
- Cash flow +5.2/30.0
- Schools +4.4/10.0
- Livability +4.0/5.0
- Rent growth +2.5/5.0
- Condition / age +2.5/5.0
- 1% rule +1.5/10.0
- DSCR +0.0/10.0
$365,000
🖨 Deal sheet 📄 Offer letter ✓ Due diligence
Listing remarks
Welcome to this beautifully designed 4-bedroom residence, where spacious living and timeless craftsmanship come together effortlessly. Thoughtfully laid out with an open-concept design, this home offers an ideal setting for both comfortable daily living and entertaining, featuring seamless transitions between the living, dining, and kitchen spaces. At the center of the home, the well-appointed kitchen features an oversized island designed for gathering, dining, and everyday functionality, complemented by durable and elegant flooring throughout the main living areas. In addition to the generously sized bedrooms, the home includes a dedicated office and a separate bonus room between two bedro
Key facts
- Open-concept design
- Dedicated office
- Private retreat
Tags
Property features AI
Finance
- Financial info: Property type: Residential single family
- HOA & community: Community clubhouse; Fitness center; Park; Pool; Sidewalks; Tennis courts
Exterior
- Parking: Attached garage; 2-car garage; Driveway; Garage door opener
- Security: See remarks
- Utilities: Public water; Public sewer; Electricity connected; Natural gas available and connected; Water connected; Sewer connected
- Home design: Single family residence; One story; Slab foundation
- Construction: Brick and wood siding exterior; Composition roof; Built on slab foundation
- Exterior features: Covered front and rear porches; Porch; Fenced front and back yard (wood); Landscaped yard with front sprinklers; Paved city street frontage; Public maintained road
Interior
- Kitchen: Range; Free-standing range; Electric cooktop; Dishwasher; Disposal; Stainless steel appliances
- Bedrooms: Master downstairs
- Flooring: Carpet; Tile; Vinyl
- Bathrooms: 2 full bathrooms
- Heating & cooling: Central heating; Central air; Electric cooling; Ceiling fans
- Interior features: Cathedral ceilings; Beamed ceilings; Crown molding; High ceilings; Open floor plan; Breakfast bar; Eat-in kitchen; Pantry; Recessed lighting; Soaking tub; Storage; Walk-in closets; Master suite on main level; Ceiling fans; Blinds and screens on windows; Wood-burning fireplace with glass doors
- Laundry & utility: Laundry room with washer and dryer hookups; Electric dryer hookup; Inside laundry
Neighborhood map
What this means for you Summary
Snapshot
- This is a 4-bed/2.0-bath single-family listed at $365k.
Deal economics
- At list price, monthly cash flow is $-830 ($-10k/yr) — negative.
- To cash-flow at today's rent, offer at most $218k (40.1% below list).
- To meet the 1% rule (rent ≥ 1% of price), the offer needs to be $237k (34.9% below list).
- Recommended offer: $218k (40.1% below list) — sets the bar for cash-flow.
Location & tenants
- Location reads 80/100 on livability (#43 in TX, #1,872 nationally) — a professional / high-income tenant draw. Strengths: cost of living A+, housing A+, health & safety A+; Watch: amenities F, commute F.
- Frenship ISD (urban): math 47% / reading 54% proficiency, ranked #162 of 826 in TX (top 20%) — acceptable for families but not a draw, mixed tenant base, ~2y average lease.
- Zoned schools: Frenship Middle (math 46% / reading 50%, grade C-, #400 of 1,662 statewide, top 24%, 833 students, 47% FRL); Frenship H S (math 44% / reading 65%, grade C-, #379 of 1,632 statewide, top 26%, 3,247 students, 46% FRL).
- Market conditions: 472 active listings in the ZIP; 5 comparable units currently listed for rent nearby; rentals leasing fast (median 14d on market — plan ~1-2 weeks tenant-placement turnaround); solid renter incomes; 2,219 units permitted in Lubbock County in 2024 (252 in 5+ unit buildings).
- This rent runs 34% of the median local income ($84k/yr) — at the standard rent-burdened threshold; future hikes will face affordability resistance.
Forward outlook
- In year one you build about $39k of equity ($3k loan paydown + $36k appreciation (10.0% local appreciation)).
- Lubbock County population projected at +39% by 2050 — long-run rental-demand tailwind backs the buy-and-hold thesis.
- By year 2, paydown + projected appreciation supports a ~$63k cash-out refi (75% LTV) — recoverable capital for the next deal without selling this one.
Negotiation context
- It's been on market 23 days — a 2% lower offer ($360k) is reasonable based on typical stale-listing flexibility.
Risks & watch-outs
- Climate carrying-cost: major wildfire risk; extreme-heat days projected 7→20/yr by 2055 (HVAC capex compounding) — expect insurance premiums to compound above CPI over the hold.
Questions for the listing agent
- What do current leases actually rent for vs. the listed asking? Can we see a recent rent roll and the last 12 months of T-12 income?
- Is there a deadline driving the sale (1031 exchange, divorce, estate, relocation)? That informs how much negotiation room exists.
- Schools are B-rated — typically a magnet for longer-tenancy family renters. What's the average tenant stay here, and is there a school-zone premium baked into asking?
- The area grade is low — what's the realistic commute time and amenity access for the typical tenant pool here? Any planned neighborhood developments (good or bad) we should know about?
- What's the average days-on-market for RENTAL listings here right now (not sales)? A rising rental-DOM trend means longer vacancies and softer asking-rent achievability than the comps imply.
- What's the recent tenant-quality profile in this submarket — average credit score on applications, eviction rate, late-payment / NSF rate, and stable-employment percentage? A property-management company in the area should have these aggregated.
- How much new for-sale + rental construction is in the pipeline within 1–3 miles? Heavy new supply typically softens prices + rents 12–24 months out; constrained supply supports both.
Investment metrics
- 1% rule
- 0.65% ✗
- Cap rate
- 3.57%
- Cash-on-cash
- -9.74%
- DSCR
- 0.57
- GRM
- 12.8
CMA / ARV
No comps found within radius.
Projected returns pro-forma
10.0% appreciation · 3.0% rent growth · sell at horizon
- IRR
- 17.5%
- Equity multiple
- 2.43×
- Total profit
- $146,105
- Equity at exit
- $328,821
- IRR
- 16.5%
- Equity multiple
- 5.62×
- Total profit
- $472,097
- Equity at exit
- $709,115
Cash invested: $102,200 (down + closing). Projections, not guarantees.
Landlord ↔ Tenant lean methodology
- Overall (STATE)
- 87 Strongly Landlord-Friendly
- State Texas
- 87 Strongly Landlord-Friendly · R+5
- County
- — inherits STATE
- City
- — inherits STATE
ZIP-level market 79382
- Active inventory
- 472
- Price-to-rent
- 12.8×
Monthly cashflow live
- Estimated rent
- $2,375 high interval (Pro) →
- Mortgage (P&I)
- −$1,914
- Tax from tax record
- −$640 /mo · $7,675/yr
- Insurance
- −$152
- HOA
- −$0
- Vacancy / Maint / Mgmt
- −$499
- Net cashflow
- $-830
Break-even live
UW: 25.0% down · 7.5% · 30yr · 1.5% tax · 5.0% vac · 8.0% maint · 8.0% mgmt
Financing live
Cash to close
- Down payment
- $91,250
- Closing costs
- $10,950
- Reserves months
- —
- Total cash needed
- —
Loan-product check · same deal, 3 products live
Conventional
25% down · 7.5% · 30yr
- Down + closing
- —
- Monthly P&I
- —
- Monthly cashflow
- —
- DSCR
- —
- Eligible?
- —
Personal DTI + credit; lowest rate.
DSCR
20% down · 8.5% · 30yr
- Down + closing
- —
- Monthly P&I
- —
- Monthly cashflow
- —
- DSCR
- —
- Eligible?
- —
No personal income docs; deal must DSCR.
Hard money
10% down · 12.0% · 12mo
- Down + closing
- —
- Monthly P&I
- —
- Monthly cashflow
- —
- DSCR
- —
- Eligible?
- —
Short-term bridge; refi at stabilization.
Rent comps 5 comps
| Address | Beds | Baths | Sqft | Rent | $/sqft | DOM | Units | Dist |
|---|---|---|---|---|---|---|---|---|
| 213 Wildcat St Wolfforth, TX | 4.0 | 3.0 | 2811 | $2,800 | $1.00 | 13d | 1 | 0.93mi |
| 209 Sooner St Wolfforth, TX | 3.0 | 2.0 | 1951 | $1,875 | $0.96 | 43d | 1 | 1.02mi |
| 328 Ranger St Wolfforth, TX | 4.0 | 2.0 | 2045 | $2,450 | $1.20 | 13d | 1 | 1.26mi |
| 7619 59th St Lubbock, TX | 4.0 | 3.0 | 2271 | $2,695 | $1.19 | 13d | 1 | 1.30mi |
| 127 Brooke Blvd Wolfforth, TX | 3.0 | 2.5 | 1714 | $1,757 | $1.03 | 13d | 2 | 1.49mi |
Listing history 12 events
-
2026-06-07statusdays on market $365,000 Pending 23 DOM
-
2026-06-05days on market $365,000 Active 22 DOM
-
2026-06-03days on market $365,000 Active 21 DOM
-
2026-06-02days on market $365,000 Active 20 DOM
-
2026-06-01days on market $365,000 Active 19 DOM
-
2026-05-31days on market $365,000 Active 18 DOM
-
2026-05-30days on market $365,000 Active 17 DOM
-
2026-05-13$375,000 Active
-
2025-10-31price $375,000
-
2025-07-15price $390,000
-
2014-02-03soldstatus
-
2005-11-15soldstatus
ⓘ Source: listings_history table (triggers on properties + properties_extension) + one-shot
backfill from property_details.listing_events for pre-trigger history.
Tax reassessment forecast TX · Resets to sale price
- Current annual tax
- $7,675 · $640/mo
- Projected year-2 tax
- $7,675 · $640/mo
- Expected delta
- $0/yr ($0/mo · 0.0%)
ⓘ Screening estimate from a state-policy table — verify with the county assessor before closing.
Climate risk First Street
- Flood 1/10 Low FEMA zone X (unshaded) · 0% chance over 30 yrs
- Wildfire 6/10 Major
- Heat 5/10 Major 7 d/yr ≥99°F today · 20 d/yr by 30 yrs out
- Wind 2/10 Low
- Air quality 2/10 Low 1 unhealthy d/yr today · 1 by 30 yrs out
Nearby sold comps map
Loading sold comps map…
Walkable amenities ~0.75 mi
Loading nearby amenities…
Taxation est. · year 1
- Rental income
- $28,500
- − Mortgage interest
- −$20,446
- − Property taxes
- −$7,675
- − Insurance
- −$1,825
- − Repairs & maintenance
- −$2,280
- − Management
- −$2,280
- − Depreciation
- −$10,618
- Taxable loss
- −$16,624
- Est. tax savings @ 24.0%
- +$3,990
- After-tax cash flow
- $-5,964/yr
For passive investors: Depreciation is non-cash, so a rental often shows a tax loss while cash-flowing — sheltering income. Rental losses are passive: they offset passive income freely, and up to $25,000/yr can offset ordinary (W-2) income if you actively participate and your MAGI is under $100k (phasing out to $0 by $150k); unused losses carry forward. On sale, claimed depreciation is recaptured at up to 25%, and gains may owe capital-gains tax (a 1031 exchange can defer both). Figures are a year-1 estimate at your 24.0% rate — not tax advice; consult a CPA.
Schools (NCES district)
- District
- Frenship ISD
- NCES district ID
- 4819830
- Math proficiency
- 47% ▼ -8.00%
- Reading proficiency
- 54% ▬ 0.00%
- Median HH income
- $54,376
- Composite
- 43.59/100
- National rank
- #2976
- State rank
- #162 of 826 in TX
Livability — Wolfforth
- Score
- 80/100
- State rank
- #43
- US rank
- #1872
Category grades
Schools grade is shown separately in the Schools card above.
Census & demographics
- Census place
- Wolfforth, TX
- County
- Lubbock County · 293,542 people
- City population
- 10,512
- Metro
- Lubbock, TX
- Population (ZIP)
- 10,512
- Household income
- $84,457
- Rent vs Own
- Severe rent burden
- 135.0
Population outlook (Lubbock County) Hauer SSP2
- Today (2025)
- 345,960 people
- By 2030
- 371,449 · +7.4%
- By 2040
- 424,539 · +22.7%
- By 2050
- 481,150 · +39.1%
- By 2075
- 633,467 · +83.1%
- By 2100
- 746,853 · +115.9%
Race, ethnicity, and origin ACS 2023
- Neighborhood character
- Majority White (64%)
- Race & ethnicity
- White 64% Hispanic / Latino 31% Two or more races 18% Black 1%
- Hispanic origin (detail)
- Mexican 28%
- Common ancestry
- Italian 4% Slovak 2% Lithuanian 2%
- Foreign-born
- 4% · Canada
- Languages at home
- 85% English-only · Spanish 14%
Political lean MEDSL · Lubbock
- 2024 margin
- Solid R (+39.5) · D 29.7% · R 69.2% · Other 1.0%
- 2008→2024 swing
- -2.8pp toward R · 2008: -36.7pp · 2024: -39.5pp
- All cycles
- 2024: R+39.5 2020: R+32.2 2016: R+38.4 2012: R+40.9 2008: R+36.7
Not yet ingested
- Civics
- —
Market trends
- HPI YoY
- ▲ 166.08%
- Current HPI
- 561.4491
- Rent YoY
- —
- Metro
- Lubbock, TX
- State GDP YoY
- ▲ 3.95%
- F500 in state
- 110
Industry mix (Fortune 500 HQ in TX)
| Industry | F500 HQs | Revenue |
|---|---|---|
| Energy | 16 | $1,198B |
|
||
| Technology | 5 | $198B |
|
||
| Engineering / Construction | 4 | $72B |
|
||
| Energy Services | 3 | $60B |
|
||
| Utilities | 3 | $41B |
|
||
| Healthcare | 2 | $330B |
|
||
Price history
-3.8% since first listed5 events — show timeline
- 2026-05-13 Listed $375,000 LARMLS
- 2025-10-31 Price Changed $375,000 LARMLS
- 2025-07-15 Price Changed $390,000 LARMLS
- 2014-02-03 Sold (Public Records) — Public Records
- 2005-11-15 Sold (Public Records) — Public Records
Property tax history
+3.4%/yrLatest (2025): $7,675 · +7.8% YoY. Source: county tax records.
Cash-flow waterfall
monthlySold comps — $/sqft
last 12 mo · ≤1 miLoading sold comps…