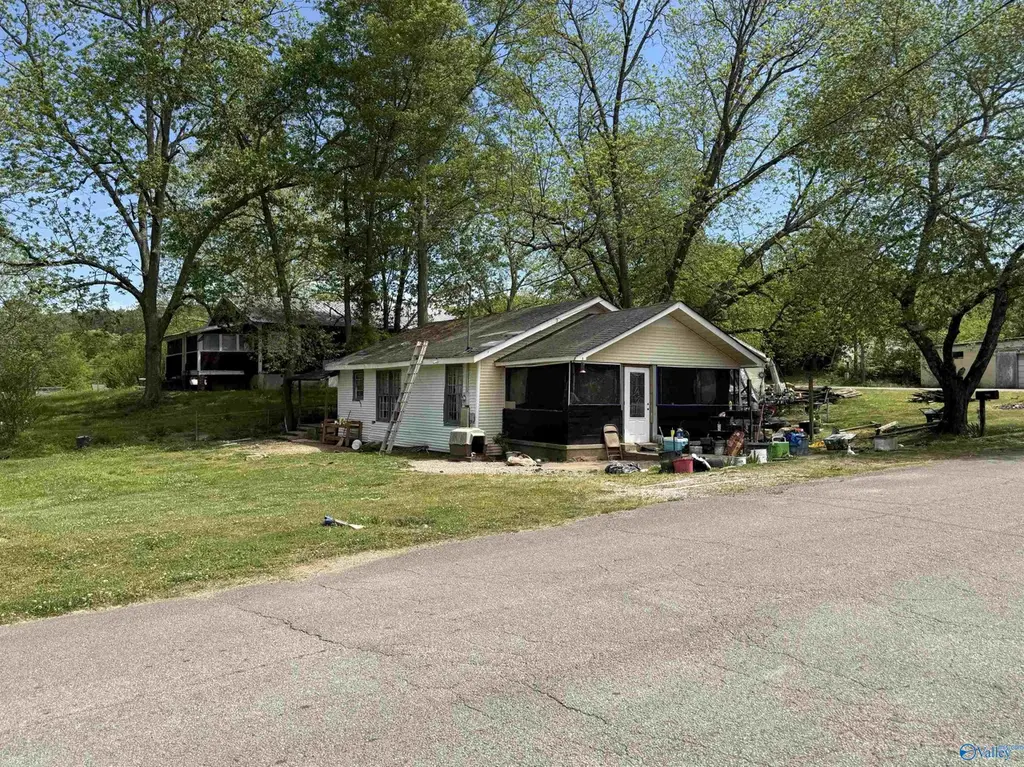
7081 7th Ave · Altoona, AL
Flood risk 1/10 · Minimal
- FEMA flood zone
- X (unshaded)
- Chance of flooding over 30 yrs
- 0.0%
- Est. flood insurance / yr
- $507 – $1,088
Fire risk 4/10 · Minor
- Est. fire insurance / yr
- $916 – $1,700
Heat risk 5/10 · Moderate
- Hot days now (above 104°F)
- 7 days/yr
- Hot days in 30 yrs
- 20 days/yr
Wind risk 5/10 · Moderate
- Chance of severe wind over 30 yrs
- 25.0%
Air-quality risk 2/10 · Minimal
- Unhealthy air days now
- 1 days/yr
- Unhealthy air days in 30 yrs
- 1 days/yr
Risk factors via First Street. Map © Google.
Why this score? — see what drove the B+ grade
The composite is a weighted blend of 9 inputs, each scored 0–100. Each bar is that input's sub-score; the figure is the points it added to the 100-point composite (weight × sub-score).
- Cash flow +30.0/30.0
- 1% rule +10.0/10.0
- DSCR +10.0/10.0
- Appreciation +10.0/10.0
- ARV discount +7.5/15.0
- Schools +3.1/10.0
- Livability +3.1/5.0
- Rent growth +2.5/5.0
- Condition / age +2.5/5.0
$49,900
🖨 Deal sheet (PDF) 📄 Offer letter ✓ Due diligence
Listing remarks
Fixer-upper on a corner lot in Altoona city limits. Home needs extensive repairs and is sold as-is. Lot offers potential for residential or commercial use—great investment opportunity.
Key facts
- Corner lot
- 0.78 acre lot
- Built 1910
Tags
Property features AI
Finance
- Other: Subdivision: Metes And Bounds
- HOA & community: No homeowners association
Exterior
- Parking: Gravel driveway
- Utilities: Public sewer; Electric power
- Home design: Single-family residence; One level; Built in 1910; Vinyl siding
- Construction: Vinyl siding construction; Built in 1910
- Exterior features: Corner lot; Approximately 0.78 acre lot
Interior
- Bathrooms: 1 full bathroom
- Heating & cooling: Electric heating; Electric cooling
- Interior features: Crawl space basement
Neighborhood map
What this means for you Summary
Snapshot
- This is a 2-bed/1.0-bath single-family listed at $50k.
Deal economics
- At list price, monthly cash flow is $812 ($10k/yr) — positive.
- The deal already cash-flows at list — no discount required.
- Meets the 1% rule at list price ($1k rent vs $50k).
- Recommended offer: $48k (3.0% below list) — sets the bar for market timing.
Location & tenants
- Location reads 61/100 on livability (#236 in AL) — a middle-class / working-renter tenant base. Strengths: crime A+, cost of living A+, housing A+; Watch: amenities F, commute F, employment F.
- Etowah County (suburban): math 21% / reading 52% proficiency, ranked #36 of 129 in AL (top 28%) — families likely to look elsewhere, expect single-tenant / working-renter base with shorter leases.
- Zoned schools: West End Elementary School (math 27% / reading 57%, grade F, #213 of 627 statewide, top 37%, 390 students, 78% FRL); West End High School (math 2% / reading 27%, grade F, #216 of 305 statewide, top 72%, 370 students, 75% FRL) — zoned schools average 76% FRL vs 41% district-wide (36 pts higher); higher-poverty schools than district average — tighter screening recommended.
- Market conditions: 38 active listings in the ZIP; 119 units permitted in Etowah County in 2024 (0 in 5+ unit buildings).
Forward outlook
- In year one you build about $5k of equity ($345 loan paydown + $5k appreciation (10.0% local appreciation)).
- Etowah County population projected at -12% by 2050 — secular population decline; favor cash flow + early exit over multi-decade hold.
- At projected returns (10.0% appreciation + 3.0% rent growth), your $14k cash investment doubles in ~1 year — after that, you're playing with house money.
- By year 6, paydown + projected appreciation supports a ~$31k cash-out refi (75% LTV) — recoverable capital for the next deal without selling this one.
Negotiation context
- It's been on market 60 days — a 3% lower offer ($48k) is reasonable based on typical stale-listing flexibility.
Risks & watch-outs
- Watch-outs: built in 1910 — expect roof / HVAC / electrical / plumbing capex.
- Climate carrying-cost: moderate wind risk, 25% chance of damaging wind over 30y; extreme-heat days projected 7→20/yr by 2055 (HVAC capex compounding) — expect insurance premiums to compound above CPI over the hold.
Questions for the listing agent
- It's been on market 60 days. Have you received any prior offers? Is the seller open to a 3% concession, seller financing, or rate buy-down credit?
- Built in 1910 — when were the roof, HVAC, electrical panel, plumbing, and water heater last replaced?
- Is there a deadline driving the sale (1031 exchange, divorce, estate, relocation)? That informs how much negotiation room exists.
- Schools are F-rated, which usually means shorter tenancies and higher turnover. Who's the typical renter profile here, and what's been the actual vacancy rate?
- What's the average days-on-market for RENTAL listings here right now (not sales)? A rising rental-DOM trend means longer vacancies and softer asking-rent achievability than the comps imply.
- What's the recent tenant-quality profile in this submarket — average credit score on applications, eviction rate, late-payment / NSF rate, and stable-employment percentage? A property-management company in the area should have these aggregated.
- How much new for-sale + rental construction is in the pipeline within 1–3 miles? Heavy new supply typically softens prices + rents 12–24 months out; constrained supply supports both.
Investment metrics
- 1% rule
- 2.87% ✓
- Cap rate
- 25.82%
- Cash-on-cash
- 69.75%
- DSCR
- 4.10
- GRM
- 2.9
CMA / ARV
- ARV (median comp)
- $143,688
- List price
- $49,900
- Delta
- -65.27%
- Verdict
- UNDERPRICED
- Comps
- 15 within 1.0 mi
Show comp detail 8 sales within ~0.75 mi
| Address | Dist | Beds/Ba | Sqft | Sold | Price | $/sf | Match |
|---|---|---|---|---|---|---|---|
| 7130 7th Ave | 0.07mi | 2/2.0 | 1,200 (+5%) | 8mo | $60,000 | $50 | 77 |
| 2770 Self St | 0.38mi | 3/1.0 (+1) | 1,132 (-0%) | 7mo | $140,000 | $124 | 71 |
| 7392 7th Ave | 0.31mi | 3/2.0 (+1) | 1,170 (+3%) | 19mo | $155,000 | $132 | 56 |
| 7345 7th Ave | 0.26mi | 3/2.0 (+1) | 1,276 (+12%) | 5mo | $219,000 | $172 | 55 |
| 7365 Robbins Rd | 0.40mi | 3/1.0 (+1) | 1,000 (-12%) | 7mo | $26,500 | $27 | 50 |
| 7456 4th Ave | 0.46mi | 3/1.0 (+1) | 1,008 (-11%) | 6mo | $16,500 | $16 | 50 |
| 2549 Saint Clair St | 0.52mi | 2/1.0 | 1,205 (+6%) | 22mo | $24,900 | $21 | 48 |
| 7015 10th Ave | 0.20mi | 3/2.0 (+1) | 1,300 (+14%) | 13mo | $150,000 | $115 | 47 |
Match score weights: distance 35% · size 25% · config 20% · recency 20%. Top-matched comps best support the ARV.
Projected returns pro-forma
10.0% appreciation · 3.0% rent growth · sell at horizon
- IRR
- 80.8%
- Equity multiple
- 6.65×
- Total profit
- $78,909
- Equity at exit
- $44,954
- IRR
- 75.0%
- Equity multiple
- 14.72×
- Total profit
- $191,706
- Equity at exit
- $96,945
Cash invested: $13,972 (down + closing). Projections, not guarantees.
Landlord ↔ Tenant lean methodology
- Overall (STATE)
- 90 Strongly Landlord-Friendly
- State Alabama
- 90 Strongly Landlord-Friendly · R+15
- County
- — inherits STATE
- City
- — inherits STATE
ZIP-level market 35952
- Home prices YoY
- 6.0%
- Active inventory
- 38
- Price-to-rent
- 2.9×
Monthly cashflow live
- Estimated rent
- $1,431 medium interval (Pro) →
- Mortgage (P&I)
- −$262
- Tax from tax record
- −$36 /mo · $428/yr
- Insurance
- −$21
- HOA
- −$0
- Vacancy / Maint / Mgmt
- −$300
- Net cashflow
- $812
Break-even live
Sensitivity live
| Price | -10% $840 | -5% $826 | +0% $812 | +5% $798 | +10% $784 |
|---|---|---|---|---|---|
| Rent | -10% $699 | -5% $756 | +0% $812 | +5% $869 | +10% $925 |
| Rate | -1.0pp $837 | -0.5pp $825 | base $812 | +0.5pp $799 | +1.0pp $786 |
UW: 25.0% down · 7.5% · 30yr · 1.5% tax · 5.0% vac · 8.0% maint · 8.0% mgmt
Financing live
Cash to close
- Down payment
- $12,475
- Closing costs
- $1,497
- Reserves months
- —
- Total cash needed
- —
Loan-product check · same deal, 3 products live
Conventional
25% down · 7.5% · 30yr
- Down + closing
- —
- Monthly P&I
- —
- Monthly cashflow
- —
- DSCR
- —
- Eligible?
- —
Personal DTI + credit; lowest rate.
DSCR
20% down · 8.5% · 30yr
- Down + closing
- —
- Monthly P&I
- —
- Monthly cashflow
- —
- DSCR
- —
- Eligible?
- —
No personal income docs; deal must DSCR.
Hard money
10% down · 12.0% · 12mo
- Down + closing
- —
- Monthly P&I
- —
- Monthly cashflow
- —
- DSCR
- —
- Eligible?
- —
Short-term bridge; refi at stabilization.
Listing history 19 events
-
2026-06-22days on market $49,900 Active 60 DOM
-
2026-06-19days on market $49,900 Active 58 DOM
-
2026-06-18days on market $49,900 Active 57 DOM
-
2026-06-17days on market $49,900 Active 56 DOM
-
2026-06-16days on market $49,900 Active 55 DOM
-
2026-06-15days on market $49,900 Active 54 DOM
-
2026-06-14days on market $49,900 Active 52 DOM
-
2026-06-13days on market $49,900 Active 51 DOM
-
2026-06-10days on market $49,900 Active 49 DOM
-
2026-06-09days on market $49,900 Active 48 DOM
-
2026-06-08days on market $49,900 Active 47 DOM
-
2026-06-07days on market $49,900 Active 46 DOM
-
2026-06-05days on market $49,900 Active 43 DOM
-
2026-06-03days on market $49,900 Active 42 DOM
-
2026-06-02days on market $49,900 Active 41 DOM
-
2026-06-01days on market $49,900 Active 40 DOM
-
2026-05-31days on market $49,900 Active 39 DOM
-
2026-05-30days on market $49,900 Active 38 DOM
-
2026-04-22$49,900 Active 190-char remark
ⓘ Source: listings_history table (triggers on properties + properties_extension) + one-shot
backfill from property_details.listing_events for pre-trigger history.
Tax reassessment forecast AL · Resets to sale price
- Current annual tax
- $428 · $36/mo
- Projected year-2 tax
- $428 · $36/mo
- Expected delta
- $0/yr ($0/mo · 0.0%)
ⓘ Screening estimate from a state-policy table — verify with the county assessor before closing.
Climate risk First Street
- Flood 1/10 Low FEMA zone X (unshaded) · 0% chance over 30 yrs
- Wildfire 4/10 Moderate
- Heat 5/10 Major 7 d/yr ≥104°F today · 20 d/yr by 30 yrs out
- Wind 5/10 Major 25% chance of damaging wind over 30 yrs
- Air quality 2/10 Low 1 unhealthy d/yr today · 1 by 30 yrs out
Nearby sold comps map
Loading sold comps map…
Walkable amenities ~0.75 mi
Loading nearby amenities…
Taxation est. · year 1
- Rental income
- $17,169
- − Mortgage interest
- −$2,795
- − Property taxes
- −$428
- − Insurance
- −$250
- − Repairs & maintenance
- −$1,373
- − Management
- −$1,373
- − Depreciation
- −$1,452
- Taxable income
- $9,498
- Est. tax owed @ 24.0%
- −$2,279
- After-tax cash flow
- $7,466/yr
For passive investors: Depreciation is non-cash, so a rental often shows a tax loss while cash-flowing — sheltering income. Rental losses are passive: they offset passive income freely, and up to $25,000/yr can offset ordinary (W-2) income if you actively participate and your MAGI is under $100k (phasing out to $0 by $150k); unused losses carry forward. On sale, claimed depreciation is recaptured at up to 25%, and gains may owe capital-gains tax (a 1031 exchange can defer both). Figures are a year-1 estimate at your 24.0% rate — not tax advice; consult a CPA.
Schools (NCES district)
- District
- Etowah County
- NCES district ID
- 0101380
- Math proficiency
- 21% ▼ -28.00%
- Reading proficiency
- 52% ▼ -1.00%
- Median HH income
- $46,403
- Composite
- 31.12/100
- National rank
- #6062
- State rank
- #36 of 129 in AL
Livability — Altoona
- Score
- 61/100
- State rank
- #236
- US rank
- #17385
Category grades
Schools grade is shown separately in the Schools card above.
Census & demographics
- Census place
- Altoona, AL
- Population (ZIP)
- 8,901
Population outlook (Etowah County) Hauer SSP2
- Today (2025)
- 100,500 people
- By 2030
- 98,488 · -2.0%
- By 2040
- 93,731 · -6.7%
- By 2050
- 88,681 · -11.8%
- By 2075
- 76,746 · -23.6%
- By 2100
- 65,373 · -35.0%
Race, ethnicity, and origin ACS 2023
- Neighborhood character
- Predominantly White (87%)
- Race & ethnicity
- White 87% Hispanic / Latino 12% Two or more races 2%
- Hispanic origin (detail)
- Mexican 11%
- Common ancestry
- Iranian 3% Slovak 1% Lithuanian 1%
- Foreign-born
- 7% · Canada
- Languages at home
- 88% English-only · Spanish 11%
Political lean MEDSL · Etowah
- 2024 margin
- Solid R (+55.7) · D 21.8% · R 77.5%
- 2008→2024 swing
- -17.5pp toward R · 2008: -38.2pp · 2024: -55.7pp
- All cycles
- 2024: R+55.7 2020: R+50.2 2016: R+50.1 2012: R+38.4 2008: R+38.2
Not yet ingested
- Civics
- —
Market trends
- HPI YoY
- ▲ 14.05%
- Current HPI
- 249.8629
- Rent YoY
- —
- Metro
- —
- State GDP YoY
- ▲ 2.94%
- F500 in state
- 4
Industry mix (Fortune 500 HQ in AL)
| Industry | F500 HQs | Revenue |
|---|---|---|
| Financial Services | 1 | $8B |
|
||
| Healthcare | 1 | $5B |
|
||
Price history
1 event — show timeline
- 2026-04-22 Listed $49,900 VMLS
Property tax history
+4.7%/yrLatest (2025): $428 · +0.0% YoY. Source: county tax records.
Cash-flow waterfall
monthlySold comps — $/sqft
last 12 mo · ≤1 miLoading sold comps…