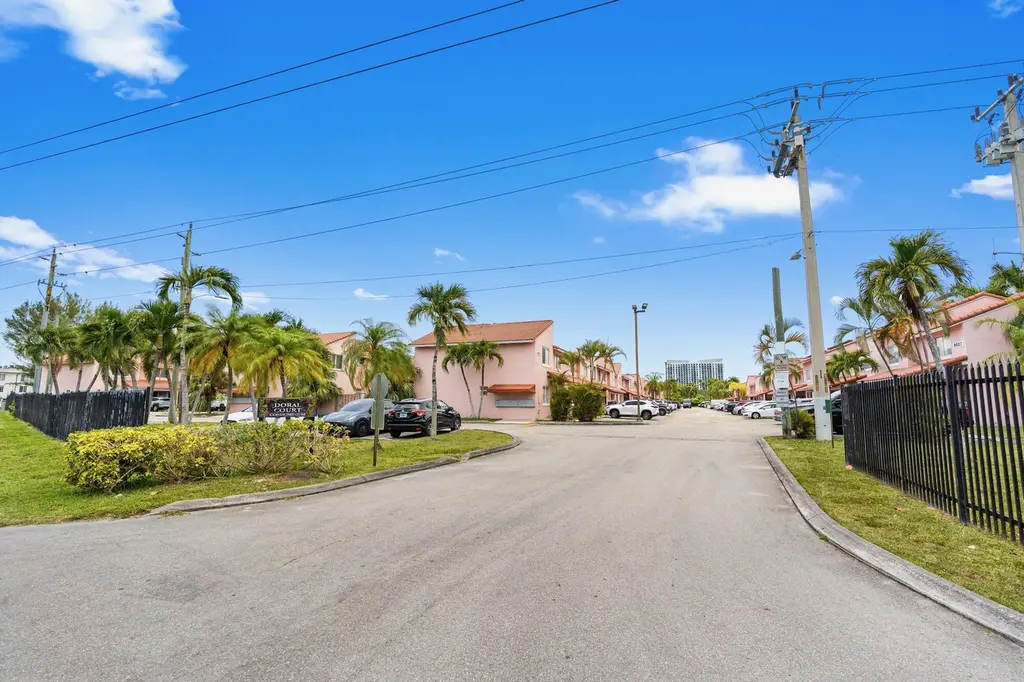
8039 Lake Dr #205 · Doral, FL
Flood risk 1/10 · Minimal
- FEMA flood zone
- X (unshaded)
- Chance of flooding over 30 yrs
- 0.0%
- Est. flood insurance / yr
- $507 – $1,088
Fire risk 1/10 · Minimal
- Est. fire insurance / yr
- $947 – $1,759
Heat risk 10/10 · Severe
- Hot days now (above 106°F)
- 8 days/yr
- Hot days in 30 yrs
- 32 days/yr
Wind risk 10/10 · Severe
- Chance of severe wind over 30 yrs
- 99.0%
Air-quality risk 2/10 · Minimal
- Unhealthy air days now
- 1 days/yr
- Unhealthy air days in 30 yrs
- 1 days/yr
Risk factors via First Street. Map © Google.
Why this score? — see what drove the D grade
The composite is a weighted blend of 9 inputs, each scored 0–100. Each bar is that input's sub-score; the figure is the points it added to the 100-point composite (weight × sub-score).
- Cash flow +12.0/30.0
- ARV discount +7.5/15.0
- 1% rule +4.3/10.0
- Schools +4.2/10.0
- Livability +4.0/5.0
- DSCR +3.5/10.0
- Rent growth +2.7/5.0
- Condition / age +2.5/5.0
- Appreciation +0.0/10.0
$240,000
🖨 Deal sheet 📄 Offer letter ✓ Due diligence
Listing remarks
Don't miss this opportunity to own a spacious condo in the desirable Doral area! This unit offers strong potential for both investors and owner-occupants looking to add their personal touch. Featuring a functional layout with generous living spaces, ample natural light, and plenty of storage throughout. The community offers beautifully maintained grounds, pool amenities, and convenient access to major highways, shopping, dining, and top-rated schools. Property includes assigned parking and low-maintenance condo living in a high-demand rental market. Perfect for a buy-and-hold investment, first-time buyer, or light renovation project with upside potential. Centrally located near Miami Intern
Key facts
- Ample natural light
- Plenty of storage
- Functional layout
Tags
Property features AI
Finance
- HOA & community: Monthly HOA fee of $308 covering common areas; Association amenities: Other; Pets allowed (restrictions may apply)
Exterior
- Parking: Assigned parking; Driveway; Open parking (2 total spaces); No carport
- Security: Smoke detector(s)
- Utilities: Public water; Public sewer; Electricity connected (circuit breakers)
- Home design: Condominium; Two stories; Faces east
- Construction: Stucco and CBS construction; Tile roof
- Exterior features: Not waterfront
Interior
- Kitchen: Dishwasher; Electric range; Microwave; Refrigerator
- Bedrooms: Two-story layout (no main-level bedrooms specified)
- Flooring: Carpet; Tile
- Bathrooms: 2 full bathrooms
- Heating & cooling: Central heating; Central air conditioning
- Interior features: Smoke detectors installed; Resale condition
- Laundry & utility: Inside laundry room
Neighborhood map
What this means for you Summary
Snapshot
- This is a 2-bed/2.0-bath condo listed at $240k.
Deal economics
- At list price, monthly cash flow is $-58 ($-690/yr) — negative.
- To cash-flow at today's rent, offer at most $230k (4.2% below list).
- To meet the 1% rule (rent ≥ 1% of price), the offer needs to be $224k (6.8% below list).
- Recommended offer: $224k (6.8% below list) — sets the bar for 1% rule.
- Cap rate 6.0% vs local median 2.8% in Doral — top-decile yield for the area; either an underpriced asset or a hidden risk that comps aren't pricing in. Stress-test before assuming the spread holds.
Location & tenants
- Location reads 80/100 on livability (#122 in FL, #1,868 nationally) — a professional / high-income tenant draw. Strengths: crime A+, commute A+, employment A+; Watch: amenities D, cost of living F.
- Miami-Dade (suburban): math 45% / reading 54% proficiency, ranked #40 of 73 in FL (top 55%) — families likely to look elsewhere, expect single-tenant / working-renter base with shorter leases; 64% free/reduced lunch — lower-income household profile, screen leases tightly.
- Zoned schools: John I. Smith K-8 Center (math 57% / reading 58%, grade C+, #764 of 2,144 statewide, top 36%, 1,001 students, 31% FRL); Ruben Dario Middle School (math 32% / reading 45%, grade F, #384 of 571 statewide, top 68%, 549 students, 62% FRL); Ronald W. Reagan/Doral Senior High School (math 23% / reading 45%, grade F, #394 of 667 statewide, top 60%, 1,591 students, 30% FRL) — zoned schools average 41% FRL vs 64% district-wide (23 pts lower); this property's tenant base skews higher-income than the district average.
- Market conditions: Rents flat; 223 active listings in the ZIP; 40 comparable units currently listed for rent nearby; rentals at typical pace (median 19d on market — plan ~3-4 weeks tenant-placement turnaround); solid renter incomes; 10,051 units permitted in Miami-Dade County in 2024 (7,758 in 5+ unit buildings).
- This rent runs 33% of the median local income ($82k/yr) — at the standard rent-burdened threshold; future hikes will face affordability resistance.
Forward outlook
- Local home prices are declining (-3.0%/yr); year-one equity from $2k of loan paydown is wiped out by about $7k of value loss. Plan a longer hold.
- Miami-Dade County population projected at +28% by 2050 — long-run rental-demand tailwind backs the buy-and-hold thesis.
Negotiation context
- It's been on market 15 days — a 2% lower offer ($236k) is reasonable based on typical stale-listing flexibility.
- Current owner paid $56k; list at $240k implies a 325% gain — meaningful room to come down on a strong offer.
Risks & watch-outs
- Climate carrying-cost: severe wind risk, 99% chance of damaging wind over 30y; extreme-heat days projected 8→32/yr by 2055 (HVAC capex compounding) — expect insurance premiums to compound above CPI over the hold.
Questions for the listing agent
- What do current leases actually rent for vs. the listed asking? Can we see a recent rent roll and the last 12 months of T-12 income?
- What does the HOA fee cover, when was the last increase, and are there any pending special assessments or reserve-fund shortfalls?
- Any open or pending special assessments — roof, HVAC, plumbing, elevator, façade? What's the per-unit balance and payoff schedule, and is the seller paying it off at close or rolling it to the buyer?
- Is there a deadline driving the sale (1031 exchange, divorce, estate, relocation)? That informs how much negotiation room exists.
- Schools are A-rated — typically a magnet for longer-tenancy family renters. What's the average tenant stay here, and is there a school-zone premium baked into asking?
- The area grade is low — what's the realistic commute time and amenity access for the typical tenant pool here? Any planned neighborhood developments (good or bad) we should know about?
- What's the average days-on-market for RENTAL listings here right now (not sales)? A rising rental-DOM trend means longer vacancies and softer asking-rent achievability than the comps imply.
- What's the recent tenant-quality profile in this submarket — average credit score on applications, eviction rate, late-payment / NSF rate, and stable-employment percentage? A property-management company in the area should have these aggregated.
- How much new apartment / multifamily construction is in the pipeline within 1–3 miles? Heavy new supply (>2% of stock underway) typically softens rents 12–24 months out; light construction supports rent growth.
Investment metrics
- 1% rule
- 0.93% ✗
- Cap rate
- 6.01%
- Cash-on-cash
- -1.03%
- DSCR
- 0.95
- GRM
- 8.9
CMA / ARV
No comps found within radius.
Projected returns pro-forma
-3.0% appreciation · 0.6% rent growth · sell at horizon
- IRR
- -20.9%
- Equity multiple
- 0.29×
- Total profit
- $-47,695
- Equity at exit
- $35,785
- IRR
- -21.8%
- Equity multiple
- 0.01×
- Total profit
- $-66,334
- Equity at exit
- $20,751
Cash invested: $67,200 (down + closing). Projections, not guarantees.
Landlord ↔ Tenant lean methodology
- Overall (STATE)
- 87 Strongly Landlord-Friendly
- State Florida
- 87 Strongly Landlord-Friendly · R+3
- County
- — inherits STATE
- City
- — inherits STATE
ZIP-level market 33166
- Rents YoY
- 0.6%
- Active inventory
- 223
- Price-to-rent
- 8.9×
Monthly cashflow live
- Estimated rent
- $2,238 high interval (Pro) →
- Mortgage (P&I)
- −$1,259
- Tax from tax record
- −$159 /mo · $1,906/yr
- Insurance
- −$100
- HOA
- −$308
- Vacancy / Maint / Mgmt
- −$470
- Net cashflow
- $-58
Break-even live
UW: 25.0% down · 7.5% · 30yr · 1.5% tax · 5.0% vac · 8.0% maint · 8.0% mgmt
Financing live
Cash to close
- Down payment
- $60,000
- Closing costs
- $7,200
- Reserves months
- —
- Total cash needed
- —
Loan-product check · same deal, 3 products live
Conventional
25% down · 7.5% · 30yr
- Down + closing
- —
- Monthly P&I
- —
- Monthly cashflow
- —
- DSCR
- —
- Eligible?
- —
Personal DTI + credit; lowest rate.
DSCR
20% down · 8.5% · 30yr
- Down + closing
- —
- Monthly P&I
- —
- Monthly cashflow
- —
- DSCR
- —
- Eligible?
- —
No personal income docs; deal must DSCR.
Hard money
10% down · 12.0% · 12mo
- Down + closing
- —
- Monthly P&I
- —
- Monthly cashflow
- —
- DSCR
- —
- Eligible?
- —
Short-term bridge; refi at stabilization.
Rent comps 40 comps
| Address | Beds | Baths | Sqft | Rent | $/sqft | DOM | Units | Dist |
|---|---|---|---|---|---|---|---|---|
| 8005 Lake Dr #408 Doral, FL | 1.0 | 1.0 | 770 | $1,900 | $2.47 | 24d | 1 | 0.04mi |
| 5241 Geneva Way #202 Doral, FL | 1.0 | 1.0 | 810 | $1,850 | $2.28 | 14d | 1 | 0.08mi |
| 5241 Geneva Way #202 Doral, FL | 1.0 | 1.0 | 810 | $1,850 | $2.28 | 10d | 1 | 0.08mi |
| 8150 NW 53rd St Doral, FL | 1.0–3.0 | 1.0–2.0 | 999 | $3,404 | $3.41 | 2d | 19 | 0.08mi |
| 5231 Geneva Way #204 Doral, FL | 1.0 | 1.0 | 810 | $1,850 | $2.28 | 18d | 1 | 0.09mi |
| 5201 Geneva Way #308 Doral, FL | 1.0 | 1.0 | 810 | $1,900 | $2.35 | 14d | 1 | 0.11mi |
| 8235 Lake Dr #204 Doral, FL | 1.0 | 1.0 | 810 | $1,900 | $2.35 | 24d | 1 | 0.11mi |
| 8245 Lake Dr Doral, FL | 1.0 | 1.0 | 810 | $1,938 | $2.39 | 24d | 2 | 0.13mi |
| 8245 Lake Dr Doral, FL | 1.0 | 1.0 | 810 | $1,938 | $2.39 | 5d | 2 | 0.13mi |
| 5020 NW 79th Ave #303 Doral, FL | 2.0 | 2.0 | 1061 | $2,500 | $2.36 | 19d | 1 | 0.13mi |
| 8160 Geneva Ct Doral, FL | 1.0 | 1.0 | 710 | $1,950 | $2.75 | 7d | 4 | 0.14mi |
| 4920 NW 79th Ave Doral, FL | 1.0 | 1.0 | 810 | $1,900 | $2.35 | 24d | 2 | 0.15mi |
| 8255 Lake Dr #102 Doral, FL | 1.0 | 1.0 | 810 | $2,075 | $2.56 | 24d | 1 | 0.15mi |
| 8225 Lake Dr #107 Doral, FL | 1.0 | 1.0 | 810 | $2,100 | $2.59 | 17d | 1 | 0.15mi |
| 8215 Lake Dr #105 Doral, FL | 1.0 | 1.0 | 810 | $2,200 | $2.72 | 20d | 1 | 0.16mi |
| 8215 Lake Dr #108 Doral, FL | 1.0 | 1.0 | 810 | $2,100 | $2.59 | 24d | 1 | 0.16mi |
| 8215 Lake Dr #401 Doral, FL | 1.0 | 1.0 | 810 | $2,050 | $2.53 | 3d | 1 | 0.16mi |
| 8215 Lake Dr #108 Doral, FL | 1.0 | 1.0 | 810 | $2,100 | $2.59 | 4d | 1 | 0.16mi |
| 8180 Geneva Ct #322 Doral, FL | 2.0 | 2.0 | 992 | $2,450 | $2.47 | 17d | 1 | 0.17mi |
| 5102 NW 79th Ave #307 Doral, FL | 2.0 | 2.0 | 1061 | $2,200 | $2.07 | 24d | 1 | 0.17mi |
| 8180 Geneva Ct Doral, FL | 2.0 | 2.0 | 992 | $2,400 | $2.42 | 24d | 2 | 0.17mi |
| 8100 Geneva Ct Unit O Doral, FL | 1.0 | 1.0 | 810 | $1,900 | $2.35 | 24d | 1 | 0.18mi |
| 8100 Geneva Ct #233 Doral, FL | 1.0 | 1.0 | 710 | $1,950 | $2.75 | 17d | 1 | 0.18mi |
| 8100 Geneva Ct #345 Doral, FL | 1.0 | 1.0 | 710 | $2,000 | $2.82 | 15d | 1 | 0.18mi |
| 8100 Geneva Ct Doral, FL | 1.0–2.0 | 1.0–2.0 | 851 | $2,450 | $2.88 | 7d | 1 | 0.18mi |
| 8100 Geneva Ct Doral, FL | 1.0–2.0 | 1.0–2.0 | 851 | $2,450 | $2.88 | 4d | 2 | 0.18mi |
| 4910 NW 79th Ave Doral, FL | 1.0 | 1.0 | 810 | $1,938 | $2.39 | 2d | 2 | 0.18mi |
| 4910 NW 79th Ave Doral, FL | 1.0 | 1.0 | 810 | $2,000 | $2.47 | 24d | 1 | 0.18mi |
| 4810 NW 79th Ave #204 Doral, FL | 1.0 | 1.0 | 810 | $2,000 | $2.47 | 24d | 1 | 0.21mi |
| 4810 NW 79th Ave Doral, FL | 1.0 | 1.0 | 810 | $1,950 | $2.41 | 5d | 2 | 0.21mi |
| 8373 Lake Dr #307 Doral, FL | 1.0 | 1.0 | 810 | $2,000 | $2.47 | 20d | 1 | 0.21mi |
| 4920 NW 79th Ave #212 Doral, FL | 1.0 | 1.0 | 810 | $2,000 | $2.47 | 18d | 1 | 0.21mi |
| 8000 Lake Dr Doral, FL | 2.0 | 2.0 | 900 | $2,450 | $2.72 | 24d | 1 | 0.22mi |
| 8363 Lake Dr #308 Doral, FL | 1.0 | 1.0 | 810 | $2,000 | $2.47 | 20d | 1 | 0.23mi |
| 4800 NW 79th Ave Doral, FL | 1.0 | 1.0 | 810 | $1,900 | $2.35 | 24d | 2 | 0.24mi |
| 8323 Lake Dr #402 Doral, FL | 1.0 | 1.0 | 810 | $2,100 | $2.59 | 20d | 1 | 0.24mi |
| 8323 Lake Dr Doral, FL | 1.0 | 1.0 | 810 | $2,025 | $2.50 | 7d | 2 | 0.24mi |
| 8323 Lake Dr Doral, FL | 1.0 | 1.0 | 810 | $2,025 | $2.50 | 5d | 2 | 0.24mi |
| 4670 NW 79th Ave Unit 1H Doral, FL | 2.0 | 2.0 | 1060 | $2,300 | $2.17 | 17d | 1 | 0.25mi |
| 8353 Lake Dr #204 Doral, FL | 1.0 | 1.0 | 810 | $2,000 | $2.47 | 20d | 1 | 0.26mi |
HOA detail condo
- Monthly dues
- $308 · $3,696/yr
- Likely covers
- landscapingpoolparking
- Assessments
- None detected in remarks — confirm with the listing agent.
Listing history 3 events
-
2026-05-31status $240,000 Pending 15 DOM
-
2026-05-15$240,000 Active
-
1989-04-01soldstatus $56,500
ⓘ Source: listings_history table (triggers on properties + properties_extension) + one-shot
backfill from property_details.listing_events for pre-trigger history.
Tax reassessment forecast FL · Resets to sale price
- Current annual tax
- $1,906 · $159/mo
- Projected year-2 tax
- $1,992 · $166/mo
- Expected delta
- +$86/yr (+$7/mo · 4.5%)
ⓘ Screening estimate from a state-policy table — verify with the county assessor before closing.
Climate risk First Street
- Flood 1/10 Low FEMA zone X (unshaded) · 0% chance over 30 yrs
- Wildfire 1/10 Low
- Heat 10/10 Extreme 8 d/yr ≥106°F today · 32 d/yr by 30 yrs out
- Wind 10/10 Extreme 99% chance of damaging wind over 30 yrs
- Air quality 2/10 Low 1 unhealthy d/yr today · 1 by 30 yrs out
Nearby sold comps map
Loading sold comps map…
Walkable amenities ~0.75 mi
Loading nearby amenities…
Taxation est. · year 1
- Rental income
- $26,854
- − Mortgage interest
- −$13,444
- − Property taxes
- −$1,906
- − Insurance
- −$1,200
- − Repairs & maintenance
- −$2,148
- − Management
- −$2,148
- − HOA
- −$3,696
- − Depreciation
- −$6,982
- Taxable loss
- −$4,670
- Est. tax savings @ 24.0%
- +$1,121
- After-tax cash flow
- $431/yr
For passive investors: Depreciation is non-cash, so a rental often shows a tax loss while cash-flowing — sheltering income. Rental losses are passive: they offset passive income freely, and up to $25,000/yr can offset ordinary (W-2) income if you actively participate and your MAGI is under $100k (phasing out to $0 by $150k); unused losses carry forward. On sale, claimed depreciation is recaptured at up to 25%, and gains may owe capital-gains tax (a 1031 exchange can defer both). Figures are a year-1 estimate at your 24.0% rate — not tax advice; consult a CPA.
Schools (NCES district)
- District
- Miami-Dade
- NCES district ID
- 1200390
- Math proficiency
- 45% ▼ -16.00%
- Reading proficiency
- 54% ▼ -5.00%
- Median HH income
- $43,928
- Composite
- 41.76/100
- National rank
- #3397
- State rank
- #40 of 73 in FL
Livability — Doral
- Score
- 80/100
- State rank
- #122
- US rank
- #1868
Category grades
Schools grade is shown separately in the Schools card above.
Census & demographics
- Census place
- Doral, FL
- County
- Miami-Dade County · 2,697,751 people
- City population
- 67,789
- Metro
- Miami-Fort Lauderdale-Pompano Beach, FL
- Population (ZIP)
- 28,265
- Household income
- $81,581
- Rent vs Own
- Severe rent burden
- 2024.0
Population outlook (Miami-Dade County) Hauer SSP2
- Today (2025)
- 3,126,439 people
- By 2030
- 3,325,765 · +6.4%
- By 2040
- 3,697,561 · +18.3%
- By 2050
- 4,012,134 · +28.3%
- By 2075
- 4,605,612 · +47.3%
- By 2100
- 4,866,598 · +55.7%
Race, ethnicity, and origin ACS 2023
- Neighborhood character
- Predominantly Hispanic (82%)
- Race & ethnicity
- Hispanic / Latino 82% Two or more races 39% White 13% Black 2%
- Hispanic origin (detail)
- Mexican 1% Puerto Rican 3% Cuban 34% Dominican 3% Salvadoran 1%
- Common ancestry
- Hispanic 1% Lithuanian 1% Romanian 1%
- Foreign-born
- 59% · Canada, Jamaica, Dominican Republic
- Languages at home
- 21% English-only · Spanish 75% Other Indo-European 2% French/Haitian/Cajun 1%
Political lean MEDSL · Miami-Dade
- 2024 margin
- R (+11.4) · D 43.9% · R 55.4%
- 2008→2024 swing
- -27.6pp toward R · 2008: 16.1pp · 2024: -11.4pp
- All cycles
- 2024: R+11.4 2020: D+7.3 2016: D+29.6 2012: D+23.7 2008: D+16.1
Not yet ingested
- Civics
- —
Market trends
- HPI YoY
- ▼ -588.92%
- Current HPI
- 430.6383
- Rent YoY
- ▲ 0.60%
- Metro
- Miami-Fort Lauderdale-Pompano Beach, FL
- State GDP YoY
- ▲ 3.28%
- F500 in state
- 36
Industry mix (Fortune 500 HQ in FL)
| Industry | F500 HQs | Revenue |
|---|---|---|
| Industrial Technology | 2 | $29B |
|
||
| Insurance | 2 | $17B |
|
||
| Retail | 1 | $60B |
|
||
| Technology Distribution | 1 | $58B |
|
||
| Homebuilding | 1 | $35B |
|
||
| Technology Manufacturing | 1 | $35B |
|
||
Price history
+324.8% since first listed2 events — show timeline
- 2026-05-15 Listed $240,000 Beaches MLS
- 1989-04-01 Sold (Public Records) $56,500 Public Records
Property tax history
+9.2%/yrLatest (2025): $1,906 · +4.3% YoY. Source: county tax records.
Cash-flow waterfall
monthlySold comps — $/sqft
last 12 mo · ≤1 miLoading sold comps…