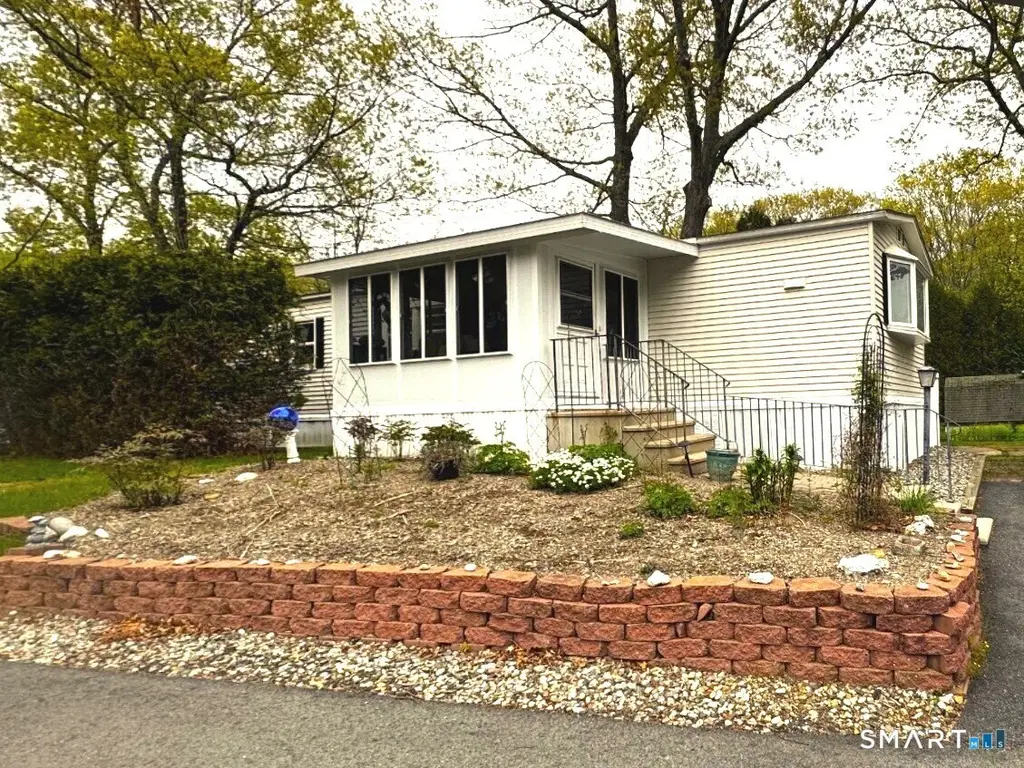
33 Ridge Cir · Storrs, CT
Flood risk 1/10 · Minimal
- FEMA flood zone
- X
- Chance of flooding over 30 yrs
- 0.0%
- Est. flood insurance / yr
- $507 – $1,088
Fire risk 3/10 · Minor
- Est. fire insurance / yr
- $829 – $1,539
Heat risk 4/10 · Minor
- Hot days now (above 94°F)
- 7 days/yr
- Hot days in 30 yrs
- 16 days/yr
Wind risk 6/10 · Moderate
- Chance of severe wind over 30 yrs
- 46.0%
Air-quality risk 3/10 · Minor
- Unhealthy air days now
- 3 days/yr
- Unhealthy air days in 30 yrs
- 4 days/yr
Risk factors via First Street. Map © Google.
Why this score? — see what drove the B- grade
The composite is a weighted blend of 9 inputs, each scored 0–100. Each bar is that input's sub-score; the figure is the points it added to the 100-point composite (weight × sub-score).
- Cash flow +26.9/30.0
- 1% rule +10.0/10.0
- DSCR +9.3/10.0
- ARV discount +7.5/15.0
- Schools +5.6/10.0
- Livability +4.1/5.0
- Rent growth +2.5/5.0
- Condition / age +2.5/5.0
- Appreciation +0.0/10.0
$102,500
🖨 Deal sheet (PDF) 📄 Offer letter ✓ Due diligence
Listing remarks
Located in Mansfield/Storrs nice Mobile Home in an OVER 55 Park near UConn, medical facilities, entertainment, shopping, restaurants and more. This 924sf home has 2-bedrooms and a full bathroom with a walk-in shower already in the unit. A 3-season room overlooks the front yard, flowers and plantings. Newer Roof, hot water heater 2021~, some new plumbing under the unit, kitchen refreshed in 2025. This home is the last unit on the left on Ridge Cir. Near restaurants, sport and cultural events. The park has a pool and gazebo to relax in or near, a clubhouse with many events, a library and a common room. All included on your lot fee. Park application required for buyers.
Key facts
- 2 parking spots
- Pool
- Built 1978
Property features AI
Finance
- Financial info: Professionally managed on-site
- HOA & community: Homeowners association with monthly fee; Association amenities include clubhouse and pool; HOA covers trash pickup, sewer, property management, pool service, and road maintenance
Exterior
- Parking: Paved off-street parking; 2 parking spaces
- Utilities: Public water connected; Public sewer (in street); Above-ground fuel tank
- Home design: Single-family home in an adult (55+) community
- Construction: Prefab construction; Piling foundation; Asphalt shingle roof
- Exterior features: Vinyl siding; Sloping lot; In-ground swimming pool with pool house
Interior
- Kitchen: Electric range; Range hood; Refrigerator; Dishwasher
- Bedrooms: 2 bedrooms
- Bathrooms: 1 full bathroom
- Heating & cooling: Hot air heating; Propane-powered heating; Electric hot water
- Interior features: Total of 4 rooms; No basement
- Laundry & utility: Washer and dryer included; Laundry located in a kitchen alcove on the main level
Neighborhood map
What this means for you Summary
Snapshot
- This is a 2-bed/1.0-bath manufactured listed at $102k.
Deal economics
- At list price, monthly cash flow is $282 ($3k/yr) — positive.
- The deal already cash-flows at list — no discount required.
- Meets the 1% rule at list price ($2k rent vs $102k).
Location & tenants
- Location reads 82/100 on livability (#8 in CT, #1,066 nationally) — a professional / high-income tenant draw. Strengths: amenities A+, commute A+, health & safety A+; Watch: employment F, housing F.
- Mansfield School District (rural): math 59% / reading 70% proficiency, ranked #36 of 153 in CT (top 24%) — acceptable for families but not a draw, mixed tenant base, ~2y average lease; only 18% free/reduced lunch — higher-income household profile.
- Zoned schools: Mansfield Elementary At Vinton (math 62% / reading 57%, grade B-, #159 of 553 statewide, top 31%, 271 students, 24% FRL); Mansfield Middle School (math 57% / reading 71%, grade B+, #32 of 175 statewide, top 18%, 463 students, 29% FRL); E. O. Smith High School (math 51% / reading 70%, grade C+, #44 of 194 statewide, top 22%, 1,073 students, 24% FRL).
- Market conditions: 37 active listings in the ZIP; 6 comparable units currently listed for rent nearby; rentals leasing fast (median 13d on market — plan ~1-2 weeks tenant-placement turnaround); 1,867 units permitted in Capitol Planning Region in 2024 (1,399 in 5+ unit buildings).
Forward outlook
- Local home prices are declining (-3.0%/yr); year-one equity from $709 of loan paydown is wiped out by about $3k of value loss. Plan a longer hold.
- At projected returns (-3.0% appreciation + 3.0% rent growth), your $29k cash investment doubles in ~10 years — after that, you're playing with house money.
Negotiation context
- Only 10 days on market — expect competitive offers; lowballing is unlikely to land.
- Current owner paid $46k; list at $102k implies a 123% gain — meaningful room to come down on a strong offer.
Risks & watch-outs
- Watch-outs: HOA is 29% of rent.
- Climate carrying-cost: major wind risk, 46% chance of damaging wind over 30y — expect insurance premiums to compound above CPI over the hold.
Questions for the listing agent
- Built in 1978 — when were the roof, HVAC, electrical panel, plumbing, and water heater last replaced?
- What does the HOA fee cover, when was the last increase, and are there any pending special assessments or reserve-fund shortfalls?
- Is there a deadline driving the sale (1031 exchange, divorce, estate, relocation)? That informs how much negotiation room exists.
- Schools are A-rated — typically a magnet for longer-tenancy family renters. What's the average tenant stay here, and is there a school-zone premium baked into asking?
- What's the average days-on-market for RENTAL listings here right now (not sales)? A rising rental-DOM trend means longer vacancies and softer asking-rent achievability than the comps imply.
- What's the recent tenant-quality profile in this submarket — average credit score on applications, eviction rate, late-payment / NSF rate, and stable-employment percentage? A property-management company in the area should have these aggregated.
- How much new for-sale + rental construction is in the pipeline within 1–3 miles? Heavy new supply typically softens prices + rents 12–24 months out; constrained supply supports both.
Investment metrics
- 1% rule
- 1.87% ✓
- Cap rate
- 9.60%
- Cash-on-cash
- 11.80%
- DSCR
- 1.53
- GRM
- 4.5
CMA / ARV
No comps found within radius.
Projected returns pro-forma
-3.0% appreciation · 3.0% rent growth · sell at horizon
- IRR
- 1.6%
- Equity multiple
- 1.06×
- Total profit
- $1,721
- Equity at exit
- $15,283
- IRR
- 11.4%
- Equity multiple
- 1.91×
- Total profit
- $26,077
- Equity at exit
- $8,862
Cash invested: $28,700 (down + closing). Projections, not guarantees.
Landlord ↔ Tenant lean methodology
- Overall (STATE)
- 27 Tenant-Leaning
- State Connecticut
- 27 Tenant-Leaning · D+7
- County
- — inherits STATE
- City
- — inherits STATE
ZIP-level market 06268
- Home prices YoY
- -16.5%
- Active inventory
- 37
- Price-to-rent
- 4.5×
Monthly cashflow live
- Estimated rent
- $1,918 high interval (Pro) →
- Mortgage (P&I)
- −$538
- Tax from tax record
- −$102 /mo · $1,220/yr
- Insurance
- −$43
- HOA
- −$551
- Vacancy / Maint / Mgmt
- −$403
- Net cashflow
- $282
Break-even live
Sensitivity live
| Price | -10% $340 | -5% $311 | +0% $282 | +5% $253 | +10% $224 |
|---|---|---|---|---|---|
| Rent | -10% $131 | -5% $207 | +0% $282 | +5% $358 | +10% $434 |
| Rate | -1.0pp $334 | -0.5pp $308 | base $282 | +0.5pp $256 | +1.0pp $229 |
UW: 25.0% down · 7.5% · 30yr · 1.5% tax · 5.0% vac · 8.0% maint · 8.0% mgmt
Financing live
Cash to close
- Down payment
- $25,625
- Closing costs
- $3,075
- Reserves months
- —
- Total cash needed
- —
Loan-product check · same deal, 3 products live
Conventional
25% down · 7.5% · 30yr
- Down + closing
- —
- Monthly P&I
- —
- Monthly cashflow
- —
- DSCR
- —
- Eligible?
- —
Personal DTI + credit; lowest rate.
DSCR
20% down · 8.5% · 30yr
- Down + closing
- —
- Monthly P&I
- —
- Monthly cashflow
- —
- DSCR
- —
- Eligible?
- —
No personal income docs; deal must DSCR.
Hard money
10% down · 12.0% · 12mo
- Down + closing
- —
- Monthly P&I
- —
- Monthly cashflow
- —
- DSCR
- —
- Eligible?
- —
Short-term bridge; refi at stabilization.
Rent comps 6 comps
| Address | Beds | Baths | Sqft | Rent | $/sqft | DOM | Units | Dist |
|---|---|---|---|---|---|---|---|---|
| 20 Carriage House Dr Storrs, CT | 2.0 | 1.0 | 950 | $2,400 | $2.53 | 25d | 1 | 0.69mi |
| 74 Baxter Rd Storrs Mansfield, CT | 2.0 | 1.0 | 900 | $1,750 | $1.94 | 3d | 1 | 0.81mi |
| 74 Baxter Rd Storrs Mansfield, CT | 2.0 | 1.0 | 800 | $1,750 | $2.19 | 13d | 1 | 0.81mi |
| 20 Dartmouth Rd Storrs, CT | 1.0 | 1.0 | 576 | $1,550 | $2.69 | 3d | 1 | 0.88mi |
| 162 Cedar Swamp Rd Unit B Storrs, CT | 2.0 | 1.0 | 1050 | $1,950 | $1.86 | 3d | 1 | 0.90mi |
| 64 Cheney Dr Storrs, CT | 1.0 | 1.0 | 525 | $1,750 | $3.33 | 13d | 1 | 1.36mi |
HOA detail
- Monthly dues
- $551 · $6,612/yr
- Likely covers
- waterpool
Listing history 12 events
-
2026-06-13statusdays on market $102,500 Under Contract 10 DOM
-
2026-06-10days on market $102,500 Active 8 DOM
-
2026-06-09days on market $102,500 Active 7 DOM
-
2026-06-08days on market $102,500 Active 6 DOM
-
2026-06-07days on market $102,500 Active 5 DOM
-
2026-06-03statusdays on market $102,500 Active 1 DOM
-
2026-06-02days on market $102,500 Coming Soon 5 DOM
-
2026-06-01days on market $102,500 Coming Soon 4 DOM
-
2026-05-31days on market $102,500 Coming Soon 3 DOM
-
2026-05-31pricedays on market $102,500 Coming Soon 2 DOM
-
2026-05-28historical $65,000
-
2014-05-29soldstatus $46,000
ⓘ Source: listings_history table (triggers on properties + properties_extension) + one-shot
backfill from property_details.listing_events for pre-trigger history.
Tax reassessment forecast CT · Partial reset (capped growth)
- Current annual tax
- $1,220 · $102/mo
- Projected year-2 tax
- $1,707 · $142/mo
- Expected delta
- +$487/yr (+$41/mo · 39.9%)
ⓘ Screening estimate from a state-policy table — verify with the county assessor before closing.
Climate risk First Street
- Flood 1/10 Low FEMA zone X · 0% chance over 30 yrs
- Wildfire 3/10 Moderate
- Heat 4/10 Moderate 7 d/yr ≥94°F today · 16 d/yr by 30 yrs out
- Wind 6/10 Major 46% chance of damaging wind over 30 yrs
- Air quality 3/10 Moderate 3 unhealthy d/yr today · 4 by 30 yrs out
Nearby sold comps map
Loading sold comps map…
Walkable amenities ~0.75 mi
Loading nearby amenities…
Taxation est. · year 1
- Rental income
- $23,016
- − Mortgage interest
- −$5,742
- − Property taxes
- −$1,220
- − Insurance
- −$512
- − Repairs & maintenance
- −$1,841
- − Management
- −$1,841
- − HOA
- −$6,612
- − Depreciation
- −$2,982
- Taxable income
- $2,265
- Est. tax owed @ 24.0%
- −$544
- After-tax cash flow
- $2,844/yr
For passive investors: Depreciation is non-cash, so a rental often shows a tax loss while cash-flowing — sheltering income. Rental losses are passive: they offset passive income freely, and up to $25,000/yr can offset ordinary (W-2) income if you actively participate and your MAGI is under $100k (phasing out to $0 by $150k); unused losses carry forward. On sale, claimed depreciation is recaptured at up to 25%, and gains may owe capital-gains tax (a 1031 exchange can defer both). Figures are a year-1 estimate at your 24.0% rate — not tax advice; consult a CPA.
Schools (NCES district)
- District
- Mansfield School District
- NCES district ID
- 0902340
- Math proficiency
- 59% ▼ -12.00%
- Reading proficiency
- 70% ▼ -6.00%
- Median HH income
- $60,954
- Composite
- 55.81/100
- National rank
- #1209
- State rank
- #36 of 153 in CT
Livability — Storrs
- Score
- 82/100
- State rank
- #8
- US rank
- #1066
Category grades
Schools grade is shown separately in the Schools card above.
Census & demographics
- Census place
- Storrs, CT
- City population
- 17,505
- Population (ZIP)
- 10,782
Population outlook (Capitol County) Hauer SSP2
- By 2040
- 1,063,519
Race, ethnicity, and origin ACS 2023
- Neighborhood character
- Predominantly White (75%)
- Race & ethnicity
- White 75% Asian 12% Hispanic / Latino 6% Black 5% Two or more races 4%
- Hispanic origin (detail)
- Mexican 1% Puerto Rican 2%
- Common ancestry
- Lithuanian 6% Romanian 5% Slovak 3%
- Foreign-born
- 14% · China, Canada, Dominican Republic
- Languages at home
- 82% English-only · Chinese 6% Other Indo-European 4% Spanish 2%
Political lean MEDSL · Capitol
- 2024 margin
- Strong D (+21.9) · D 60.1% · R 38.2% · Other 1.7%
- All cycles
- 2024: D+21.9
Not yet ingested
- Civics
- —
Market trends
- HPI YoY
- ▼ -49.53%
- Current HPI
- 251.3467
- Rent YoY
- —
- Metro
- —
- State GDP YoY
- ▲ 1.06%
- F500 in state
- 38
Industry mix (Fortune 500 HQ in CT)
| Industry | F500 HQs | Revenue |
|---|---|---|
| Industrial Machinery | 4 | $38B |
|
||
| Insurance | 3 | $71B |
|
||
| Financial Services | 2 | $25B |
|
||
| Transportation / Logistics | 2 | $18B |
|
||
| Healthcare | 1 | $247B |
|
||
| Telecommunications | 1 | $55B |
|
||
Price history
+41.3% since first listed2 events — show timeline
- 2026-05-28 Coming Soon $65,000 Smart MLS
- 2014-05-29 Sold (Public Records) $46,000 Public Records
Property tax history
+3.0%/yrLatest (2023): $1,220 · +3.7% YoY. Source: county tax records.
Cash-flow waterfall
monthlySold comps — $/sqft
last 12 mo · ≤1 miLoading sold comps…