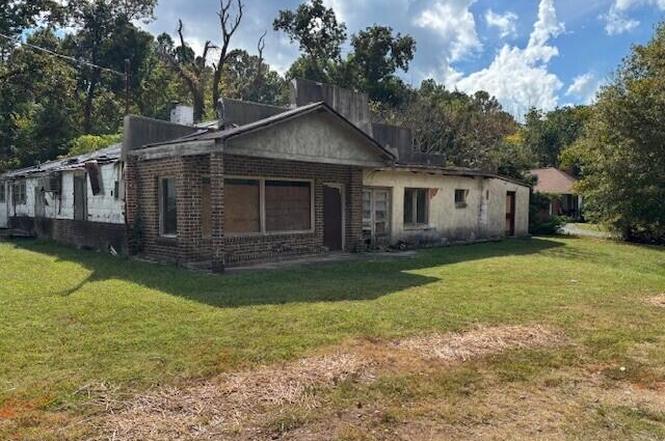
5002 Wake Forest Hwy · Durham, NC
Flood risk 1/10 · Minimal
- FEMA flood zone
- X (unshaded)
- Chance of flooding over 30 yrs
- 0.0%
- Est. flood insurance / yr
- $507 – $1,088
Fire risk 3/10 · Minor
- Est. fire insurance / yr
- $906 – $1,684
Heat risk 6/10 · Moderate
- Hot days now (above 105°F)
- 7 days/yr
- Hot days in 30 yrs
- 17 days/yr
Wind risk 6/10 · Moderate
- Chance of severe wind over 30 yrs
- 27.0%
Air-quality risk 2/10 · Minimal
- Unhealthy air days now
- 1 days/yr
- Unhealthy air days in 30 yrs
- 1 days/yr
Risk factors via First Street. Map © Google.
Why this score? — see what drove the B- grade
The composite is a weighted blend of 9 inputs, each scored 0–100. Each bar is that input's sub-score; the figure is the points it added to the 100-point composite (weight × sub-score).
- Cash flow +30.0/30.0
- 1% rule +10.0/10.0
- DSCR +10.0/10.0
- ARV discount +7.5/15.0
- Livability +4.0/5.0
- Schools +3.0/10.0
- Rent growth +2.7/5.0
- Condition / age +2.5/5.0
- Appreciation +0.0/10.0
$98,500
🖨 Deal sheet (PDF) 📄 Offer letter ✓ Due diligence
Listing remarks
Property currently under 13 th10 day upset bid period, Current price is $197,993 . new bid is $207,893 last day to upset bid is April 16, 2026. Commissioner's sale, public upset bid period, sold '' as is & where is'' & subject to attached Judicial Addendum Property has not been occupied for several years. Enter dwelling at your OWEN risk, side door unlocked. Property is not in the city limits & NOT connected to public water or sewer. Per City engineering public water & sewer is in street, please confirm for your records. File # 25-SP-000193
Key facts
- 0.43 acre lot
- Built 1940
- Listed 181 days
Property features AI
Finance
- Other: Lot approximately 0.43 acres (dimensions: 100 x 176 x 120 x 176); Zoned residential; Road is publicly maintained and paved; Frontage: see remarks; Living area reported as 3,136
- Financial info: Annual tax amount listed
- HOA & community: No association; No community features listed; Not a senior community
Exterior
- Parking: No designated parking listed
- Security: No security features listed
- Utilities: Well water; Septic sewer
- Home design: House, single-story; Property faces north
- Construction: Construction materials: unknown; No roof information listed; No foundation details listed; No other structures on the property
- Exterior features: No exterior features listed; No patio or porch listed; No fencing listed; No pool
Interior
- Kitchen: No appliances listed
- Bedrooms: 3 bedrooms total; 1 bedroom on the main level
- Flooring: No flooring information listed
- Bathrooms: 2 full bathrooms
- Heating & cooling: Heating: see remarks; No central cooling
- Interior features: See remarks for additional interior details
- Laundry & utility: No laundry features listed
Neighborhood map
What this means for you Summary
Snapshot
- This is a 3-bed/2.0-bath single-family listed at $98k.
Deal economics
- At list price, monthly cash flow is $1k ($17k/yr) — positive.
- The deal already cash-flows at list — no discount required.
- Meets the 1% rule at list price ($3k rent vs $98k).
- Recommended offer: $87k (12.0% below list) — sets the bar for market timing.
- Cap rate 23.2% vs local median 3.0% in Durham — top-decile yield for the area; either an underpriced asset or a hidden risk that comps aren't pricing in. Stress-test before assuming the spread holds.
Location & tenants
- Location reads 81/100 on livability (#15 in NC, #1,411 nationally) — a professional / high-income tenant draw. Strengths: amenities A+, commute A+, housing A+; Watch: crime F.
- Durham Public Schools (urban): math 29% / reading 39% proficiency, ranked #132 of 178 in NC (top 74%) — families likely to look elsewhere, expect single-tenant / working-renter base with shorter leases.
- Zoned schools: Holt Elementary (math 10% / reading 26%, grade F, #1,280 of 1,410 statewide, top 91%, 636 students, 83% FRL); Neal Middle (math 6% / reading 19%, grade F, #468 of 475 statewide, top 99%, 789 students, 100% FRL); Southern School of Energy And Sustainabi (math 28% / reading 30%, grade F, #465 of 535 statewide, top 87%, 1,283 students, 100% FRL) — zoned schools average 94% FRL vs 58% district-wide (36 pts higher); higher-poverty schools than district average — tighter screening recommended.
- Zoned-school proficiency averages 20% at this address vs 34% district-wide (-14 pts) — the specific schools serving this property underperform the Durham Public Schools average; the district grade overstates school quality for this exact location.
- Market conditions: Rents flat; 1103 active listings in the ZIP; 5 comparable units currently listed for rent nearby; rentals at typical pace (median 15d on market — plan ~3-4 weeks tenant-placement turnaround); solid renter incomes; 2,905 units permitted in Durham County in 2024 (955 in 5+ unit buildings).
Forward outlook
- Local home prices are declining (-3.0%/yr); year-one equity from $681 of loan paydown is wiped out by about $3k of value loss. Plan a longer hold.
- Durham County population projected at +44% by 2050 — long-run rental-demand tailwind backs the buy-and-hold thesis.
- At projected returns (-3.0% appreciation + 0.8% rent growth), your $28k cash investment doubles in ~2 years — after that, you're playing with house money.
Negotiation context
- It's been on market 181 days — a 12% lower offer ($87k) is reasonable based on typical stale-listing flexibility.
- Current owner paid $65k; list at $98k implies a 52% gain — meaningful room to come down on a strong offer.
Risks & watch-outs
- Watch-outs: built in 1940 — expect roof / HVAC / electrical / plumbing capex.
- Climate carrying-cost: major wind risk, 27% chance of damaging wind over 30y; extreme-heat days projected 7→17/yr by 2055 (HVAC capex compounding) — expect insurance premiums to compound above CPI over the hold.
Questions for the listing agent
- It's been on market 181 days. Have you received any prior offers? Is the seller open to a 12% concession, seller financing, or rate buy-down credit?
- Built in 1940 — when were the roof, HVAC, electrical panel, plumbing, and water heater last replaced?
- Why hasn't it sold? Are there any deal-killer items the seller is aware of (foundation, flood, title, zoning, code violations)?
- Is there a deadline driving the sale (1031 exchange, divorce, estate, relocation)? That informs how much negotiation room exists.
- Schools are D-rated, which usually means shorter tenancies and higher turnover. Who's the typical renter profile here, and what's been the actual vacancy rate?
- Crime grade is F in this area — have there been break-ins, vandalism, or insurance claims at this property in the last 3 years? What carrier currently insures it and at what premium?
- What's the average days-on-market for RENTAL listings here right now (not sales)? A rising rental-DOM trend means longer vacancies and softer asking-rent achievability than the comps imply.
- What's the recent tenant-quality profile in this submarket — average credit score on applications, eviction rate, late-payment / NSF rate, and stable-employment percentage? A property-management company in the area should have these aggregated.
- How much new for-sale + rental construction is in the pipeline within 1–3 miles? Heavy new supply typically softens prices + rents 12–24 months out; constrained supply supports both.
Investment metrics
- 1% rule
- 2.57% ✓
- Cap rate
- 23.22%
- Cash-on-cash
- 60.44%
- DSCR
- 3.69
- GRM
- 3.2
CMA / ARV
- ARV (on-the-fly)
- $498,624
- Comps found
- 12
Show comp detail 12 sales within ~0.75 mi
| Address | Dist | Beds/Ba | Sqft | Sold | Price | $/sf | Match |
|---|---|---|---|---|---|---|---|
| 312 Stallings Rd | 0.35mi | 3/2.0 | 3,265 (+4%) | 1mo | $700,000 | $214 | 76 |
| 1 Thorn Brook Ct | 0.56mi | 4/3.5 (+1) | 3,166 (+1%) | 5mo | $423,000 | $134 | 57 |
| 2 Red Sage Ct | 0.58mi | 4/3.0 (+1) | 3,092 (-1%) | 6mo | $435,000 | $141 | 57 |
| 617 Hiddenbrook Dr | 0.56mi | 4/2.5 (+1) | 3,036 (-3%) | 6mo | $484,000 | $159 | 56 |
| 204 Hillview Dr | 0.51mi | 4/2.5 (+1) | 2,968 (-5%) | 6mo | $430,500 | $145 | 56 |
| 621 Wellwater Ave | 0.73mi | 4/2.5 (+1) | 3,009 (-4%) | 3mo | $480,000 | $160 | 50 |
| 714 Weathervane Dr | 0.65mi | 4/2.5 (+1) | 2,932 (-6%) | 4mo | $460,000 | $157 | 48 |
| 634 Conover Rd | 0.72mi | 4/2.5 (+1) | 2,906 (-7%) | 2mo | $446,000 | $153 | 46 |
| 124 Green Gables Way | 0.62mi | 4/2.5 (+1) | 2,889 (-8%) | 7mo | $515,000 | $178 | 45 |
| 629 Conover Rd | 0.69mi | 4/3.5 (+1) | 2,886 (-8%) | 5mo | $627,700 | $217 | 39 |
| 633 Conover Rd | 0.72mi | 4/3.5 (+1) | 2,886 (-8%) | 4mo | $625,000 | $217 | 39 |
| 631 Ashburn Ln | 0.70mi | 4/2.5 (+1) | 3,563 (+14%) | 2mo | $495,000 | $139 | 36 |
Match score weights: distance 35% · size 25% · config 20% · recency 20%. Top-matched comps best support the ARV.
Projected returns pro-forma
-3.0% appreciation · 0.84% rent growth · sell at horizon
- IRR
- 56.8%
- Equity multiple
- 3.43×
- Total profit
- $67,128
- Equity at exit
- $14,687
- IRR
- 61.0%
- Equity multiple
- 6.48×
- Total profit
- $151,201
- Equity at exit
- $8,516
Cash invested: $27,580 (down + closing). Projections, not guarantees.
Landlord ↔ Tenant lean methodology
- Overall (STATE)
- 85 Strongly Landlord-Friendly
- State North Carolina
- 85 Strongly Landlord-Friendly · R+3
- County
- — inherits STATE
- City
- — inherits STATE
ZIP-level market 27703
- Rents YoY
- 0.8%
- Active inventory
- 1103
- Price-to-rent
- 3.2×
Monthly cashflow live
- Estimated rent
- $2,532 high interval (Pro) →
- Mortgage (P&I)
- −$517
- Tax from tax record
- −$53 /mo · $640/yr
- Insurance
- −$41
- HOA
- −$0
- Vacancy / Maint / Mgmt
- −$532
- Net cashflow
- $1,389
Break-even live
Sensitivity live
| Price | -10% $1,445 | -5% $1,417 | +0% $1,389 | +5% $1,361 | +10% $1,333 |
|---|---|---|---|---|---|
| Rent | -10% $1,189 | -5% $1,289 | +0% $1,389 | +5% $1,489 | +10% $1,589 |
| Rate | -1.0pp $1,439 | -0.5pp $1,414 | base $1,389 | +0.5pp $1,364 | +1.0pp $1,338 |
UW: 25.0% down · 7.5% · 30yr · 1.5% tax · 5.0% vac · 8.0% maint · 8.0% mgmt
Financing live
Cash to close
- Down payment
- $24,625
- Closing costs
- $2,955
- Reserves months
- —
- Total cash needed
- —
Loan-product check · same deal, 3 products live
Conventional
25% down · 7.5% · 30yr
- Down + closing
- —
- Monthly P&I
- —
- Monthly cashflow
- —
- DSCR
- —
- Eligible?
- —
Personal DTI + credit; lowest rate.
DSCR
20% down · 8.5% · 30yr
- Down + closing
- —
- Monthly P&I
- —
- Monthly cashflow
- —
- DSCR
- —
- Eligible?
- —
No personal income docs; deal must DSCR.
Hard money
10% down · 12.0% · 12mo
- Down + closing
- —
- Monthly P&I
- —
- Monthly cashflow
- —
- DSCR
- —
- Eligible?
- —
Short-term bridge; refi at stabilization.
Rent comps 5 comps
| Address | Beds | Baths | Sqft | Rent | $/sqft | DOM | Units | Dist |
|---|---|---|---|---|---|---|---|---|
| 634 Conover Rd Durham, NC | 4.0 | 2.5 | 2906 | $2,680 | $0.92 | 15d | 1 | 0.72mi |
| 3 Mooring Ct Durham, NC | 4.0 | 2.5 | 3144 | $2,495 | $0.79 | 25d | 1 | 0.81mi |
| 616 Poplar St Durham, NC | 4.0 | 3.0 | 2720 | $2,395 | $0.88 | 15d | 1 | 0.95mi |
| 1011 Poplar St Durham, NC | 4.0 | 3.0 | 2718 | $3,000 | $1.10 | 25d | 1 | 1.33mi |
| 1015 Night Star Trl Durham, NC | 3.0 | 2.5 | 2390 | $2,624 | $1.10 | 4d | 14 | 1.37mi |
Listing history 4 events
-
2026-05-18status Pending
-
2026-04-19historical Active Under Contract
-
2025-11-18$98,500 Active
-
1993-10-13soldstatus $65,000
ⓘ Source: listings_history table (triggers on properties + properties_extension) + one-shot
backfill from property_details.listing_events for pre-trigger history.
Tax reassessment forecast NC · Resets to sale price
- Current annual tax
- $640 · $53/mo
- Projected year-2 tax
- $808 · $67/mo
- Expected delta
- +$167/yr (+$14/mo · 26.2%)
ⓘ Screening estimate from a state-policy table — verify with the county assessor before closing.
Climate risk First Street
- Flood 1/10 Low FEMA zone X (unshaded) · 0% chance over 30 yrs
- Wildfire 3/10 Moderate
- Heat 6/10 Major 7 d/yr ≥105°F today · 17 d/yr by 30 yrs out
- Wind 6/10 Major 27% chance of damaging wind over 30 yrs
- Air quality 2/10 Low 1 unhealthy d/yr today · 1 by 30 yrs out
Nearby sold comps map
Loading sold comps map…
Walkable amenities ~0.75 mi
Loading nearby amenities…
Taxation est. · year 1
- Rental income
- $30,382
- − Mortgage interest
- −$5,518
- − Property taxes
- −$640
- − Insurance
- −$492
- − Repairs & maintenance
- −$2,431
- − Management
- −$2,431
- − Depreciation
- −$2,865
- Taxable income
- $16,005
- Est. tax owed @ 24.0%
- −$3,841
- After-tax cash flow
- $12,829/yr
For passive investors: Depreciation is non-cash, so a rental often shows a tax loss while cash-flowing — sheltering income. Rental losses are passive: they offset passive income freely, and up to $25,000/yr can offset ordinary (W-2) income if you actively participate and your MAGI is under $100k (phasing out to $0 by $150k); unused losses carry forward. On sale, claimed depreciation is recaptured at up to 25%, and gains may owe capital-gains tax (a 1031 exchange can defer both). Figures are a year-1 estimate at your 24.0% rate — not tax advice; consult a CPA.
Schools (NCES district)
- District
- Durham Public Schools
- NCES district ID
- 3701260
- Math proficiency
- 29% ▼ -3.00%
- Reading proficiency
- 39% ▲ 2.00%
- Median HH income
- $52,143
- Composite
- 29.69/100
- National rank
- #6457
- State rank
- #132 of 178 in NC
Livability — Durham
- Score
- 81/100
- State rank
- #15
- US rank
- #1411
Category grades
Schools grade is shown separately in the Schools card above.
Census & demographics
- County
- Durham County · 288,747 people
- City population
- 288,747
- Metro
- Durham-Chapel Hill, NC
- Population (ZIP)
- 63,458
- Household income
- $89,317
- Rent vs Own
- Severe rent burden
- 1685.0
Population outlook (Durham County) Hauer SSP2
- Today (2025)
- 368,962 people
- By 2030
- 402,686 · +9.1%
- By 2040
- 468,677 · +27.0%
- By 2050
- 531,727 · +44.1%
- By 2075
- 660,446 · +79.0%
- By 2100
- 739,971 · +100.6%
Race, ethnicity, and origin ACS 2023
- Neighborhood character
- Diverse neighborhood (Simpson 0.70)
- Race & ethnicity
- Black 40% White 32% Hispanic / Latino 20% Two or more races 9% Asian 5%
- Hispanic origin (detail)
- Mexican 11% Puerto Rican 1%
- Common ancestry
- Swiss 2% Romanian 2% Italian 1%
- Foreign-born
- 15% · Canada, Vietnam, China
- Languages at home
- 77% English-only · Spanish 17% Other Asian/Pacific 1% Other Indo-European 1%
Political lean MEDSL · Durham
- 2024 margin
- Solid D (+61.9) · D 80.2% · R 18.2% · Other 1.6%
- 2008→2024 swing
- +10.0pp toward D · 2008: 51.9pp · 2024: 61.9pp
- All cycles
- 2024: D+61.9 2020: D+62.4 2016: D+60.4 2012: D+52.7 2008: D+51.9
Not yet ingested
- Civics
- —
Market trends
- HPI YoY
- ▼ -129.81%
- Current HPI
- 206.7413
- Rent YoY
- ▲ 0.84%
- Metro
- Durham-Chapel Hill, NC
- State GDP YoY
- ▲ 3.28%
- F500 in state
- 26
Industry mix (Fortune 500 HQ in NC)
| Industry | F500 HQs | Revenue |
|---|---|---|
| Financial Services | 2 | $213B |
|
||
| Retail | 2 | $95B |
|
||
| Industrial Conglomerate | 1 | $38B |
|
||
| Metals / Steel | 1 | $35B |
|
||
| Utilities | 1 | $30B |
|
||
| Industrial Machinery | 1 | $19B |
|
||
Price history
+51.5% since first listed4 events — show timeline
- 2026-05-18 Pending — TMLS
- 2026-04-19 Contingent — TMLS
- 2025-11-18 Listed $98,500 TMLS
- 1993-10-13 Sold (Public Records) $65,000 Public Records
Property tax history
+2.5%/yrLatest (2025): $640 · +30.1% YoY. Source: county tax records.
Cash-flow waterfall
monthlySold comps — $/sqft
last 12 mo · ≤1 miLoading sold comps…