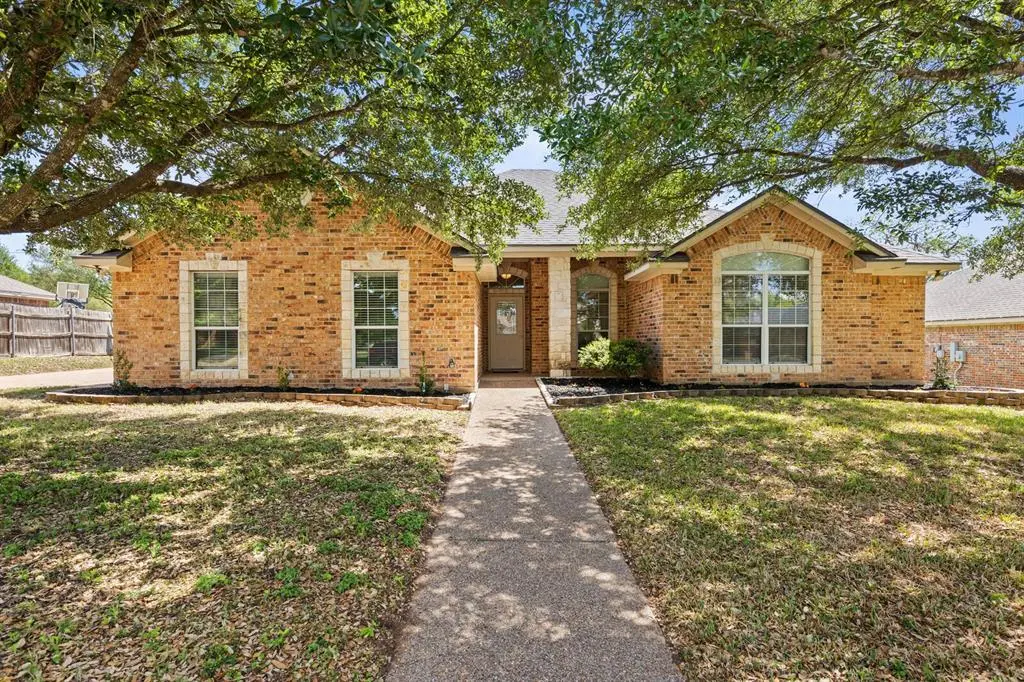
713 Ver-lo Dr · Lorena, TX
Flood risk 1/10 · Minimal
- FEMA flood zone
- X (unshaded)
- Chance of flooding over 30 yrs
- 0.0%
- Est. flood insurance / yr
- $507 – $1,088
Fire risk 4/10 · Minor
- Est. fire insurance / yr
- $1,222 – $2,270
Heat risk 8/10 · Major
- Hot days now (above 108°F)
- 7 days/yr
- Hot days in 30 yrs
- 25 days/yr
Wind risk 8/10 · Major
- Chance of severe wind over 30 yrs
- 80.0%
Air-quality risk 1/10 · Minimal
- Unhealthy air days now
- 0 days/yr
- Unhealthy air days in 30 yrs
- 0 days/yr
Risk factors via First Street. Map © Google.
Why this score? — see what drove the D- grade
The composite is a weighted blend of 9 inputs, each scored 0–100. Each bar is that input's sub-score; the figure is the points it added to the 100-point composite (weight × sub-score).
- Cash flow +11.4/30.0
- Schools +5.4/10.0
- ARV discount +4.8/15.0
- 1% rule +3.7/10.0
- Livability +3.6/5.0
- DSCR +3.3/10.0
- Rent growth +2.5/5.0
- Condition / age +2.5/5.0
- Appreciation +0.0/10.0
$319,900
🖨 Deal sheet 📄 Offer letter ✓ Due diligence
Listing remarks
Looking for the perfect place to call home? This beautiful property in Lorena checks all the boxes. 4 bedrooms , 2 bathrooms. 1743 Square feet. Enjoy comfortable living with plenty of space for family, guests, or a home office. Nestled in a great location with that small-town feel, yet convenient to everything you need. Do not miss your chance to make this house your home.
Key facts
- 0.24 acre lot
- 2 garage spots
- Built 2006
Property features AI
Finance
- Other: Subdivision: South Meadow Estates, Pt Fou; County: McLennan; Directions: 713 Ver-Lo Dr, Lorena, TX 76655
- Financial info: No second mortgage; Loan type: Treat As Clear
- HOA & community: No homeowners association
Exterior
- Parking: Attached garage; 2 covered garage spaces
- Security: Security details not provided
- Utilities: City water; City sewer; Curbs; Not in a municipal utility district
- Home design: Single-family residence; One story; Residential property
- Construction: Brick construction; Built in 2006
- Exterior features: Wood fencing; Less than 0.5 acre lot (approx. 0.242 acres)
Interior
- Kitchen: Dishwasher; Disposal; Electric cooktop; Microwave; Refrigerator
- Bedrooms: 4 bedrooms; Primary bedroom on level 1 (approx. 15 x 12)
- Flooring: Flooring details not provided
- Bathrooms: 2 full bathrooms
- Heating & cooling: Central air
- Interior features: Walk-in closets; One living area; One dining area; 1,743 living area
- Laundry & utility: Laundry/utility details not provided
Neighborhood map
What this means for you Summary
Snapshot
- This is a 4-bed/2.0-bath single-family listed at $320k.
Deal economics
- At list price, monthly cash flow is $-110 ($-1k/yr) — negative.
- To cash-flow at today's rent, offer at most $301k (6.0% below list).
- To meet the 1% rule (rent ≥ 1% of price), the offer needs to be $280k (12.5% below list).
- Recommended offer: $280k (12.5% below list) — sets the bar for 1% rule.
- Cap rate 5.9% vs local median 2.9% in Lorena — top-decile yield for the area; either an underpriced asset or a hidden risk that comps aren't pricing in. Stress-test before assuming the spread holds.
Location & tenants
- Location reads 71/100 on livability (#325 in TX) — a middle-class / working-renter tenant base. Strengths: employment A+, cost of living A+, housing A+; Watch: amenities F, commute F, health & safety F.
- Lorena ISD (rural): math 57% / reading 63% proficiency, ranked #46 of 826 in TX (top 6%) — acceptable for families but not a draw, mixed tenant base, ~2y average lease; only 16% free/reduced lunch — higher-income household profile.
- Zoned schools: Lorena El (math 60% / reading 60%, grade B-, #398 of 4,322 statewide, top 9%, 415 students, 31% FRL) — zoned schools average 31% FRL vs 16% district-wide (15 pts higher); higher-poverty schools than district average — tighter screening recommended.
- Market conditions: 265 active listings in the ZIP; 2 comparable units currently listed for rent nearby; solid renter incomes; 1,014 units permitted in McLennan County in 2024 (200 in 5+ unit buildings).
- This rent runs 34% of the median local income ($100k/yr) — at the standard rent-burdened threshold; future hikes will face affordability resistance.
Forward outlook
- Local home prices are declining (-3.0%/yr); year-one equity from $2k of loan paydown is wiped out by about $10k of value loss. Plan a longer hold.
- McLennan County population projected at +17% by 2050 — long-run rental-demand tailwind backs the buy-and-hold thesis.
Negotiation context
- Only 11 days on market — expect competitive offers; lowballing is unlikely to land.
Risks & watch-outs
- Climate carrying-cost: severe wind risk, 80% chance of damaging wind over 30y; extreme-heat days projected 7→25/yr by 2055 (HVAC capex compounding) — expect insurance premiums to compound above CPI over the hold.
Questions for the listing agent
- What do current leases actually rent for vs. the listed asking? Can we see a recent rent roll and the last 12 months of T-12 income?
- Is there a deadline driving the sale (1031 exchange, divorce, estate, relocation)? That informs how much negotiation room exists.
- Schools are B-rated — typically a magnet for longer-tenancy family renters. What's the average tenant stay here, and is there a school-zone premium baked into asking?
- The area grade is low — what's the realistic commute time and amenity access for the typical tenant pool here? Any planned neighborhood developments (good or bad) we should know about?
- What's the average days-on-market for RENTAL listings here right now (not sales)? A rising rental-DOM trend means longer vacancies and softer asking-rent achievability than the comps imply.
- What's the recent tenant-quality profile in this submarket — average credit score on applications, eviction rate, late-payment / NSF rate, and stable-employment percentage? A property-management company in the area should have these aggregated.
- How much new for-sale + rental construction is in the pipeline within 1–3 miles? Heavy new supply typically softens prices + rents 12–24 months out; constrained supply supports both.
Investment metrics
- 1% rule
- 0.87% ✗
- Cap rate
- 5.88%
- Cash-on-cash
- -1.47%
- DSCR
- 0.93
- GRM
- 9.5
CMA / ARV
- ARV (on-the-fly)
- $301,539
- Comps found
- 12
Show comp detail 12 sales within ~0.75 mi
| Address | Dist | Beds/Ba | Sqft | Sold | Price | $/sf | Match |
|---|---|---|---|---|---|---|---|
| 814 Springdale Cir | 0.13mi | 4/2.0 | 1,817 (+4%) | 0mo | $360,000 | $198 | 87 |
| 103 York Dr | 0.25mi | 3/2.0 (-1) | 1,543 (-12%) | 1mo | $279,500 | $181 | 63 |
| 128 Thompson Cir | 0.31mi | 3/3.0 (-1) | 1,819 (+4%) | 9mo | $315,000 | $173 | 62 |
| 805 Evelyn Dr | 0.52mi | 3/2.0 (-1) | 1,887 (+8%) | 1mo | $349,900 | $185 | 56 |
| 207 Lee Ln | 0.55mi | 4/2.0 | 1,726 (-1%) | 21mo | $174,900 | $101 | 55 |
| 111 Thompson Cir | 0.29mi | 3/2.0 (-1) | 1,930 (+11%) | 11mo | $265,000 | $137 | 54 |
| 607 Old Rosenthal Rd | 0.59mi | 3/2.0 (-1) | 1,676 (-4%) | 10mo | $165,000 | $98 | 53 |
| 401 Lee Ln | 0.67mi | 3/2.0 (-1) | 1,748 (+0%) | 12mo | $315,000 | $180 | 53 |
| 202 Thompson Cir | 0.24mi | 3/2.0 (-1) | 1,985 (+14%) | 14mo | $310,000 | $156 | 49 |
| 800 Evelyn Dr | 0.48mi | 4/2.0 | 2,004 (+15%) | 9mo | $329,900 | $165 | 45 |
| 111 York Dr | 0.23mi | 3/2.0 (-1) | 1,497 (-14%) | 23mo | $300,000 | $200 | 42 |
| 101 N Oak St | 0.54mi | 3/2.0 (-1) | 1,604 (-8%) | 22mo | $179,900 | $112 | 38 |
Match score weights: distance 35% · size 25% · config 20% · recency 20%. Top-matched comps best support the ARV.
Projected returns pro-forma
-3.0% appreciation · 3.0% rent growth · sell at horizon
- IRR
- -18.7%
- Equity multiple
- 0.34×
- Total profit
- $-58,702
- Equity at exit
- $47,698
- IRR
- -11.0%
- Equity multiple
- 0.33×
- Total profit
- $-59,652
- Equity at exit
- $27,659
Cash invested: $89,572 (down + closing). Projections, not guarantees.
Landlord ↔ Tenant lean methodology
- Overall (STATE)
- 87 Strongly Landlord-Friendly
- State Texas
- 87 Strongly Landlord-Friendly · R+5
- County
- — inherits STATE
- City
- — inherits STATE
ZIP-level market 76655
- Home prices YoY
- -31.3%
- Active inventory
- 265
- Price-to-rent
- 9.5×
Monthly cashflow live
- Estimated rent
- $2,799 medium interval (Pro) →
- Mortgage (P&I)
- −$1,678
- Tax from tax record
- −$510 /mo · $6,115/yr
- Insurance
- −$133
- HOA
- −$0
- Vacancy / Maint / Mgmt
- −$588
- Net cashflow
- $-110
Break-even live
UW: 25.0% down · 7.5% · 30yr · 1.5% tax · 5.0% vac · 8.0% maint · 8.0% mgmt
Financing live
Cash to close
- Down payment
- $79,975
- Closing costs
- $9,597
- Reserves months
- —
- Total cash needed
- —
Loan-product check · same deal, 3 products live
Conventional
25% down · 7.5% · 30yr
- Down + closing
- —
- Monthly P&I
- —
- Monthly cashflow
- —
- DSCR
- —
- Eligible?
- —
Personal DTI + credit; lowest rate.
DSCR
20% down · 8.5% · 30yr
- Down + closing
- —
- Monthly P&I
- —
- Monthly cashflow
- —
- DSCR
- —
- Eligible?
- —
No personal income docs; deal must DSCR.
Hard money
10% down · 12.0% · 12mo
- Down + closing
- —
- Monthly P&I
- —
- Monthly cashflow
- —
- DSCR
- —
- Eligible?
- —
Short-term bridge; refi at stabilization.
Rent comps 2 comps
| Address | Beds | Baths | Sqft | Rent | $/sqft | DOM | Units | Dist |
|---|---|---|---|---|---|---|---|---|
| 207 Joel Hooper Dr Lorena, TX | 3.0 | 2.0 | 1256 | $1,950 | $1.55 | 13d | 1 | 0.70mi |
| 689 Birdie Ln Lorena, TX | 3.0 | 2.0 | 1710 | $2,250 | $1.32 | 13d | 1 | 0.93mi |
Listing history 3 events
-
2026-05-01status Pending
-
2026-04-19$319,900 Active
-
2005-09-22soldstatus
ⓘ Source: listings_history table (triggers on properties + properties_extension) + one-shot
backfill from property_details.listing_events for pre-trigger history.
Tax reassessment forecast TX · Resets to sale price
- Current annual tax
- $6,115 · $510/mo
- Projected year-2 tax
- $6,115 · $510/mo
- Expected delta
- $0/yr ($0/mo · 0.0%)
ⓘ Screening estimate from a state-policy table — verify with the county assessor before closing.
Climate risk First Street
- Flood 1/10 Low FEMA zone X (unshaded) · 0% chance over 30 yrs
- Wildfire 4/10 Moderate
- Heat 8/10 Severe 7 d/yr ≥108°F today · 25 d/yr by 30 yrs out
- Wind 8/10 Severe 80% chance of damaging wind over 30 yrs
- Air quality 1/10 Low 0 unhealthy d/yr today · 0 by 30 yrs out
Nearby sold comps map
Loading sold comps map…
Walkable amenities ~0.75 mi
Loading nearby amenities…
Taxation est. · year 1
- Rental income
- $33,585
- − Mortgage interest
- −$17,919
- − Property taxes
- −$6,115
- − Insurance
- −$1,600
- − Repairs & maintenance
- −$2,687
- − Management
- −$2,687
- − Depreciation
- −$9,306
- Taxable loss
- −$6,729
- Est. tax savings @ 24.0%
- +$1,615
- After-tax cash flow
- $301/yr
For passive investors: Depreciation is non-cash, so a rental often shows a tax loss while cash-flowing — sheltering income. Rental losses are passive: they offset passive income freely, and up to $25,000/yr can offset ordinary (W-2) income if you actively participate and your MAGI is under $100k (phasing out to $0 by $150k); unused losses carry forward. On sale, claimed depreciation is recaptured at up to 25%, and gains may owe capital-gains tax (a 1031 exchange can defer both). Figures are a year-1 estimate at your 24.0% rate — not tax advice; consult a CPA.
Schools (NCES district)
- District
- Lorena ISD
- NCES district ID
- 4828200
- Math proficiency
- 57% ▼ -3.00%
- Reading proficiency
- 63% ▲ 2.00%
- Median HH income
- $79,086
- Composite
- 53.84/100
- National rank
- #1412
- State rank
- #46 of 826 in TX
Livability — Lorena
- Score
- 71/100
- State rank
- #325
- US rank
- #7155
Category grades
Schools grade is shown separately in the Schools card above.
Census & demographics
- Census place
- Lorena, TX
- County
- McLennan County · 213,088 people
- City population
- 10,603
- Metro
- Waco, TX
- Population (ZIP)
- 10,603
- Household income
- $99,917
- Rent vs Own
- Severe rent burden
- 62.0
Population outlook (McLennan County) Hauer SSP2
- Today (2025)
- 264,191 people
- By 2030
- 273,578 · +3.6%
- By 2040
- 291,506 · +10.3%
- By 2050
- 308,044 · +16.6%
- By 2075
- 349,648 · +32.3%
- By 2100
- 364,779 · +38.1%
Race, ethnicity, and origin ACS 2023
- Neighborhood character
- Predominantly White (76%)
- Race & ethnicity
- White 76% Hispanic / Latino 17% Two or more races 12% Black 3%
- Hispanic origin (detail)
- Mexican 14%
- Common ancestry
- Lithuanian 3% Slovak 3% Serbian 2%
- Foreign-born
- 2% · Canada
- Languages at home
- 93% English-only · Spanish 5% Arabic 2%
Political lean MEDSL · McLennan
- 2024 margin
- Solid R (+30.9) · D 34.0% · R 64.9% · Other 1.0%
- 2008→2024 swing
- -7.0pp toward R · 2008: -23.9pp · 2024: -30.9pp
- All cycles
- 2024: R+30.9 2020: R+23.4 2016: R+27.1 2012: R+29.8 2008: R+23.9
Not yet ingested
- Civics
- —
Market trends
- HPI YoY
- ▼ -105.10%
- Current HPI
- 230.4333
- Rent YoY
- —
- Metro
- Waco, TX
- State GDP YoY
- ▲ 3.95%
- F500 in state
- 110
Industry mix (Fortune 500 HQ in TX)
| Industry | F500 HQs | Revenue |
|---|---|---|
| Energy | 16 | $1,198B |
|
||
| Technology | 5 | $198B |
|
||
| Engineering / Construction | 4 | $72B |
|
||
| Energy Services | 3 | $60B |
|
||
| Utilities | 3 | $41B |
|
||
| Healthcare | 2 | $330B |
|
||
Price history
3 events — show timeline
- 2026-05-01 Pending — NTREIS
- 2026-04-19 Listed $319,900 NTREIS
- 2005-09-22 Sold (Public Records) — Public Records
Property tax history
+2.1%/yrLatest (2025): $6,115 · +4.8% YoY. Source: county tax records.
Cash-flow waterfall
monthlySold comps — $/sqft
last 12 mo · ≤1 miLoading sold comps…