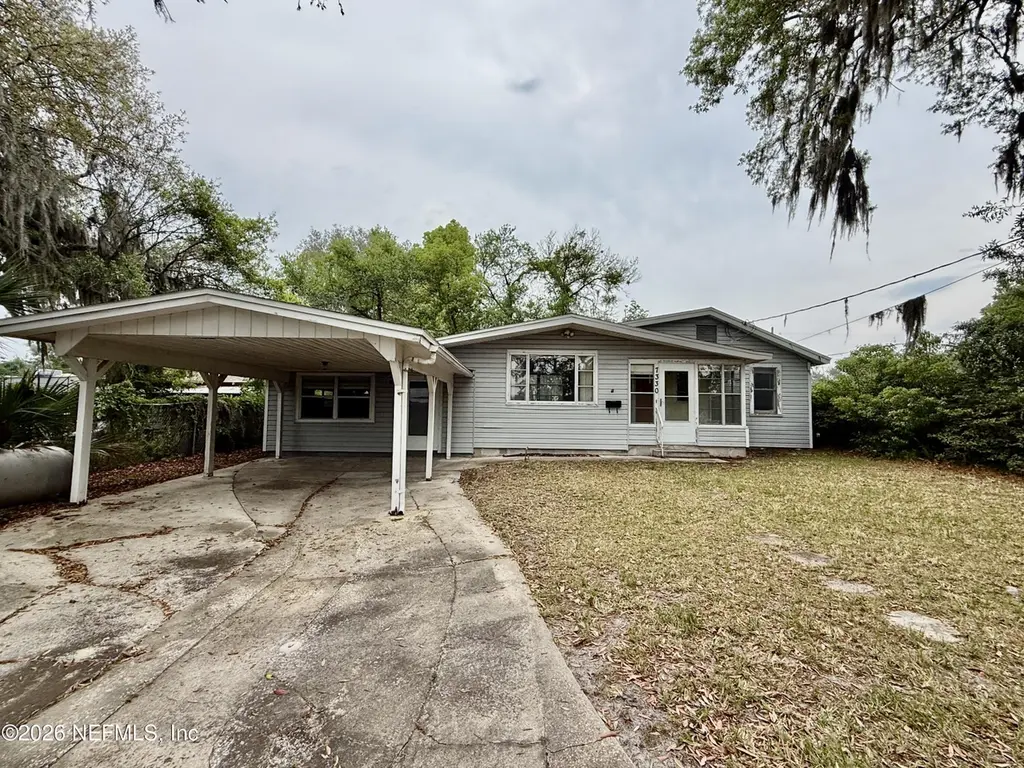
7330 Elwood Ave · Jacksonville, FL
Flood risk 3/10 · Minor
- FEMA flood zone
- X (unshaded)
- Chance of flooding over 30 yrs
- 0.07%
- Est. flood insurance / yr
- $507 – $1,088
Fire risk 2/10 · Minimal
- Est. fire insurance / yr
- $947 – $1,759
Heat risk 9/10 · Severe
- Hot days now (above 107°F)
- 6 days/yr
- Hot days in 30 yrs
- 17 days/yr
Wind risk 9/10 · Severe
- Chance of severe wind over 30 yrs
- 99.0%
Air-quality risk 4/10 · Minor
- Unhealthy air days now
- 6 days/yr
- Unhealthy air days in 30 yrs
- 6 days/yr
Risk factors via First Street. Map © Google.
Why this score? — see what drove the C+ grade
The composite is a weighted blend of 9 inputs, each scored 0–100. Each bar is that input's sub-score; the figure is the points it added to the 100-point composite (weight × sub-score).
- Cash flow +22.5/30.0
- ARV discount +15.0/15.0
- DSCR +7.2/10.0
- 1% rule +5.8/10.0
- Livability +4.2/5.0
- Schools +3.9/10.0
- Condition / age +2.5/5.0
- Rent growth +2.2/5.0
- Appreciation +0.0/10.0
$114,900
🖨 Deal sheet (PDF) 📄 Offer letter ✓ Due diligence
Listing remarks
NO INVESTORS FOR THE 1ST 30 DAYS until 6/6 Unlock the potential in this 2 bedroom, 2 bath with a flex room home that offers a large lot with water views off the Trout River from across the street & located in the heart of Jacksonville. 1 car carport attached. This diamond in the rough sits on a nice lot, offering endless possibilities for investors, renovators, or buyers looking to create their dream home. .Property is Sold in AS-IS condition. No repairs! With its generous footprint, this property can be easily reimagined to maximize both functionality & value. Step outside & you'll find an additional space perfect to create your dream for barbecuing & privacy-ideal
Key facts
- Water views
- Large lot
- Outdoor lounge
Tags
Property features AI
Finance
- HOA & community: Not a senior community
Exterior
- Parking: Attached carport
- Utilities: Sewer: Unknown; Utilities: Other
- Home design: Single family residence; Used for residential purposes
- Exterior features: City street frontage; Lot about 0.12 acres
Interior
- Bedrooms: 2 bedrooms
- Bathrooms: 2 full bathrooms
- Heating & cooling: Central heating; Central air conditioning
- Interior features: No built-in appliances listed
Neighborhood map
What this means for you Summary
Snapshot
- This is a 2-bed/1.0-bath single-family listed at $115k.
Deal economics
- At list price, monthly cash flow is $193 ($2k/yr) — positive.
- The deal already cash-flows at list — no discount required.
- Meets the 1% rule at list price ($1k rent vs $115k).
- Recommended offer: $111k (3.0% below list) — sets the bar for market timing.
- Cap rate 8.3% vs local median 3.9% in Jacksonville — top-decile yield for the area; either an underpriced asset or a hidden risk that comps aren't pricing in. Stress-test before assuming the spread holds.
Location & tenants
- Location reads 83/100 on livability (#50 in FL, #911 nationally) — a professional / high-income tenant draw. Strengths: amenities A+, commute A+, housing A+.
- Duval (urban): math 46% / reading 45% proficiency, ranked #48 of 73 in FL (top 66%) — families likely to look elsewhere, expect single-tenant / working-renter base with shorter leases.
- Zoned schools: North Shore Elementary (math 49% / reading 36%, grade F, #1,383 of 2,144 statewide, top 65%, 701 students, 86% FRL); Joseph Stilwell Middle School (math 31% / reading 33%, grade F, #448 of 571 statewide, top 79%, 612 students, 68% FRL); Andrew Jackson High School (math 30% / reading 26%, grade F, #464 of 667 statewide, top 70%, 870 students, 54% FRL) — zoned schools average 69% FRL vs 49% district-wide (20 pts higher); higher-poverty schools than district average — tighter screening recommended.
- Market conditions: Rents soft (-1.4%/yr); 294 active listings in the ZIP; 40 comparable units currently listed for rent nearby; rentals at typical pace (median 19d on market — plan ~3-4 weeks tenant-placement turnaround); lower-income renter base — watch delinquency; 6,503 units permitted in Duval County in 2024 (1,131 in 5+ unit buildings).
- This rent runs 36% of the median local income ($41k/yr) — at the standard rent-burdened threshold; future hikes will face affordability resistance.
Forward outlook
- Local home prices are declining (-3.0%/yr); year-one equity from $794 of loan paydown is wiped out by about $3k of value loss. Plan a longer hold.
- Duval County population projected at +19% by 2050 — long-run rental-demand tailwind backs the buy-and-hold thesis.
Negotiation context
- It's been on market 45 days — a 3% lower offer ($111k) is reasonable based on typical stale-listing flexibility.
Risks & watch-outs
- Watch-outs: built in 1941 — expect roof / HVAC / electrical / plumbing capex.
- Climate carrying-cost: severe wind risk, 99% chance of damaging wind over 30y; extreme-heat days projected 6→17/yr by 2055 (HVAC capex compounding) — expect insurance premiums to compound above CPI over the hold.
Questions for the listing agent
- It's been on market 45 days. Have you received any prior offers? Is the seller open to a 3% concession, seller financing, or rate buy-down credit?
- Built in 1941 — when were the roof, HVAC, electrical panel, plumbing, and water heater last replaced?
- Is there a deadline driving the sale (1031 exchange, divorce, estate, relocation)? That informs how much negotiation room exists.
- Schools are B-rated — typically a magnet for longer-tenancy family renters. What's the average tenant stay here, and is there a school-zone premium baked into asking?
- What's the average days-on-market for RENTAL listings here right now (not sales)? A rising rental-DOM trend means longer vacancies and softer asking-rent achievability than the comps imply.
- What's the recent tenant-quality profile in this submarket — average credit score on applications, eviction rate, late-payment / NSF rate, and stable-employment percentage? A property-management company in the area should have these aggregated.
- How much new for-sale + rental construction is in the pipeline within 1–3 miles? Heavy new supply typically softens prices + rents 12–24 months out; constrained supply supports both.
Investment metrics
- 1% rule
- 1.08% ✓
- Cap rate
- 8.31%
- Cash-on-cash
- 7.20%
- DSCR
- 1.32
- GRM
- 7.7
CMA / ARV
- ARV (on-the-fly)
- $178,704
- Comps found
- 12
Show comp detail 12 sales within ~0.75 mi
| Address | Dist | Beds/Ba | Sqft | Sold | Price | $/sf | Match |
|---|---|---|---|---|---|---|---|
| 7625 N North Shore Dr | 0.16mi | 3/2.0 (+1) | 1,214 (-1%) | 1mo | $215,500 | $178 | 81 |
| 280 Mulberry St | 0.51mi | 2/1.0 | 1,193 (-2%) | 4mo | $184,000 | $154 | 69 |
| 918 Deerwood Cir S | 0.42mi | 3/2.0 (+1) | 1,209 (-1%) | 3mo | $235,000 | $194 | 67 |
| 434 W 60th St | 0.37mi | 3/1.0 (+1) | 1,164 (-5%) | 4mo | $88,000 | $76 | 66 |
| 465 W 60th St | 0.33mi | 2/3.5 | 1,157 (-6%) | 3mo | $89,000 | $77 | 63 |
| 448 W 68th St | 0.33mi | 2/1.0 | 1,074 (-12%) | 4mo | $141,000 | $131 | 60 |
| 7825 Tory Pl | 0.62mi | 3/1.0 (+1) | 1,252 (+2%) | 2mo | $170,000 | $136 | 60 |
| 6560 Perry St | 0.53mi | 3/2.0 (+1) | 1,260 (+3%) | 5mo | $240,000 | $190 | 57 |
| 930 Kenmore St | 0.62mi | 3/2.0 (+1) | 1,253 (+2%) | 4mo | $182,990 | $146 | 54 |
| 182 W 61st St | 0.58mi | 2/3.0 | 1,161 (-5%) | 3mo | $125,770 | $108 | 54 |
| 918 Glencarin St | 0.59mi | 2/1.0 | 1,400 (+14%) | 0mo | $195,000 | $139 | 48 |
| 110 Tallulah Ave | 0.70mi | 3/1.0 (+1) | 1,102 (-10%) | 2mo | $181,000 | $164 | 44 |
Match score weights: distance 35% · size 25% · config 20% · recency 20%. Top-matched comps best support the ARV.
Projected returns pro-forma
-3.0% appreciation · 0.0% rent growth · sell at horizon
- IRR
- -8.7%
- Equity multiple
- 0.69×
- Total profit
- $-9,963
- Equity at exit
- $17,132
- IRR
- -3.7%
- Equity multiple
- 0.79×
- Total profit
- $-6,885
- Equity at exit
- $9,934
Cash invested: $32,172 (down + closing). Projections, not guarantees.
Landlord ↔ Tenant lean methodology
- Overall (STATE)
- 87 Strongly Landlord-Friendly
- State Florida
- 87 Strongly Landlord-Friendly · R+3
- County
- — inherits STATE
- City
- — inherits STATE
ZIP-level market 32208
- Home prices YoY
- -33.6%
- Rents YoY
- -1.4%
- Active inventory
- 294
- Price-to-rent
- 7.7×
Monthly cashflow live
- Estimated rent
- $1,245 high interval (Pro) →
- Mortgage (P&I)
- −$603
- Tax from tax record
- −$140 /mo · $1,681/yr
- Insurance
- −$48
- HOA
- −$0
- Vacancy / Maint / Mgmt
- −$261
- Net cashflow
- $193
Break-even live
Sensitivity live
| Price | -10% $258 | -5% $225 | +0% $193 | +5% $160 | +10% $128 |
|---|---|---|---|---|---|
| Rent | -10% $95 | -5% $144 | +0% $193 | +5% $242 | +10% $291 |
| Rate | -1.0pp $251 | -0.5pp $222 | base $193 | +0.5pp $163 | +1.0pp $133 |
UW: 25.0% down · 7.5% · 30yr · 1.5% tax · 5.0% vac · 8.0% maint · 8.0% mgmt
Financing live
Cash to close
- Down payment
- $28,725
- Closing costs
- $3,447
- Reserves months
- —
- Total cash needed
- —
Loan-product check · same deal, 3 products live
Conventional
25% down · 7.5% · 30yr
- Down + closing
- —
- Monthly P&I
- —
- Monthly cashflow
- —
- DSCR
- —
- Eligible?
- —
Personal DTI + credit; lowest rate.
DSCR
20% down · 8.5% · 30yr
- Down + closing
- —
- Monthly P&I
- —
- Monthly cashflow
- —
- DSCR
- —
- Eligible?
- —
No personal income docs; deal must DSCR.
Hard money
10% down · 12.0% · 12mo
- Down + closing
- —
- Monthly P&I
- —
- Monthly cashflow
- —
- DSCR
- —
- Eligible?
- —
Short-term bridge; refi at stabilization.
Rent comps 40 comps
| Address | Beds | Baths | Sqft | Rent | $/sqft | DOM | Units | Dist |
|---|---|---|---|---|---|---|---|---|
| 7210 Elwood Ave Jacksonville, FL | 2.0 | 1.0 | 831 | $995 | $1.20 | 23d | 1 | 0.02mi |
| 7511 N Shore Dr Jacksonville, FL | 2.0 | 1.0 | 1014 | $1,350 | $1.33 | 6d | 1 | 0.14mi |
| 7124 Lorain St Jacksonville, FL | 3.0 | 1.0 | 864 | $1,043 | $1.21 | 4d | 1 | 0.18mi |
| 472 W 65th St Jacksonville, FL | 3.0 | 1.0 | 1312 | $1,295 | $0.99 | 23d | 1 | 0.21mi |
| 535 W 59th St Jacksonville, FL | 3.0 | 2.0 | 816 | $1,395 | $1.71 | 9d | 1 | 0.33mi |
| 343 W 60th St Jacksonville, FL | 3.0 | 1.0 | 1238 | $1,299 | $1.05 | 23d | 1 | 0.38mi |
| 346 W 68th St Jacksonville, FL | 3.0 | 1.0 | 1114 | $1,385 | $1.24 | 6d | 1 | 0.43mi |
| 385 Duray Ct Jacksonville, FL | 3.0 | 1.0 | 932 | $1,250 | $1.34 | 21d | 1 | 0.44mi |
| 356 Duray Ct Jacksonville, FL | 3.0 | 2.0 | 1070 | $1,425 | $1.33 | 15d | 1 | 0.47mi |
| 6460 Lanark Ave Jacksonville, FL | 2.0 | 1.0 | 708 | $1,095 | $1.55 | 25d | 1 | 0.51mi |
| 7350 Linda Dr Jacksonville, FL | 1.0 | 1.0 | 954 | $795 | $0.83 | 9d | 1 | 0.56mi |
| 920 Alderside St Jacksonville, FL | 3.0 | 1.0 | 1255 | $1,195 | $0.95 | 6d | 1 | 0.56mi |
| 646 Escambia St Jacksonville, FL | 3.0 | 2.0 | 1200 | $1,395 | $1.16 | 23d | 1 | 0.57mi |
| 664 Escambia St Jacksonville, FL | 3.0 | 2.0 | 1352 | $1,500 | $1.11 | 19d | 1 | 0.58mi |
| 961 Dorchester St Jacksonville, FL | 2.0 | 1.0 | 884 | $1,025 | $1.16 | 4d | 1 | 0.59mi |
| 851 Broxton St Unit 851 Jacksonville, FL | 1.0 | 1.0 | 700 | $875 | $1.25 | 19d | 1 | 0.61mi |
| 209 Woodrow St Jacksonville, FL | 3.0 | 1.0 | 1282 | $1,325 | $1.03 | 25d | 1 | 0.66mi |
| 7115 Lucky Dr W Jacksonville, FL | 3.0 | 1.0 | 1158 | $1,500 | $1.30 | 25d | 1 | 0.68mi |
| 6418 Sapphire Dr Jacksonville, FL | 3.0 | 1.5 | 1296 | $1,350 | $1.04 | 25d | 1 | 0.69mi |
| 5616 Calvin Ave Jacksonville, FL | 3.0 | 1.0 | 1008 | $1,195 | $1.19 | 9d | 1 | 0.71mi |
| 319 W 49th St Jacksonville, FL | 2.0 | 1.0 | 977 | $1,200 | $1.23 | 25d | 1 | 0.71mi |
| 562 W 49th St Jacksonville, FL | 3.0 | 1.0 | 1091 | $1,195 | $1.10 | 25d | 1 | 0.72mi |
| 425 W 47th St Jacksonville, FL | 3.0 | 1.5 | 1083 | $1,193 | $1.10 | 9d | 1 | 0.74mi |
| 5514 Long St Jacksonville, FL | 2.0 | 1.0 | 941 | $1,250 | $1.33 | 3d | 1 | 0.77mi |
| 41 Tallulah Ave Jacksonville, FL | 3.0 | 1.0 | 1092 | $1,390 | $1.27 | 4d | 1 | 0.81mi |
| 1136 Maynard St Jacksonville, FL | 2.0 | 1.0 | 919 | $1,045 | $1.14 | 25d | 1 | 0.82mi |
| 6701 N Main St Jacksonville, FL | 1.0 | 1.0 | 700 | $950 | $1.36 | 25d | 1 | 0.90mi |
| 7345 Penrose St Jacksonville, FL | 1.0 | 1.0 | 1006 | $685 | $0.68 | 18d | 1 | 0.98mi |
| 7927 Reid Ave Jacksonville, FL | 3.0 | 1.0 | 1055 | $1,500 | $1.42 | 25d | 1 | 1.03mi |
| 1348 Crestwood St Jacksonville, FL | 3.0 | 1.0 | 1300 | $1,100 | $0.85 | 25d | 1 | 1.04mi |
| 7525 Oakwood St Jacksonville, FL | 3.0 | 1.0 | 945 | $1,375 | $1.46 | 16d | 1 | 1.05mi |
| 141 W 43rd St Jacksonville, FL | 3.0 | 2.0 | 1022 | $1,231 | $1.20 | 4d | 1 | 1.06mi |
| 912 Saratoga Blvd Jacksonville, FL | 3.0 | 1.0 | 930 | $1,250 | $1.34 | 25d | 1 | 1.07mi |
| 7545 Wilder Ave Jacksonville, FL | 3.0 | 1.0 | 1300 | $1,150 | $0.88 | 4d | 1 | 1.10mi |
| 1021 Lake Forest Blvd Jacksonville, FL | 3.0 | 1.0 | 1393 | $1,290 | $0.93 | 4d | 1 | 1.11mi |
| 4721 E Castlewood Dr Jacksonville, FL | 3.0 | 1.0 | 1008 | $1,250 | $1.24 | 25d | 1 | 1.13mi |
| 217 E 48th St Jacksonville, FL | 3.0 | 1.0 | 979 | $1,096 | $1.12 | 12d | 1 | 1.15mi |
| 8253 Lexington Dr Jacksonville, FL | 3.0 | 1.0 | 910 | $1,330 | $1.46 | 25d | 1 | 1.15mi |
| 643 Linwood Ave Jacksonville, FL | 3.0 | 2.0 | 1232 | $1,325 | $1.08 | 4d | 1 | 1.15mi |
| 18 W 43rd St Jacksonville, FL | 2.0 | 1.0 | 750 | $795 | $1.06 | 6d | 1 | 1.17mi |
Listing history 15 events
-
2026-06-21days on market $114,900 Active 45 DOM
-
2026-06-18days on market $114,900 Active 42 DOM
-
2026-06-17days on market $114,900 Active 41 DOM
-
2026-06-16days on market $114,900 Active 40 DOM
-
2026-06-15days on market $114,900 Active 39 DOM
-
2026-06-13days on market $114,900 Active 36 DOM
-
2026-06-10days on market $114,900 Active 33 DOM
-
2026-06-08days on market $114,900 Active 32 DOM
-
2026-06-07days on market $114,900 Active 31 DOM
-
2026-06-05days on market $114,900 Active 28 DOM
-
2026-06-03days on market $114,900 Active 27 DOM
-
2026-06-02days on market $114,900 Active 26 DOM
-
2026-06-01days on market $114,900 Active 25 DOM
-
2026-05-31days on market $114,900 Active 24 DOM
-
2026-05-07$114,900 Active
ⓘ Source: listings_history table (triggers on properties + properties_extension) + one-shot
backfill from property_details.listing_events for pre-trigger history.
Tax reassessment forecast FL · Resets to sale price
- Current annual tax
- $1,681 · $140/mo
- Projected year-2 tax
- $1,681 · $140/mo
- Expected delta
- $0/yr ($0/mo · 0.0%)
ⓘ Screening estimate from a state-policy table — verify with the county assessor before closing.
Climate risk First Street
- Flood 3/10 Moderate FEMA zone X (unshaded) · 7% chance over 30 yrs
- Wildfire 2/10 Low
- Heat 9/10 Extreme 6 d/yr ≥107°F today · 17 d/yr by 30 yrs out
- Wind 9/10 Extreme 99% chance of damaging wind over 30 yrs
- Air quality 4/10 Moderate 6 unhealthy d/yr today · 6 by 30 yrs out
Nearby sold comps map
Loading sold comps map…
Walkable amenities ~0.75 mi
Loading nearby amenities…
Taxation est. · year 1
- Rental income
- $14,938
- − Mortgage interest
- −$6,436
- − Property taxes
- −$1,681
- − Insurance
- −$574
- − Repairs & maintenance
- −$1,195
- − Management
- −$1,195
- − Depreciation
- −$3,343
- Taxable income
- $514
- Est. tax owed @ 24.0%
- −$123
- After-tax cash flow
- $2,192/yr
For passive investors: Depreciation is non-cash, so a rental often shows a tax loss while cash-flowing — sheltering income. Rental losses are passive: they offset passive income freely, and up to $25,000/yr can offset ordinary (W-2) income if you actively participate and your MAGI is under $100k (phasing out to $0 by $150k); unused losses carry forward. On sale, claimed depreciation is recaptured at up to 25%, and gains may owe capital-gains tax (a 1031 exchange can defer both). Figures are a year-1 estimate at your 24.0% rate — not tax advice; consult a CPA.
Schools (NCES district)
- District
- Duval
- NCES district ID
- 1200480
- Math proficiency
- 46% ▼ -11.00%
- Reading proficiency
- 45% ▼ -4.00%
- Median HH income
- $48,987
- Composite
- 38.97/100
- National rank
- #4076
- State rank
- #48 of 73 in FL
Livability — Jacksonville
- Score
- 83/100
- State rank
- #50
- US rank
- #911
Category grades
Schools grade is shown separately in the Schools card above.
Census & demographics
- Census place
- Jacksonville, FL
- County
- Duval County · 1,015,274 people
- City population
- 979,034
- Metro
- Jacksonville, FL
- Population (ZIP)
- 32,699
- Household income
- $41,324
- Rent vs Own
- Severe rent burden
- 1765.0
Population outlook (Duval County) Hauer SSP2
- Today (2025)
- 1,013,010 people
- By 2030
- 1,059,228 · +4.6%
- By 2040
- 1,141,439 · +12.7%
- By 2050
- 1,205,258 · +19.0%
- By 2075
- 1,324,282 · +30.7%
- By 2100
- 1,319,620 · +30.3%
Race, ethnicity, and origin ACS 2023
- Neighborhood character
- Predominantly Black (77%)
- Race & ethnicity
- Black 77% White 16% Two or more races 4% Hispanic / Latino 3%
- Common ancestry
- Italian 1%
- Foreign-born
- 2% · Canada
- Languages at home
- 97% English-only · Spanish 2%
Political lean MEDSL · Duval
- 2024 margin
- Toss-up / Even · D 48.7% · R 50.1% · Other 1.2%
- 2008→2024 swing
- +0.4pp no change · 2008: -1.9pp · 2024: -1.5pp
- All cycles
- 2024: R+1.5 2020: D+3.8 2016: R+1.5 2012: R+3.6 2008: R+1.9
Not yet ingested
- Civics
- —
Market trends
- HPI YoY
- ▼ -110.56%
- Current HPI
- 217.9706
- Rent YoY
- ▼ -1.36%
- Metro
- Jacksonville, FL
- State GDP YoY
- ▲ 3.28%
- F500 in state
- 36
Industry mix (Fortune 500 HQ in FL)
| Industry | F500 HQs | Revenue |
|---|---|---|
| Industrial Technology | 2 | $29B |
|
||
| Insurance | 2 | $17B |
|
||
| Retail | 1 | $60B |
|
||
| Technology Distribution | 1 | $58B |
|
||
| Homebuilding | 1 | $35B |
|
||
| Technology Manufacturing | 1 | $35B |
|
||
Price history
1 event — show timeline
- 2026-05-07 Listed $114,900 realMLS
Property tax history
+21.0%/yrLatest (2025): $1,681 · +14.5% YoY. Source: county tax records.
Cash-flow waterfall
monthlySold comps — $/sqft
last 12 mo · ≤1 miLoading sold comps…