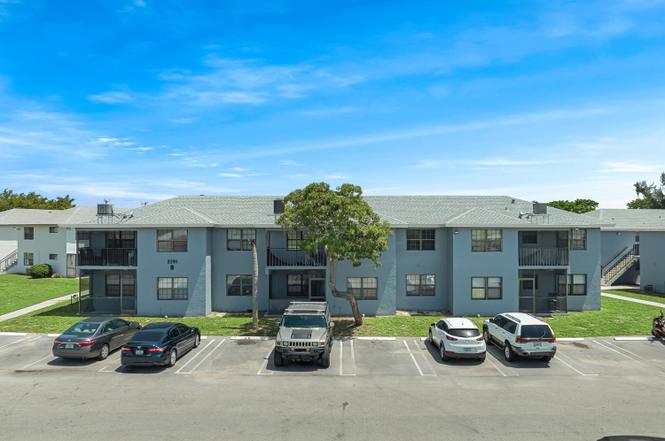
2291 Linton Ridge Cir Unit B4 · Delray Beach, FL
Flood risk 4/10 · Minor
- FEMA flood zone
- X (unshaded)
- Chance of flooding over 30 yrs
- 0.24%
- Est. flood insurance / yr
- $507 – $1,088
Fire risk 1/10 · Minimal
- Est. fire insurance / yr
- $947 – $1,759
Heat risk 9/10 · Severe
- Hot days now (above 105°F)
- 7 days/yr
- Hot days in 30 yrs
- 25 days/yr
Wind risk 10/10 · Severe
- Chance of severe wind over 30 yrs
- 99.0%
Air-quality risk 3/10 · Minor
- Unhealthy air days now
- 2 days/yr
- Unhealthy air days in 30 yrs
- 3 days/yr
Risk factors via First Street. Map © Google.
Why this score? — see what drove the C+ grade
The composite is a weighted blend of 9 inputs, each scored 0–100. Each bar is that input's sub-score; the figure is the points it added to the 100-point composite (weight × sub-score).
- Cash flow +25.3/30.0
- 1% rule +9.6/10.0
- DSCR +8.3/10.0
- ARV discount +7.5/15.0
- Schools +4.3/10.0
- Livability +3.9/5.0
- Rent growth +2.9/5.0
- Condition / age +2.5/5.0
- Appreciation +0.0/10.0
$190,000
🖨 Deal sheet 📄 Offer letter ✓ Due diligence
Listing remarks MLS
INVESTOR SPECIAL! Perfect for rental income or first time homebuyers and make it your own! 2/2 corner unit largest model on second floor. Has tenant in place until April 2023. Close to the beaches and Downtown Delray on The Ave, can jog or ride your bike there! Tons of shops and places to eat nearby!
Key facts
- Great amenities
- High demand area
- Updated kitchen
Tags
Property features AI
Finance
- Financial info: Pets allowed with breed and size restrictions
- HOA & community: Monthly HOA fee (approx. $455) covering insurance, ground maintenance, sewer, trash, and water; Association amenities include parking, pool, and picnic area
Exterior
- Parking: Assigned parking
- Utilities: Public water; Public sewer; Three-phase electric; Sewer available; Water available
- Home design: Condominium; 2-story building; Faces East; Resale property
- Construction: CBS construction
- Exterior features: No waterfront; Community pool; Picnic area
Interior
- Kitchen: Electric range; Microwave
- Bedrooms: 2 bedrooms on the main level
- Flooring: Vinyl
- Bathrooms: 2 full bathrooms on the main level
- Heating & cooling: Central heating; Central air conditioning
- Interior features: Unfurnished; Electric range; Microwave
- Laundry & utility: Laundry inside
Neighborhood map
What this means for you Summary
Snapshot
- This is a 2-bed/2.0-bath condo listed at $190k.
Deal economics
- At list price, monthly cash flow is $431 ($5k/yr) — positive.
- The deal already cash-flows at list — no discount required.
- Meets the 1% rule at list price ($3k rent vs $190k).
- Recommended offer: $167k (12.0% below list) — sets the bar for market timing.
- Cap rate 9.0% vs local median 4.3% in Delray Beach — top-decile yield for the area; either an underpriced asset or a hidden risk that comps aren't pricing in. Stress-test before assuming the spread holds.
Location & tenants
- Location reads 77/100 on livability (#202 in FL, #3,160 nationally) — a middle-class / working-renter tenant base. Strengths: housing A+, health & safety A+, commute A-; Watch: cost of living C-, crime D-, amenities F.
- Palm Beach (suburban): math 46% / reading 53% proficiency, ranked #34 of 73 in FL (top 47%) — families likely to look elsewhere, expect single-tenant / working-renter base with shorter leases.
- Market conditions: Rents rising (+1.6%/yr); 233 active listings in the ZIP; 40 comparable units currently listed for rent nearby; rentals at typical pace (median 19d on market — plan ~3-4 weeks tenant-placement turnaround); 3,974 units permitted in Palm Beach County in 2024 (1,012 in 5+ unit buildings).
- At $2,774/mo this rent would consume 46% of the median local household income ($73k/yr) (locally 1211% of renters already pay >50% of income on rent) — very limited rent-growth headroom before tenants either downsize or default.
Forward outlook
- Local home prices are declining (-3.0%/yr); year-one equity from $1k of loan paydown is wiped out by about $6k of value loss. Plan a longer hold.
- Palm Beach County population projected at +30% by 2050 — long-run rental-demand tailwind backs the buy-and-hold thesis.
Negotiation context
- It's been on market 322 days — a 12% lower offer ($167k) is reasonable based on typical stale-listing flexibility.
- 5 sale attempts since 9y ago; this cycle's ask has dropped $10k (5%) from the opening price — seller is motivated, your offer sets the floor, not the list.
- Current owner paid $155k; 23% above their basis — modest negotiation headroom, anchor on the comps not their cost.
Risks & watch-outs
- Climate carrying-cost: severe wind risk, 99% chance of damaging wind over 30y; extreme-heat days projected 7→25/yr by 2055 (HVAC capex compounding) — expect insurance premiums to compound above CPI over the hold.
Questions for the listing agent
- It's been on market 322 days. Have you received any prior offers? Is the seller open to a 12% concession, seller financing, or rate buy-down credit?
- What does the HOA fee cover, when was the last increase, and are there any pending special assessments or reserve-fund shortfalls?
- Any open or pending special assessments — roof, HVAC, plumbing, elevator, façade? What's the per-unit balance and payoff schedule, and is the seller paying it off at close or rolling it to the buyer?
- Why hasn't it sold? Are there any deal-killer items the seller is aware of (foundation, flood, title, zoning, code violations)?
- Is there a deadline driving the sale (1031 exchange, divorce, estate, relocation)? That informs how much negotiation room exists.
- Schools are B-rated — typically a magnet for longer-tenancy family renters. What's the average tenant stay here, and is there a school-zone premium baked into asking?
- Crime grade is D in this area — have there been break-ins, vandalism, or insurance claims at this property in the last 3 years? What carrier currently insures it and at what premium?
- What's the average days-on-market for RENTAL listings here right now (not sales)? A rising rental-DOM trend means longer vacancies and softer asking-rent achievability than the comps imply.
- What's the recent tenant-quality profile in this submarket — average credit score on applications, eviction rate, late-payment / NSF rate, and stable-employment percentage? A property-management company in the area should have these aggregated.
- How much new apartment / multifamily construction is in the pipeline within 1–3 miles? Heavy new supply (>2% of stock underway) typically softens rents 12–24 months out; light construction supports rent growth.
Investment metrics
- 1% rule
- 1.46% ✓
- Cap rate
- 9.01%
- Cash-on-cash
- 9.72%
- DSCR
- 1.43
- GRM
- 5.7
CMA / ARV
No comps found within radius.
Projected returns pro-forma
-3.0% appreciation · 1.63% rent growth · sell at horizon
- IRR
- -3.5%
- Equity multiple
- 0.87×
- Total profit
- $-6,802
- Equity at exit
- $28,330
- IRR
- 4.3%
- Equity multiple
- 1.29×
- Total profit
- $15,640
- Equity at exit
- $16,428
Cash invested: $53,200 (down + closing). Projections, not guarantees.
Landlord ↔ Tenant lean methodology
- Overall (STATE)
- 87 Strongly Landlord-Friendly
- State Florida
- 87 Strongly Landlord-Friendly · R+3
- County
- — inherits STATE
- City
- — inherits STATE
ZIP-level market 33444
- Rents YoY
- 1.6%
- Active inventory
- 233
- Price-to-rent
- 5.7×
Monthly cashflow live
- Estimated rent
- $2,774 high interval (Pro) →
- Mortgage (P&I)
- −$996
- Tax from tax record
- −$230 /mo · $2,760/yr
- Insurance
- −$79
- HOA
- −$455
- Vacancy / Maint / Mgmt
- −$583
- Net cashflow
- $431
Break-even live
UW: 25.0% down · 7.5% · 30yr · 1.5% tax · 5.0% vac · 8.0% maint · 8.0% mgmt
Financing live
Cash to close
- Down payment
- $47,500
- Closing costs
- $5,700
- Reserves months
- —
- Total cash needed
- —
Loan-product check · same deal, 3 products live
Conventional
25% down · 7.5% · 30yr
- Down + closing
- —
- Monthly P&I
- —
- Monthly cashflow
- —
- DSCR
- —
- Eligible?
- —
Personal DTI + credit; lowest rate.
DSCR
20% down · 8.5% · 30yr
- Down + closing
- —
- Monthly P&I
- —
- Monthly cashflow
- —
- DSCR
- —
- Eligible?
- —
No personal income docs; deal must DSCR.
Hard money
10% down · 12.0% · 12mo
- Down + closing
- —
- Monthly P&I
- —
- Monthly cashflow
- —
- DSCR
- —
- Eligible?
- —
Short-term bridge; refi at stabilization.
Rent comps 40 comps
| Address | Beds | Baths | Sqft | Rent | $/sqft | DOM | Units | Dist |
|---|---|---|---|---|---|---|---|---|
| 2259 Linton Ridge Cir Unit G4 Delray Beach, FL | 2.0 | 2.0 | 1007 | $1,900 | $1.89 | 7d | 1 | 0.03mi |
| 2259 Linton Ridge Cir Unit G4 Delray Beach, FL | 2.0 | 2.0 | 1007 | $1,900 | $1.89 | 24d | 1 | 0.03mi |
| 320 Sterling Ave Delray Beach, FL | 3.0 | 1.0 | 1000 | $3,500 | $3.50 | 24d | 1 | 0.19mi |
| 1100 SW 4th Ave Delray Beach, FL | 2.0 | 2.0 | 855 | $2,150 | $2.51 | 15d | 5 | 0.19mi |
| 905 Southridge Rd Unit 202D Delray Beach, FL | 2.0 | 2.0 | 1014 | $1,850 | $1.82 | 10d | 1 | 0.30mi |
| 905 Southridge Rd Unit 202D Delray Beach, FL | 2.0 | 2.0 | 1014 | $2,050 | $2.02 | 11d | 1 | 0.30mi |
| 650 Lavers Cir Delray Beach, FL | 1.0–3.0 | 1.0–2.0 | 1035 | $2,736 | $2.64 | 1d | 16 | 0.32mi |
| 820 Lavers Cir Unit G311 Delray Beach, FL | 1.0 | 1.0 | 731 | $2,000 | $2.74 | 24d | 1 | 0.33mi |
| 1020 E Longport Cir Delray Beach, FL | 3.0 | 3.0 | 1328 | $3,200 | $2.41 | 16d | 1 | 0.37mi |
| 1020 E Longport Cir Unit F2 Delray Beach, FL | 3.0 | 3.0 | 1328 | $3,200 | $2.41 | 24d | 1 | 0.37mi |
| 950 Lavers Cir Delray Beach, FL | 2.0 | 2.0 | 1110 | $3,625 | $3.26 | 24d | 2 | 0.37mi |
| 107 Central Ave Delray Beach, FL | 2.0 | 2.0 | 972 | $3,400 | $3.50 | 21d | 1 | 0.41mi |
| 1915 Lavers Cir Delray Beach, FL | 2.0 | 2.0 | 1204 | $3,300 | $2.74 | 5d | 4 | 0.44mi |
| 1915 Lavers Cir Delray Beach, FL | 1.0–2.0 | 1.0–2.0 | 990 | $4,500 | $4.55 | 11d | 5 | 0.44mi |
| 825 Egret Cir Delray Beach, FL | 2.0 | 2.0 | 1213 | $3,025 | $2.49 | 2d | 3 | 0.44mi |
| 955 Egret Cir Delray Beach, FL | 2.0 | 2.0 | 1213 | $3,300 | $2.72 | 3d | 3 | 0.44mi |
| 825 Egret Cir #110 Delray Beach, FL | 2.0 | 2.0 | 1272 | $2,500 | $1.97 | 24d | 1 | 0.46mi |
| 600 Egret Cir Delray Beach, FL | 1.0–2.0 | 1.0–2.0 | 1024 | $4,000 | $3.91 | 24d | 5 | 0.48mi |
| 2025 Lavers Cir Delray Beach, FL | 2.0 | 2.0 | 1205 | $3,550 | $2.94 | 24d | 2 | 0.48mi |
| 1045 Miami Blvd Delray Beach, FL | 2.0 | 1.0 | 855 | $2,100 | $2.46 | 24d | 1 | 0.49mi |
| 608 SW 8th Ct Delray Beach, FL | 3.0 | 1.0 | 1100 | $2,700 | $2.45 | 24d | 1 | 0.49mi |
| 500 Egret Cir Delray Beach, FL | 2.0 | 2.0 | 1175 | $3,100 | $2.64 | 5d | 2 | 0.50mi |
| 750 Egret Cir Delray Beach, FL | 2.0 | 2.0 | 1232 | $3,425 | $2.78 | 16d | 2 | 0.52mi |
| 450 Egret Cir Delray Beach, FL | 2.0–3.0 | 2.0–2.5 | 1369 | $1,980 | $1.45 | 14d | 5 | 0.54mi |
| 450 Egret Cir Delray Beach, FL | 2.0–3.0 | 2.0–2.5 | 1369 | $2,600 | $1.90 | 16d | 3 | 0.54mi |
| 2105 Lavers Cir Delray Beach, FL | 2.0 | 2.0 | 1211 | $4,250 | $3.51 | 20d | 1 | 0.54mi |
| 950 Egret Cir Delray Beach, FL | 1.0 | 1.0 | 1175 | $2,000 | $1.70 | 5d | 1 | 0.55mi |
| 1555 S Federal Hwy #206 Delray Beach, FL | 2.0 | 2.0 | 1243 | $3,200 | $2.57 | 10d | 1 | 0.55mi |
| 743 S Swinton Ave Unit 1 Delray Beach, FL | 2.0 | 1.0 | 900 | $1,900 | $2.11 | 24d | 1 | 0.59mi |
| 2455 Lindell Blvd Delray Beach, FL | 1.0–2.0 | 1.0–2.0 | 1011 | $7,500 | $7.42 | 5d | 3 | 0.61mi |
| 2455 Lindell Blvd Delray Beach, FL | 2.0 | 2.0 | 1175 | $5,125 | $4.36 | 18d | 2 | 0.61mi |
| 2395 Jaeger Dr Unit 3D Delray Beach, FL | 2.0 | 2.0 | 1056 | $2,450 | $2.32 | 24d | 1 | 0.62mi |
| 516 Osprey Dr Delray Beach, FL | 2.0 | 2.0 | 1056 | $2,550 | $2.41 | 20d | 1 | 0.62mi |
| 516 Osprey Dr Unit 16B Delray Beach, FL | 2.0 | 2.0 | 1048 | $3,000 | $2.86 | 24d | 1 | 0.62mi |
| 320 Franklin Club Dr Delray Beach, FL | 1.0–2.0 | 1.0–2.0 | 989 | $3,171 | $3.20 | 1d | 8 | 0.63mi |
| 320 Franklin Club Dr Unit Palm Delray Beach, FL | 1.0 | 1.0 | 1017 | $2,408 | $2.37 | 24d | 1 | 0.63mi |
| 517 Dotterel Rd Unit 31C Delray Beach, FL | 2.0 | 2.0 | 1056 | $2,200 | $2.08 | 24d | 1 | 0.65mi |
| 755 Dotterel Rd Delray Beach, FL | 2.0 | 2.0 | 1175 | $3,598 | $3.06 | 4d | 2 | 0.65mi |
| 2255 Lindell Blvd Delray Beach, FL | 1.0–2.0 | 1.0–2.5 | 1007 | $4,500 | $4.47 | 14d | 8 | 0.65mi |
| 213 SE 9th St Delray Beach, FL | 2.0 | 1.0 | 1400 | $2,200 | $1.57 | 21d | 1 | 0.66mi |
HOA detail condo
- Monthly dues
- $455 · $5,460/yr
- Assessments
- None detected in remarks — confirm with the listing agent.
Listing history 26 events
-
2026-06-18days on market $190,000 Active 322 DOM
-
2026-06-17days on market $190,000 Active 321 DOM
-
2026-06-16days on market $190,000 Active 320 DOM
-
2026-06-15days on market $190,000 Active 319 DOM
-
2026-06-13days on market $190,000 Active 317 DOM
-
2026-06-09days on market $190,000 Active 313 DOM
-
2026-06-07days on market $190,000 Active 311 DOM
-
2026-06-04days on market $190,000 Active 308 DOM
-
2026-06-03days on market $190,000 Active 307 DOM
-
2026-06-01days on market $190,000 Active 305 DOM
-
2026-05-31days on market $190,000 Active 304 DOM
-
2025-10-08price $190,000
-
2025-07-31$200,000 Active
-
2022-11-23soldstatus $155,000
-
2022-11-18soldstatus $155,000 Closed 301-char remark
Show marketing remark (301 chars)
INVESTOR SPECIAL! Perfect for rental income or first time homebuyers and make it your own! 2/2 corner unit largest model on second floor. Has tenant in place until April 2023. Close to the beaches and Downtown Delray on The Ave, can jog or ride your bike there! Tons of shops and places to eat nearby!
-
2022-10-24historical Active Under Contract 301-char remark
Show marketing remark (301 chars)
INVESTOR SPECIAL! Perfect for rental income or first time homebuyers and make it your own! 2/2 corner unit largest model on second floor. Has tenant in place until April 2023. Close to the beaches and Downtown Delray on The Ave, can jog or ride your bike there! Tons of shops and places to eat nearby!
-
2022-10-20$160,000 Active 301-char remark
Show marketing remark (301 chars)
INVESTOR SPECIAL! Perfect for rental income or first time homebuyers and make it your own! 2/2 corner unit largest model on second floor. Has tenant in place until April 2023. Close to the beaches and Downtown Delray on The Ave, can jog or ride your bike there! Tons of shops and places to eat nearby!
-
2020-04-01soldstatus $108,000
-
2020-03-25soldstatus $108,000 Closed 129-char remark
Show marketing remark (129 chars)
FRIENDLY COMMUNITY , HALF OF MILE TO BEACH. CLOSE TO SHOPPING, SCHOOLS. NEAR HOUSE OF WORSHIP INVESTORS ABLE TO RENT IMMEDIATELY
-
2020-02-26historical Contingent 129-char remark
Show marketing remark (129 chars)
FRIENDLY COMMUNITY , HALF OF MILE TO BEACH. CLOSE TO SHOPPING, SCHOOLS. NEAR HOUSE OF WORSHIP INVESTORS ABLE TO RENT IMMEDIATELY
-
2020-02-20$115,000 Active 129-char remark
Show marketing remark (129 chars)
FRIENDLY COMMUNITY , HALF OF MILE TO BEACH. CLOSE TO SHOPPING, SCHOOLS. NEAR HOUSE OF WORSHIP INVESTORS ABLE TO RENT IMMEDIATELY
-
2018-05-26historical
-
2018-01-15status Active
-
2018-01-13historical
-
2017-11-01price $87,000
-
2017-10-23$85,000 Active
ⓘ Source: listings_history table (triggers on properties + properties_extension) + one-shot
backfill from property_details.listing_events for pre-trigger history.
Tax reassessment forecast FL · Resets to sale price
- Current annual tax
- $2,760 · $230/mo
- Projected year-2 tax
- $2,760 · $230/mo
- Expected delta
- $0/yr ($0/mo · 0.0%)
ⓘ Screening estimate from a state-policy table — verify with the county assessor before closing.
Climate risk First Street
- Flood 4/10 Moderate FEMA zone X (unshaded) · 24% chance over 30 yrs
- Wildfire 1/10 Low
- Heat 9/10 Extreme 7 d/yr ≥105°F today · 25 d/yr by 30 yrs out
- Wind 10/10 Extreme 99% chance of damaging wind over 30 yrs
- Air quality 3/10 Moderate 2 unhealthy d/yr today · 3 by 30 yrs out
Nearby sold comps map
Loading sold comps map…
Walkable amenities ~0.75 mi
Loading nearby amenities…
Taxation est. · year 1
- Rental income
- $33,287
- − Mortgage interest
- −$10,643
- − Property taxes
- −$2,760
- − Insurance
- −$950
- − Repairs & maintenance
- −$2,663
- − Management
- −$2,663
- − HOA
- −$5,460
- − Depreciation
- −$5,527
- Taxable income
- $2,621
- Est. tax owed @ 24.0%
- −$629
- After-tax cash flow
- $4,541/yr
For passive investors: Depreciation is non-cash, so a rental often shows a tax loss while cash-flowing — sheltering income. Rental losses are passive: they offset passive income freely, and up to $25,000/yr can offset ordinary (W-2) income if you actively participate and your MAGI is under $100k (phasing out to $0 by $150k); unused losses carry forward. On sale, claimed depreciation is recaptured at up to 25%, and gains may owe capital-gains tax (a 1031 exchange can defer both). Figures are a year-1 estimate at your 24.0% rate — not tax advice; consult a CPA.
Schools (NCES district)
- District
- Palm Beach
- NCES district ID
- 1201500
- Math proficiency
- 46% ▼ -16.00%
- Reading proficiency
- 53% ▼ -4.00%
- Median HH income
- $53,943
- Composite
- 42.72/100
- National rank
- #3160
- State rank
- #34 of 73 in FL
Livability — Delray Beach
- Score
- 77/100
- State rank
- #202
- US rank
- #3160
Category grades
Schools grade is shown separately in the Schools card above.
Census & demographics
- Census place
- Delray Beach, FL
- County
- Palm Beach County · 1,438,312 people
- City population
- 123,167
- Metro
- Miami-Fort Lauderdale-Pompano Beach, FL
- Population (ZIP)
- 22,737
- Household income
- $72,925
- Rent vs Own
- Severe rent burden
- 1211.0
Population outlook (Palm Beach County) Hauer SSP2
- Today (2025)
- 1,637,487 people
- By 2030
- 1,743,255 · +6.5%
- By 2040
- 1,948,712 · +19.0%
- By 2050
- 2,132,979 · +30.3%
- By 2075
- 2,530,027 · +54.5%
- By 2100
- 2,706,979 · +65.3%
Race, ethnicity, and origin ACS 2023
- Neighborhood character
- Diverse neighborhood (Simpson 0.64)
- Race & ethnicity
- Black 48% White 35% Hispanic / Latino 13% Two or more races 10% Asian 1%
- Hispanic origin (detail)
- Mexican 3% Puerto Rican 1% Cuban 1%
- Common ancestry
- Hispanic 17% Romanian 2% Italian 2%
- Foreign-born
- 24% · Canada, Jamaica
- Languages at home
- 70% English-only · French/Haitian/Cajun 18% Spanish 11% Other Indo-European 1%
Political lean MEDSL · Palm Beach
- 2024 margin
- Toss-up / Even · D 50.0% · R 49.2%
- 2008→2024 swing
- -22.1pp toward R · 2008: 22.9pp · 2024: 0.8pp
- All cycles
- 2024: D+0.8 2020: D+12.8 2016: D+15.3 2012: D+17.0 2008: D+22.9
Not yet ingested
- Civics
- —
Market trends
- HPI YoY
- ▼ -743.16%
- Current HPI
- 415.3247
- Rent YoY
- ▲ 1.63%
- Metro
- Miami-Fort Lauderdale-Pompano Beach, FL
- State GDP YoY
- ▲ 3.28%
- F500 in state
- 36
Industry mix (Fortune 500 HQ in FL)
| Industry | F500 HQs | Revenue |
|---|---|---|
| Industrial Technology | 2 | $29B |
|
||
| Insurance | 2 | $17B |
|
||
| Retail | 1 | $60B |
|
||
| Technology Distribution | 1 | $58B |
|
||
| Homebuilding | 1 | $35B |
|
||
| Technology Manufacturing | 1 | $35B |
|
||
Price history
+123.5% since first listed15 events — show timeline
- 2025-10-08 Price Changed $190,000 Beaches MLS
- 2025-07-31 Listed $200,000 Beaches MLS
- 2022-11-23 Sold (Public Records) $155,000 Public Records
- 2022-11-18 Sold (MLS) $155,000 MARMLS
- 2022-10-24 Contingent — MARMLS
- 2022-10-20 Listed $160,000 MARMLS
- 2020-04-01 Sold (Public Records) $108,000 Public Records
- 2020-03-25 Sold (MLS) $108,000 Beaches MLS
- 2020-02-26 Contingent — Beaches MLS
- 2020-02-20 Listed $115,000 Beaches MLS
- 2018-05-26 Listing Removed — Beaches MLS
- 2018-01-15 Relisted — Beaches MLS
- 2018-01-13 Listing Removed — Beaches MLS
- 2017-11-01 Price Changed $87,000 Beaches MLS
- 2017-10-23 Listed $85,000 Beaches MLS
Property tax history
+10.9%/yrLatest (2025): $2,760 · +3.8% YoY. Source: county tax records.
Cash-flow waterfall
monthlySold comps — $/sqft
last 12 mo · ≤1 miLoading sold comps…