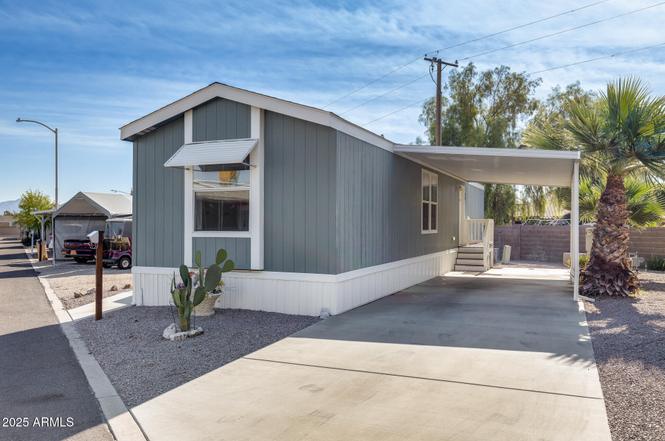
19225 N Cave Creek Rd #70 · Phoenix, AZ
Flood risk 1/10 · Minimal
- FEMA flood zone
- X (shaded)
- Chance of flooding over 30 yrs
- 0.0%
- Est. flood insurance / yr
- $507 – $1,088
Fire risk 4/10 · Minor
- Est. fire insurance / yr
- $610 – $1,132
Heat risk 8/10 · Major
- Hot days now (above 110°F)
- 5 days/yr
- Hot days in 30 yrs
- 14 days/yr
Wind risk 1/10 · Minimal
- Chance of severe wind over 30 yrs
- —
Air-quality risk 3/10 · Minor
- Unhealthy air days now
- 3 days/yr
- Unhealthy air days in 30 yrs
- 5 days/yr
Risk factors via First Street. Map © Google.
Why this score? — see what drove the B+ grade
The composite is a weighted blend of 9 inputs, each scored 0–100. Each bar is that input's sub-score; the figure is the points it added to the 100-point composite (weight × sub-score).
- Cash flow +30.0/30.0
- ARV discount +13.6/15.0
- 1% rule +10.0/10.0
- DSCR +10.0/10.0
- Schools +3.8/10.0
- Livability +3.8/5.0
- Rent growth +2.9/5.0
- Condition / age +2.5/5.0
- Appreciation +0.0/10.0
$47,500
🖨 Deal sheet 📄 Offer letter ✓ Due diligence
Listing remarks
Manufactured & Move-in Ready in North Scottsdale! Located in the desirable Whispering Palms 55+ community, this charming 2-bed, 2-bath manufactured home offers comfort & convenience. The kitchen includes a gas range, refrigerator, dishwasher & dining area that flows seamlessly into the bright living/dining space. Both bedrooms are comfortably sized, with two closets & the primary features an ensuite bath. Washer & dryer are included & conveniently located inside, plus an attached carport for added ease. Community amenities include a pool, clubhouse & pet-friendly spaces for an active yet relaxed lifestyle. With easy access to Loop 101 & Hwy 51
Key facts
- Attached carport
- Community amenities
- Pet-friendly spaces
Tags
Neighborhood map
What this means for you Summary
Snapshot
- This is a 2-bed/2.0-bath manufactured listed at $48k.
Deal economics
- At list price, monthly cash flow is $1k ($12k/yr) — positive.
- The deal already cash-flows at list — no discount required.
- Meets the 1% rule at list price ($2k rent vs $48k).
- Recommended offer: $42k (12.0% below list) — sets the bar for market timing.
- Cap rate 32.6% vs local median 3.3% in Phoenix — top-decile yield for the area; either an underpriced asset or a hidden risk that comps aren't pricing in. Stress-test before assuming the spread holds.
Location & tenants
- Location reads 75/100 on livability (#16 in AZ, #3,924 nationally) — a middle-class / working-renter tenant base. Strengths: amenities A+, commute A+, housing A+; Watch: health & safety C-, crime F.
- Paradise Valley Unified District (4241) (urban): math 39% / reading 46% proficiency, ranked #56 of 249 in AZ (top 22%) — families likely to look elsewhere, expect single-tenant / working-renter base with shorter leases.
- Market conditions: Rents rising (+1.4%/yr); 201 active listings in the ZIP; 14 comparable units currently listed for rent nearby; rentals leasing fast (median 4d on market — plan ~1-2 weeks tenant-placement turnaround); solid renter incomes; 36,011 units permitted in Maricopa County in 2024 (12,801 in 5+ unit buildings).
Forward outlook
- Local home prices are declining (-3.0%/yr); year-one equity from $328 of loan paydown is wiped out by about $1k of value loss. Plan a longer hold.
- Maricopa County population projected at +38% by 2050 — long-run rental-demand tailwind backs the buy-and-hold thesis.
- At projected returns (-3.0% appreciation + 1.4% rent growth), your $13k cash investment doubles in ~2 years — after that, you're playing with house money.
Negotiation context
- It's been on market 145 days — a 12% lower offer ($42k) is reasonable based on typical stale-listing flexibility.
Risks & watch-outs
- Climate carrying-cost: extreme-heat days projected 5→14/yr by 2055 (HVAC capex compounding) — expect insurance premiums to compound above CPI over the hold.
Questions for the listing agent
- It's been on market 145 days. Have you received any prior offers? Is the seller open to a 12% concession, seller financing, or rate buy-down credit?
- Why hasn't it sold? Are there any deal-killer items the seller is aware of (foundation, flood, title, zoning, code violations)?
- Is there a deadline driving the sale (1031 exchange, divorce, estate, relocation)? That informs how much negotiation room exists.
- Crime grade is F in this area — have there been break-ins, vandalism, or insurance claims at this property in the last 3 years? What carrier currently insures it and at what premium?
- What's the average days-on-market for RENTAL listings here right now (not sales)? A rising rental-DOM trend means longer vacancies and softer asking-rent achievability than the comps imply.
- What's the recent tenant-quality profile in this submarket — average credit score on applications, eviction rate, late-payment / NSF rate, and stable-employment percentage? A property-management company in the area should have these aggregated.
- How much new for-sale + rental construction is in the pipeline within 1–3 miles? Heavy new supply typically softens prices + rents 12–24 months out; constrained supply supports both.
Investment metrics
- 1% rule
- 3.65% ✓
- Cap rate
- 32.56%
- Cash-on-cash
- 93.83%
- DSCR
- 5.17
- GRM
- 2.3
CMA / ARV
- ARV (on-the-fly)
- $54,880
- Comps found
- 9
Show comp detail 9 sales within ~0.75 mi
| Address | Dist | Beds/Ba | Sqft | Sold | Price | $/sf | Match |
|---|---|---|---|---|---|---|---|
| 19225 N Cave Creek Rd N #61 | 0.11mi | 2/1.5 | 758 (-3%) | 12mo | $11,000 | $15 | 78 |
| 2619 E Oraibi Dr | 0.25mi | 3/2.0 (+1) | 730 (-7%) | 1mo | $125,000 | $171 | 71 |
| 2502 E Cowan Cir | 0.28mi | 1/1.0 (-1) | 750 (-4%) | 14mo | $169,900 | $227 | 59 |
| 19602 N 32nd St #62 | 0.70mi | 2/2.0 | 784 (0%) | 13mo | $65,000 | $83 | 57 |
| 19602 N 32nd St #24 | 0.70mi | 2/2.0 | 800 (+2%) | 10mo | $62,000 | $78 | 56 |
| 2701 E Utopia Rd #234 | 0.30mi | 2/1.0 | 896 (+14%) | 3mo | $18,000 | $20 | 56 |
| 19602 N 32 St #78 | 0.70mi | 2/2.0 | 792 (+1%) | 19mo | $50,000 | $63 | 50 |
| 2120 E Bluefield Ave #141 | 0.67mi | 1/1.0 (-1) | 768 (-2%) | 13mo | $45,000 | $59 | 45 |
| 18026 N Cave Creek Rd #101 | 0.73mi | 2/1.0 | 784 (0%) | 21mo | $55,000 | $70 | 44 |
Match score weights: distance 35% · size 25% · config 20% · recency 20%. Top-matched comps best support the ARV.
Projected returns pro-forma
-3.0% appreciation · 1.44% rent growth · sell at horizon
- IRR
- 92.9%
- Equity multiple
- 5.20×
- Total profit
- $55,885
- Equity at exit
- $7,082
- IRR
- 95.4%
- Equity multiple
- 10.28×
- Total profit
- $123,410
- Equity at exit
- $4,107
Cash invested: $13,300 (down + closing). Projections, not guarantees.
Landlord ↔ Tenant lean methodology
- Overall (STATE)
- 87 Strongly Landlord-Friendly
- State Arizona
- 87 Strongly Landlord-Friendly · R+3
- County
- — inherits STATE
- City
- — inherits STATE
ZIP-level market 85024
- Home prices YoY
- -21.0%
- Rents YoY
- 1.4%
- Active inventory
- 201
- Price-to-rent
- 2.3×
Monthly cashflow live
- Estimated rent
- $1,732 high interval (Pro) →
- Mortgage (P&I)
- −$249
- Tax est. 1.5%
- −$59 /mo · $712/yr
- Insurance
- −$20
- HOA
- −$0
- Vacancy / Maint / Mgmt
- −$364
- Net cashflow
- $1,040
Break-even live
UW: 25.0% down · 7.5% · 30yr · 1.5% tax · 5.0% vac · 8.0% maint · 8.0% mgmt
Financing live
Cash to close
- Down payment
- $11,875
- Closing costs
- $1,425
- Reserves months
- —
- Total cash needed
- —
Loan-product check · same deal, 3 products live
Conventional
25% down · 7.5% · 30yr
- Down + closing
- —
- Monthly P&I
- —
- Monthly cashflow
- —
- DSCR
- —
- Eligible?
- —
Personal DTI + credit; lowest rate.
DSCR
20% down · 8.5% · 30yr
- Down + closing
- —
- Monthly P&I
- —
- Monthly cashflow
- —
- DSCR
- —
- Eligible?
- —
No personal income docs; deal must DSCR.
Hard money
10% down · 12.0% · 12mo
- Down + closing
- —
- Monthly P&I
- —
- Monthly cashflow
- —
- DSCR
- —
- Eligible?
- —
Short-term bridge; refi at stabilization.
Rent comps 14 comps
| Address | Beds | Baths | Sqft | Rent | $/sqft | DOM | Units | Dist |
|---|---|---|---|---|---|---|---|---|
| 19635 N Cave Creek Rd Phoenix, AZ | 3.0 | 1.0–2.0 | 999 | $1,643 | $1.64 | 1d | 22 | 0.34mi |
| 18660 N Cave Creek Rd Phoenix, AZ | 1.0–3.0 | 1.0–2.0 | 961 | $1,622 | $1.69 | 1d | 11 | 0.39mi |
| 2500 E Marco Polo Rd Phoenix, AZ | 2.0 | 1.0–2.0 | 918 | $2,390 | $2.60 | 2d | 16 | 0.46mi |
| 18416 N Cave Creek Rd Unit 6 Phoenix, AZ | 1.0 | 1.0 | 748 | $1,250 | $1.67 | 7d | 1 | 0.53mi |
| 20050 N Cave Creek Rd Phoenix, AZ | 1.0–2.0 | 1.0–2.0 | 909 | $1,770 | $1.95 | 1d | 10 | 0.54mi |
| 18416 N Cave Creek Rd Phoenix, AZ | 2.0 | 1.0–2.0 | 786 | $3,000 | $3.81 | 3d | 9 | 0.55mi |
| 18202 N Cave Creek Rd Phoenix, AZ | 1.0–3.0 | 1.0–2.0 | 722 | $1,148 | $1.59 | 3d | 7 | 0.68mi |
| 2220 E Beardsley Rd Phoenix, AZ | 4.0 | 1.0–2.0 | 855 | $1,694 | $1.98 | 2d | 62 | 0.73mi |
| 2554 E Villa Rita Dr Phoenix, AZ | 2.0 | 1.0 | 1118 | $2,750 | $2.46 | 24d | 1 | 0.73mi |
| 2077 E Charleston Ave Phoenix, AZ | 2.0 | 1.0 | 720 | $1,295 | $1.80 | 24d | 1 | 0.95mi |
| 2067 E Charleston Ave Phoenix, AZ | 2.0 | 2.0 | 840 | $1,395 | $1.66 | 24d | 1 | 0.96mi |
| 3301 E Wescott Dr Phoenix, AZ | 3.0 | 2.0 | 1101 | $1,995 | $1.81 | 24d | 1 | 0.97mi |
| 17602 N Cave Creek Rd Phoenix, AZ | 2.0 | 1.0–2.0 | 650 | $1,625 | $2.50 | 2d | 13 | 1.04mi |
| 1814 E Bell Rd Phoenix, AZ | 1.0–2.0 | 1.0–2.0 | 1003 | $1,637 | $1.63 | 1d | 12 | 1.48mi |
Listing history 4 events
-
2026-03-30status Pending
-
2026-02-06price $47,500
-
2025-12-29price $49,500
-
2025-11-05$55,000 Active
ⓘ Source: listings_history table (triggers on properties + properties_extension) + one-shot
backfill from property_details.listing_events for pre-trigger history.
Climate risk First Street
- Flood 1/10 Low FEMA zone X (shaded) · 0% chance over 30 yrs
- Wildfire 4/10 Moderate
- Heat 8/10 Severe 5 d/yr ≥110°F today · 14 d/yr by 30 yrs out
- Wind 1/10 Low
- Air quality 3/10 Moderate 3 unhealthy d/yr today · 5 by 30 yrs out
Nearby sold comps map
Loading sold comps map…
Walkable amenities ~0.75 mi
Loading nearby amenities…
Taxation est. · year 1
- Rental income
- $20,782
- − Mortgage interest
- −$2,661
- − Property taxes
- −$712
- − Insurance
- −$238
- − Repairs & maintenance
- −$1,663
- − Management
- −$1,663
- − Depreciation
- −$1,382
- Taxable income
- $12,465
- Est. tax owed @ 24.0%
- −$2,992
- After-tax cash flow
- $9,487/yr
For passive investors: Depreciation is non-cash, so a rental often shows a tax loss while cash-flowing — sheltering income. Rental losses are passive: they offset passive income freely, and up to $25,000/yr can offset ordinary (W-2) income if you actively participate and your MAGI is under $100k (phasing out to $0 by $150k); unused losses carry forward. On sale, claimed depreciation is recaptured at up to 25%, and gains may owe capital-gains tax (a 1031 exchange can defer both). Figures are a year-1 estimate at your 24.0% rate — not tax advice; consult a CPA.
Schools (NCES district)
- District
- Paradise Valley Unified District (4241)
- NCES district ID
- 0405930
- Math proficiency
- 39% ▼ -11.00%
- Reading proficiency
- 46% ▼ -7.00%
- Median HH income
- $64,106
- Composite
- 37.89/100
- National rank
- #4316
- State rank
- #56 of 249 in AZ
Livability — Phoenix
- Score
- 75/100
- State rank
- #16
- US rank
- #3924
Category grades
Schools grade is shown separately in the Schools card above.
Census & demographics
- Census place
- Phoenix, AZ
- County
- Maricopa County · 4,537,380 people
- City population
- 1,500,198
- Metro
- Phoenix-Mesa-Chandler, AZ
- Population (ZIP)
- 26,199
- Household income
- $106,724
- Rent vs Own
- Severe rent burden
- 547.0
Population outlook (Maricopa County) Hauer SSP2
- Today (2025)
- 4,979,203 people
- By 2030
- 5,378,229 · +8.0%
- By 2040
- 6,156,598 · +23.6%
- By 2050
- 6,872,376 · +38.0%
- By 2075
- 8,401,270 · +68.7%
- By 2100
- 9,247,439 · +85.7%
Race, ethnicity, and origin ACS 2023
- Neighborhood character
- Predominantly White (71%)
- Race & ethnicity
- White 71% Hispanic / Latino 16% Two or more races 12% Asian 6% Black 2%
- Hispanic origin (detail)
- Mexican 13% Puerto Rican 1%
- Common ancestry
- Romanian 3% Italian 3% Portuguese 3%
- Foreign-born
- 12% · Canada, China, South Korea
- Languages at home
- 78% English-only · Spanish 10% Other Indo-European 4% Russian/Polish/Slavic 1%
Political lean MEDSL · Maricopa
- 2024 margin
- Toss-up / Even · D 47.7% · R 51.2% · Other 1.1%
- 2008→2024 swing
- +7.1pp toward D · 2008: -10.6pp · 2024: -3.5pp
- All cycles
- 2024: R+3.5 2020: D+2.2 2016: R+3.5 2012: R+12.0 2008: R+10.6
Not yet ingested
- Civics
- —
Market trends
- HPI YoY
- ▼ -82.95%
- Current HPI
- 312.7238
- Rent YoY
- ▲ 1.44%
- Metro
- Phoenix-Mesa-Chandler, AZ
- State GDP YoY
- ▲ 4.54%
- F500 in state
- 20
Industry mix (Fortune 500 HQ in AZ)
| Industry | F500 HQs | Revenue |
|---|---|---|
| Technology | 2 | $13B |
|
||
| Mining / Metals | 1 | $23B |
|
||
| Environmental Services | 1 | $16B |
|
||
| Metals / Steel | 1 | $14B |
|
||
| Technology Distribution | 1 | $9B |
|
||
| Homebuilding | 1 | $8B |
|
||
Price history
-13.6% since first listed4 events — show timeline
- 2026-03-30 Pending — ARMLS
- 2026-02-06 Price Changed $47,500 ARMLS
- 2025-12-29 Price Changed $49,500 ARMLS
- 2025-11-05 Listed $55,000 ARMLS
Cash-flow waterfall
monthlySold comps — $/sqft
last 12 mo · ≤1 miLoading sold comps…