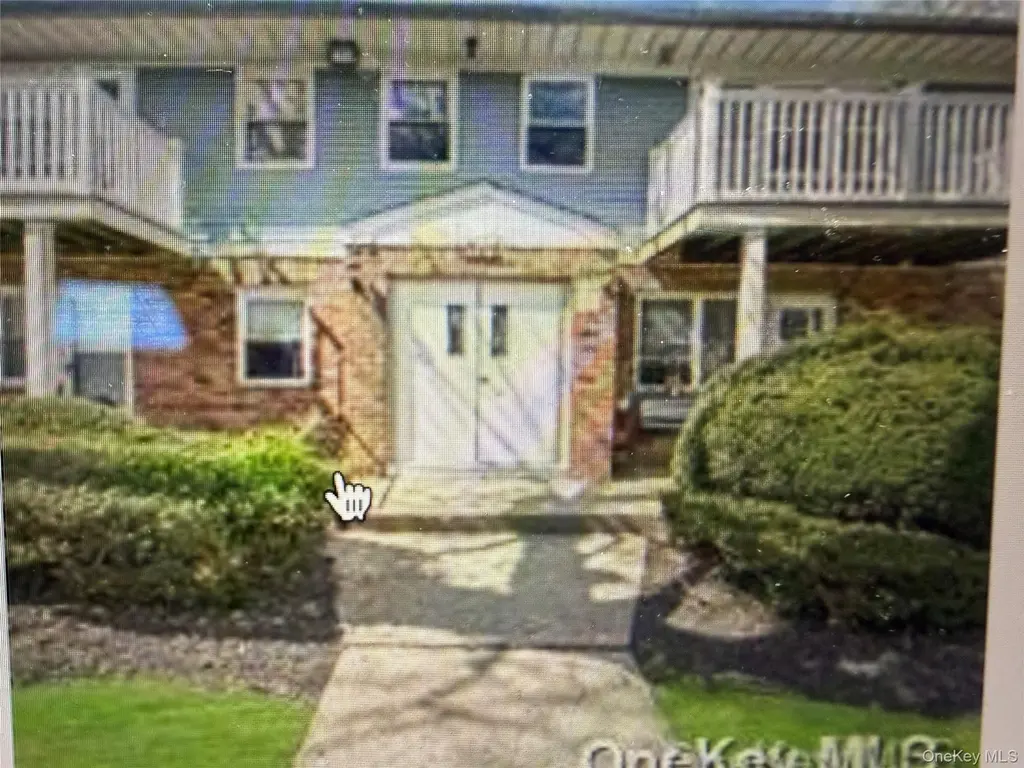
5A Hemlock Dr · North Bay Shore, NY
Flood risk 1/10 · Minimal
- FEMA flood zone
- X (unshaded)
- Chance of flooding over 30 yrs
- 0.0%
- Est. flood insurance / yr
- $507 – $1,088
Fire risk 1/10 · Minimal
- Est. fire insurance / yr
- $691 – $1,283
Heat risk 5/10 · Moderate
- Hot days now (above 94°F)
- 7 days/yr
- Hot days in 30 yrs
- 16 days/yr
Wind risk 6/10 · Moderate
- Chance of severe wind over 30 yrs
- 61.0%
Air-quality risk 4/10 · Minor
- Unhealthy air days now
- 4 days/yr
- Unhealthy air days in 30 yrs
- 6 days/yr
Risk factors via First Street. Map © Google.
Why this score? — see what drove the C- grade
The composite is a weighted blend of 9 inputs, each scored 0–100. Each bar is that input's sub-score; the figure is the points it added to the 100-point composite (weight × sub-score).
- Cash flow +23.5/30.0
- DSCR +7.5/10.0
- 1% rule +6.1/10.0
- ARV discount +5.8/15.0
- Schools +3.2/10.0
- Livability +3.2/5.0
- Rent growth +3.1/5.0
- Condition / age +2.2/5.0
- Appreciation +0.0/10.0
$219,000
🖨 Deal sheet 📄 Offer letter ✓ Due diligence
Listing remarks
Vacant 1 Bedroom first floor with separate office
Key facts
- Built 1967
- Listed 10 days
Neighborhood map
What this means for you Summary
Snapshot
- This is a 1-bed/1.0-bath townhouse listed at $219k. Condition is rated fair.
Deal economics
- At list price, monthly cash flow is $407 ($5k/yr) — positive.
- The deal already cash-flows at list — no discount required.
- Meets the 1% rule at list price ($2k rent vs $219k).
- Cap rate 8.5% vs local median 3.5% in North Bay Shore — top-decile yield for the area; either an underpriced asset or a hidden risk that comps aren't pricing in. Stress-test before assuming the spread holds.
Location & tenants
- Location reads 65/100 on livability (#678 in NY) — a middle-class / working-renter tenant base. Strengths: employment A+, housing A+, health & safety B; Watch: crime D, amenities F, commute F.
- Brentwood Union Free School District (suburban): math 35% / reading 35% proficiency, ranked #542 of 590 in NY (top 92%) — families likely to look elsewhere, expect single-tenant / working-renter base with shorter leases; 66% free/reduced lunch — lower-income household profile, screen leases tightly.
- Zoned schools: East Elementary School (507 students, 74% FRL); East Middle School (math 18% / reading 33%, grade F, #597 of 729 statewide, top 82%, 1,159 students, 87% FRL).
- Market conditions: Rents rising (+2.4%/yr); 208 active listings in the ZIP; 12 comparable units currently listed for rent nearby; rentals lingering (median 44d on market — plan ~5-8 weeks vacancy on turnover, expect pricing pressure); 75% of comp listings sitting > 30 days — soft ceiling on asking rent; high-income renter base; 1,366 units permitted in Suffolk County in 2024 (216 in 5+ unit buildings).
Forward outlook
- Local home prices are declining (-3.0%/yr); year-one equity from $2k of loan paydown is wiped out by about $7k of value loss. Plan a longer hold.
- Suffolk County population projected to shrink 5% by 2050 — rents likely to lag national; underwrite the cash flow, not the appreciation.
Negotiation context
- Only 10 days on market — expect competitive offers; lowballing is unlikely to land.
- 2 sale attempts since 2y ago with the ask held roughly flat each time — persistent listings suggest the price (not the market) is what's stuck; bring a comps-based counter.
Risks & watch-outs
- Climate carrying-cost: major wind risk, 61% chance of damaging wind over 30y; extreme-heat days projected 7→16/yr by 2055 (HVAC capex compounding) — expect insurance premiums to compound above CPI over the hold.
Questions for the listing agent
- Have any recent inspections been done? Can we get a copy of the seller's disclosures and any deferred-maintenance estimates?
- Built in 1967 — when were the roof, HVAC, electrical panel, plumbing, and water heater last replaced?
- Is there a deadline driving the sale (1031 exchange, divorce, estate, relocation)? That informs how much negotiation room exists.
- Schools are D-rated, which usually means shorter tenancies and higher turnover. Who's the typical renter profile here, and what's been the actual vacancy rate?
- Crime grade is D in this area — have there been break-ins, vandalism, or insurance claims at this property in the last 3 years? What carrier currently insures it and at what premium?
- What's the average days-on-market for RENTAL listings here right now (not sales)? A rising rental-DOM trend means longer vacancies and softer asking-rent achievability than the comps imply.
- What's the recent tenant-quality profile in this submarket — average credit score on applications, eviction rate, late-payment / NSF rate, and stable-employment percentage? A property-management company in the area should have these aggregated.
- How much new for-sale + rental construction is in the pipeline within 1–3 miles? Heavy new supply typically softens prices + rents 12–24 months out; constrained supply supports both.
Investment metrics
- 1% rule
- 1.11% ✓
- Cap rate
- 8.52%
- Cash-on-cash
- 7.97%
- DSCR
- 1.35
- GRM
- 7.5
CMA / ARV
- ARV (on-the-fly)
- $211,200
- Comps found
- 3
Show comp detail 3 sales within ~0.75 mi
| Address | Dist | Beds/Ba | Sqft | Sold | Price | $/sf | Match |
|---|---|---|---|---|---|---|---|
| 15 Hemlock Dr E Unit B18 | 0.09mi | 1/1.0 | 800 (0%) | 11mo | $230,000 | $288 | 87 |
| 126 Hemlock Dr Unit 3a | 0.05mi | 2/1.0 (+1) | 871 (+9%) | 1mo | $180,000 | $207 | 77 |
| 5B Hemlock Dr #101 | 0.03mi | 2/1.0 (+1) | 871 (+9%) | 8mo | $230,000 | $264 | 73 |
Match score weights: distance 35% · size 25% · config 20% · recency 20%. Top-matched comps best support the ARV.
Projected returns pro-forma
-3.0% appreciation · 2.37% rent growth · sell at horizon
- IRR
- -4.9%
- Equity multiple
- 0.82×
- Total profit
- $-11,042
- Equity at exit
- $32,654
- IRR
- 4.1%
- Equity multiple
- 1.29×
- Total profit
- $17,731
- Equity at exit
- $18,935
Cash invested: $61,320 (down + closing). Projections, not guarantees.
Landlord ↔ Tenant lean methodology
- Overall (STATE)
- 15 Strongly Tenant-Friendly
- State New York
- 15 Strongly Tenant-Friendly · D+10
- County
- — inherits STATE
- City
- — inherits STATE
ZIP-level market 11706
- Rents YoY
- 2.4%
- Active inventory
- 208
- Price-to-rent
- 7.5×
Monthly cashflow live
- Estimated rent
- $2,431 high interval (Pro) →
- Mortgage (P&I)
- −$1,148
- Tax est. 1.5%
- −$274 /mo · $3,285/yr
- Insurance
- −$91
- HOA
- −$0
- Vacancy / Maint / Mgmt
- −$511
- Net cashflow
- $407
Break-even live
UW: 25.0% down · 7.5% · 30yr · 1.5% tax · 5.0% vac · 8.0% maint · 8.0% mgmt
Financing live
Cash to close
- Down payment
- $54,750
- Closing costs
- $6,570
- Reserves months
- —
- Total cash needed
- —
Loan-product check · same deal, 3 products live
Conventional
25% down · 7.5% · 30yr
- Down + closing
- —
- Monthly P&I
- —
- Monthly cashflow
- —
- DSCR
- —
- Eligible?
- —
Personal DTI + credit; lowest rate.
DSCR
20% down · 8.5% · 30yr
- Down + closing
- —
- Monthly P&I
- —
- Monthly cashflow
- —
- DSCR
- —
- Eligible?
- —
No personal income docs; deal must DSCR.
Hard money
10% down · 12.0% · 12mo
- Down + closing
- —
- Monthly P&I
- —
- Monthly cashflow
- —
- DSCR
- —
- Eligible?
- —
Short-term bridge; refi at stabilization.
Rent comps 12 comps
| Address | Beds | Baths | Sqft | Rent | $/sqft | DOM | Units | Dist |
|---|---|---|---|---|---|---|---|---|
| 1 Hemlock Dr Unit C152 Bay Shore, NY | 2.0 | 1.0 | 707 | $2,550 | $3.61 | 24d | 1 | 0.10mi |
| 1158 Nugent Ave Bay Shore, NY | 1.0 | 1.0 | 700 | $1,800 | $2.57 | 24d | 1 | 0.60mi |
| 1077 Martinstein Ave Bay Shore, NY | 2.0 | 1.0 | 650 | $2,500 | $3.85 | 43d | 1 | 1.07mi |
| 1731 N Gardiner Dr Unit 5A Bay Shore, NY | 2.0 | 1.0 | 625 | $2,695 | $4.31 | 43d | 1 | 1.10mi |
| 1737 N Gardiner Dr Unit DRIVE-22B Bay Shore, NY | 2.0 | 1.0 | 625 | $2,695 | $4.31 | 43d | 1 | 1.11mi |
| 1739 N Gardiner Dr Unit 19B Bay Shore, NY | 2.0 | 1.0 | 625 | $2,750 | $4.40 | 43d | 1 | 1.12mi |
| 1741 N Gardiner Dr Unit 14B Bay Shore, NY | 2.0 | 1.0 | 625 | $2,695 | $4.31 | 43d | 1 | 1.12mi |
| 1743 N Gardiner Dr Unit 12B Bay Shore, NY | 2.0 | 1.0 | 625 | $2,695 | $4.31 | 43d | 1 | 1.13mi |
| 17 Chimney Ln Bay Shore, NY | 2.0 | 1.0 | 900 | $2,200 | $2.44 | 21d | 1 | 1.13mi |
| 55 Pinebrook Pl Bay Shore, NY | 1.0 | 1.0 | 835 | $2,275 | $2.72 | 43d | 1 | 1.39mi |
| 31 Newbrook Ln Unit 31 Bay Shore, NY | 1.0 | 1.0 | 900 | $2,300 | $2.56 | 43d | 1 | 1.39mi |
| 85 Newbrook Ln Unit 85N Bay Shore, NY | 1.0 | 1.0 | 800 | $2,300 | $2.88 | 43d | 1 | 1.44mi |
Listing history 5 events
-
2026-04-04status Pending
-
2026-03-24$219,000 Active
-
2024-09-14historical $2,000
-
2024-09-06price $2,000
-
2024-08-25$2,200
ⓘ Source: listings_history table (triggers on properties + properties_extension) + one-shot
backfill from property_details.listing_events for pre-trigger history.
Climate risk First Street
- Flood 1/10 Low FEMA zone X (unshaded) · 0% chance over 30 yrs
- Wildfire 1/10 Low
- Heat 5/10 Major 7 d/yr ≥94°F today · 16 d/yr by 30 yrs out
- Wind 6/10 Major 61% chance of damaging wind over 30 yrs
- Air quality 4/10 Moderate 4 unhealthy d/yr today · 6 by 30 yrs out
Nearby sold comps map
Loading sold comps map…
Walkable amenities ~0.75 mi
Loading nearby amenities…
Taxation est. · year 1
- Rental income
- $29,176
- − Mortgage interest
- −$12,267
- − Property taxes
- −$3,285
- − Insurance
- −$1,095
- − Repairs & maintenance
- −$2,334
- − Management
- −$2,334
- − Depreciation
- −$6,371
- Taxable income
- $1,489
- Est. tax owed @ 24.0%
- −$357
- After-tax cash flow
- $4,530/yr
For passive investors: Depreciation is non-cash, so a rental often shows a tax loss while cash-flowing — sheltering income. Rental losses are passive: they offset passive income freely, and up to $25,000/yr can offset ordinary (W-2) income if you actively participate and your MAGI is under $100k (phasing out to $0 by $150k); unused losses carry forward. On sale, claimed depreciation is recaptured at up to 25%, and gains may owe capital-gains tax (a 1031 exchange can defer both). Figures are a year-1 estimate at your 24.0% rate — not tax advice; consult a CPA.
Condition & rehab AI · 8 photos
The property requires moderate renovations to improve its curb appeal and interior aesthetics, which can significantly increase its value for both resale and rental purposes.
Repairs flagged
- Minor Kitchen cabinets — Aesthetic update needed to modernize the space.
- Minor Bathroom fixtures — Update to fixtures for a more modern look.
- Moderate Landscaping — Landscaping needs a refresh to improve curb appeal.
Value-add opportunities
- Both Painting exterior and interior — Fresh paint can significantly improve the home's curb appeal and interior aesthetics.
- Both Updating kitchen cabinets and countertops — Modernizing the kitchen can increase both resale and rental value.
- Both Updating bathroom fixtures and tiling — Modernizing the bathroom can enhance both resale and rental appeal.
Renovation cost estimate screening
| Repair item | Severity | Est. cost |
|---|---|---|
| Kitchen cabinets · Aesthetic update needed to modernize the space. | Minor | $500–3,000 |
| Bathroom fixtures · Update to fixtures for a more modern look. | Minor | $500–3,000 |
| Landscaping · Landscaping needs a refresh to improve curb appeal. | Moderate | $3,000–15,000 |
| Total estimated repair cost · 3 items | $4,000–21,000 |
Value-add ROI direction
- Both Painting exterior and interior — Fresh paint can significantly improve the home's curb appeal and interior aesthetics. ↑
- Both Updating kitchen cabinets and countertops — Modernizing the kitchen can increase both resale and rental value. ↑
- Both Updating bathroom fixtures and tiling — Modernizing the bathroom can enhance both resale and rental appeal. ↑
ⓘ Cost ranges are severity-bucket heuristics (US national rule-of-thumb). Get contractor quotes + a written scope before underwriting a rehab budget.
Schools (NCES district)
- District
- Brentwood Union Free School District
- NCES district ID
- 3605280
- Math proficiency
- 35% ▼ -8.00%
- Reading proficiency
- 35% ▼ -3.00%
- Median HH income
- $71,840
- Composite
- 32.44/100
- National rank
- #5722
- State rank
- #542 of 590 in NY
Livability — North Bay Shore
- Score
- 65/100
- State rank
- #678
- US rank
- #12701
Category grades
Schools grade is shown separately in the Schools card above.
Census & demographics
- Census place
- North Bay Shore, NY
- County
- Suffolk County · 679,920 people
- Metro
- New York-Newark-Jersey City, NY-NJ-PA
- Population (ZIP)
- 68,976
- Household income
- $119,603
- Rent vs Own
- Severe rent burden
- 1516.0
Population outlook (Suffolk County) Hauer SSP2
- Today (2025)
- 1,505,262 people
- By 2030
- 1,498,318 · -0.5%
- By 2040
- 1,471,101 · -2.3%
- By 2050
- 1,424,848 · -5.3%
- By 2075
- 1,337,157 · -11.2%
- By 2100
- 1,217,720 · -19.1%
Race, ethnicity, and origin ACS 2023
- Neighborhood character
- Diverse neighborhood (Simpson 0.67)
- Race & ethnicity
- Hispanic / Latino 46% White 33% Two or more races 13% Black 11% Asian 6%
- Hispanic origin (detail)
- Mexican 1% Puerto Rican 8% Dominican 5%
- Common ancestry
- Romanian 2% Hispanic 2% Italian 1%
- Foreign-born
- 32% · Canada, Jamaica
- Languages at home
- 52% English-only · Spanish 38% Other Indo-European 6% French/Haitian/Cajun 2%
Political lean MEDSL · Suffolk
- 2024 margin
- Lean R (+10.0) · D 45.0% · R 55.0%
- 2008→2024 swing
- -16.0pp toward R · 2008: 6.0pp · 2024: -10.0pp
- All cycles
- 2024: R+10.0 2020: R+0.0 2016: R+8.2 2012: D+2.9 2008: D+6.0
Not yet ingested
- Civics
- —
Market trends
- HPI YoY
- ▼ -723.52%
- Current HPI
- 311.4019
- Rent YoY
- ▲ 2.37%
- Metro
- New York-Newark-Jersey City, NY-NJ-PA
- State GDP YoY
- ▲ 2.60%
- F500 in state
- 92
Industry mix (Fortune 500 HQ in NY)
| Industry | F500 HQs | Revenue |
|---|---|---|
| Financial Services | 10 | $950B |
|
||
| Consumer Goods | 9 | $162B |
|
||
| Insurance | 4 | $225B |
|
||
| Telecommunications | 2 | $144B |
|
||
| Pharmaceuticals | 2 | $112B |
|
||
| Media / Entertainment | 2 | $69B |
|
||
Price history
+9854.5% since first listed5 events — show timeline
- 2026-04-04 Pending — OneKey® MLS as Distributed by MLS Grid
- 2026-03-24 Listed $219,000 OneKey® MLS as Distributed by MLS Grid
- 2024-09-14 Rental Removed $2,000 ONEKEY
- 2024-09-06 Price Changed $2,000 ONEKEY
- 2024-08-25 Listed for Rent $2,200 ONEKEY
Cash-flow waterfall
monthlySold comps — $/sqft
last 12 mo · ≤1 miLoading sold comps…