None · Midwest City, OK
Flood risk 1/10 · Minimal
- FEMA flood zone
- X (unshaded)
- Chance of flooding over 30 yrs
- 0.0%
- Est. flood insurance / yr
- $507 – $1,088
Fire risk 1/10 · Minimal
- Est. fire insurance / yr
- $2,463 – $4,575
Heat risk 5/10 · Moderate
- Hot days now (above 107°F)
- 7 days/yr
- Hot days in 30 yrs
- 18 days/yr
Wind risk 2/10 · Minimal
- Chance of severe wind over 30 yrs
- 4.0%
Air-quality risk 2/10 · Minimal
- Unhealthy air days now
- 1 days/yr
- Unhealthy air days in 30 yrs
- 3 days/yr
Risk factors via First Street. Map © Google.
Why this score? — see what drove the B+ grade
The composite is a weighted blend of 9 inputs, each scored 0–100. Each bar is that input's sub-score; the figure is the points it added to the 100-point composite (weight × sub-score).
- Cash flow +30.0/30.0
- ARV discount +15.0/15.0
- 1% rule +10.0/10.0
- DSCR +10.0/10.0
- Livability +3.6/5.0
- Rent growth +3.2/5.0
- Condition / age +2.5/5.0
- Schools +1.2/10.0
- Appreciation +0.0/10.0
$55,000
🖨 Deal sheet (PDF) 📄 Offer letter ✓ Due diligence
Listing remarks MLS
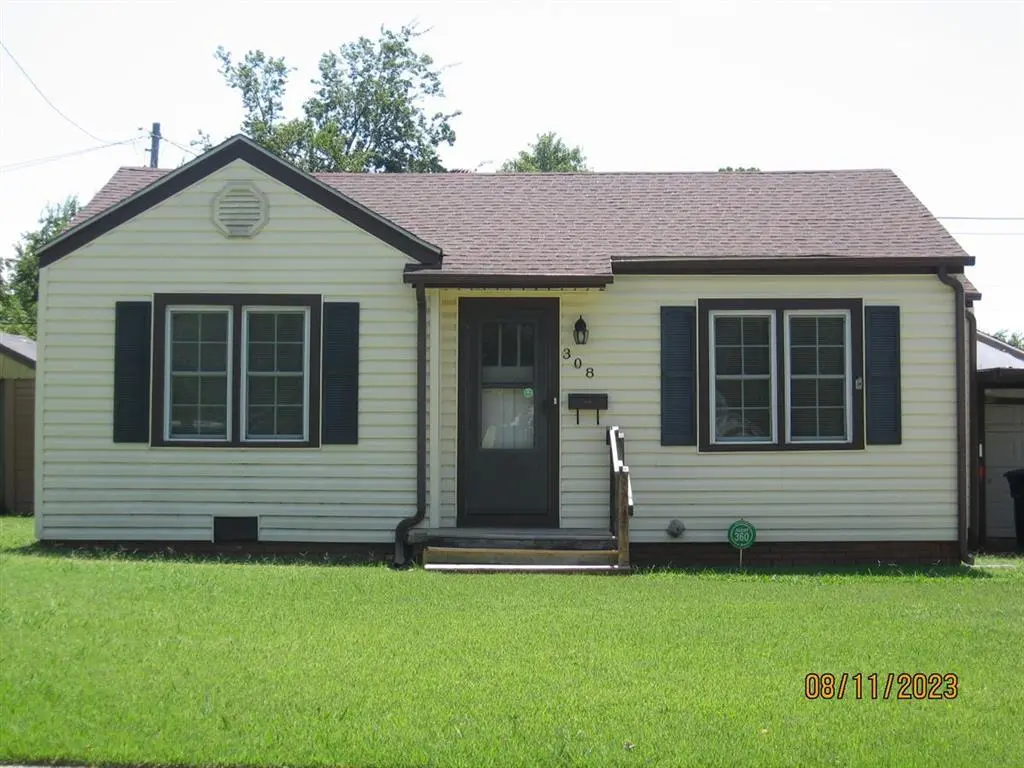
The garden has been planted and is ready for your tender care. Beautiful landscaping and great covered deck on this cute 2 bed home. Kitchen has tile floors and seller is leaving washer/dryer/refrigerator. In 2009 seller replaced vinyl siding, windows (all but 2 small ones in bath/kitch), 2.5 ton H/A, dishwasher, stove, sink/commode in bathroom.Single car garage plus single car carport. This maintainance free home is ready for the new owner.
Key facts
- 7,632 sq ft lot
- Garage
- Built 1945
Property features AI
Finance
- Other: Flood insurance required; Homestead not claimed
- Financial info: Cash-only listing; Not assumable
- HOA & community: No mandatory association dues
Exterior
- Parking: Concrete parking; 1-car garage
- Utilities: Public utilities; Storm doors and storm windows
- Home design: Single-family residence; One story; North-facing
- Construction: Vinyl siding; Composition roof; Conventional foundation; Existing property
- Exterior features: Covered deck; Covered porch; Interior lot; Combination fencing
Interior
- Kitchen: Dishwasher; Disposal; Refrigerator; Free-stand electric range/oven
- Bedrooms: 2 bedrooms
- Flooring: Combination flooring
- Bathrooms: 1 full bathroom
- Interior features: Window treatments
- Laundry & utility: Washer and dryer included
Neighborhood map
What this means for you Summary
Snapshot
- This is a 2-bed/1.0-bath single-family listed at $55k.
Deal economics
- At list price, monthly cash flow is $349 ($4k/yr) — positive.
- The deal already cash-flows at list — no discount required.
- Meets the 1% rule at list price ($920 rent vs $55k).
- Cap rate 13.9% vs local median 5.6% in Midwest City — top-decile yield for the area; either an underpriced asset or a hidden risk that comps aren't pricing in. Stress-test before assuming the spread holds.
Location & tenants
- Location reads 71/100 on livability (#30 in OK) — a middle-class / working-renter tenant base. Strengths: cost of living A+, housing A+, health & safety A; Watch: crime D+, employment D, amenities F.
- Midwest City-Del City (suburban): math 10% / reading 17% proficiency, ranked #231 of 270 in OK (top 86%) — low school quality limits family demand, transient renter base, plan for 1-2y turnover.
- Zoned schools: Midwest City Es (math 13% / reading 13%, grade F, #647 of 845 statewide, top 77%, 793 students, 0% FRL); Midwest City Hs (math 7% / reading 17%, grade F, #359 of 447 statewide, top 80%, 1,368 students, 0% FRL) — zoned schools average 0% FRL vs 57% district-wide (57 pts lower); this property's tenant base skews higher-income than the district average.
- Market conditions: Rents rising (+3.0%/yr); 173 active listings in the ZIP; 12 comparable units currently listed for rent nearby; rentals at typical pace (median 19d on market — plan ~3-4 weeks tenant-placement turnaround); 5,365 units permitted in Oklahoma County in 2024 (569 in 5+ unit buildings).
Forward outlook
- Local home prices are declining (-3.0%/yr); year-one equity from $380 of loan paydown is wiped out by about $2k of value loss. Plan a longer hold.
- Oklahoma County population projected at +41% by 2050 — long-run rental-demand tailwind backs the buy-and-hold thesis.
- At projected returns (-3.0% appreciation + 3.0% rent growth), your $15k cash investment doubles in ~5 years — after that, you're playing with house money.
Negotiation context
- Only 1 days on market — expect competitive offers; lowballing is unlikely to land.
- 2 sale attempts since 15y ago with the ask held roughly flat each time — persistent listings suggest the price (not the market) is what's stuck; bring a comps-based counter.
Risks & watch-outs
- Watch-outs: built in 1945 — expect roof / HVAC / electrical / plumbing capex.
- Climate carrying-cost: extreme-heat days projected 7→18/yr by 2055 (HVAC capex compounding) — expect insurance premiums to compound above CPI over the hold.
Questions for the listing agent
- Built in 1945 — when were the roof, HVAC, electrical panel, plumbing, and water heater last replaced?
- Is there a deadline driving the sale (1031 exchange, divorce, estate, relocation)? That informs how much negotiation room exists.
- Schools are D-rated, which usually means shorter tenancies and higher turnover. Who's the typical renter profile here, and what's been the actual vacancy rate?
- Crime grade is D in this area — have there been break-ins, vandalism, or insurance claims at this property in the last 3 years? What carrier currently insures it and at what premium?
- What's the average days-on-market for RENTAL listings here right now (not sales)? A rising rental-DOM trend means longer vacancies and softer asking-rent achievability than the comps imply.
- What's the recent tenant-quality profile in this submarket — average credit score on applications, eviction rate, late-payment / NSF rate, and stable-employment percentage? A property-management company in the area should have these aggregated.
- How much new for-sale + rental construction is in the pipeline within 1–3 miles? Heavy new supply typically softens prices + rents 12–24 months out; constrained supply supports both.
Investment metrics
- 1% rule
- 1.67% ✓
- Cap rate
- 13.90%
- Cash-on-cash
- 27.18%
- DSCR
- 2.21
- GRM
- 5.0
CMA / ARV
- ARV (on-the-fly)
- $97,548
- Comps found
- 12
Show comp detail 12 sales within ~0.75 mi
| Address | Dist | Beds/Ba | Sqft | Sold | Price | $/sf | Match |
|---|---|---|---|---|---|---|---|
| 504 E Rickenbacker Dr | 0.12mi | 2/1.0 | 769 (+4%) | 7mo | $75,000 | $98 | 82 |
| 413 N Marshall Dr | 0.13mi | 2/1.0 | 796 (+8%) | 2mo | $80,000 | $101 | 79 |
| 608 W Rickenbacker Dr | 0.44mi | 2/1.0 | 735 (-0%) | 7mo | $115,000 | $156 | 73 |
| 422 Monroney Dr | 0.39mi | 3/1.0 (+1) | 720 (-3%) | 1mo | $129,000 | $179 | 72 |
| 507 N Key Blvd | 0.18mi | 2/1.0 | 837 (+13%) | 1mo | $80,000 | $96 | 68 |
| 314 W Marshall Dr | 0.65mi | 2/1.0 | 736 (-0%) | 2mo | $50,000 | $68 | 68 |
| 7212 SE 15th St | 0.67mi | 2/1.0 | 735 (-0%) | 2mo | $103,000 | $140 | 66 |
| 313 W Peach St | 0.74mi | 2/1.0 | 724 (-2%) | 1mo | $80,000 | $110 | 62 |
| 220 W Ercoupe Dr | 0.49mi | 2/1.0 | 816 (+10%) | 0mo | $118,000 | $145 | 60 |
| 533 E Boeing Dr | 0.41mi | 2/1.0 | 819 (+11%) | 6mo | $60,000 | $73 | 58 |
| 7111 SE 15th St | 0.74mi | 2/1.0 | 756 (+2%) | 5mo | $100,000 | $132 | 57 |
| 544 E Northrup Dr | 0.57mi | 2/1.0 | 835 (+13%) | 5mo | $142,000 | $170 | 48 |
Match score weights: distance 35% · size 25% · config 20% · recency 20%. Top-matched comps best support the ARV.
Projected returns pro-forma
-3.0% appreciation · 2.99% rent growth · sell at horizon
- IRR
- 21.1%
- Equity multiple
- 1.86×
- Total profit
- $13,303
- Equity at exit
- $8,201
- IRR
- 29.3%
- Equity multiple
- 3.61×
- Total profit
- $40,200
- Equity at exit
- $4,755
Cash invested: $15,400 (down + closing). Projections, not guarantees.
Landlord ↔ Tenant lean methodology
- Overall (STATE)
- 83 Strongly Landlord-Friendly
- State Oklahoma
- 83 Strongly Landlord-Friendly · R+20
- County
- — inherits STATE
- City
- — inherits STATE
ZIP-level market 73110
- Rents YoY
- 3.0%
- Active inventory
- 173
- Price-to-rent
- 5.0×
Monthly cashflow live
- Estimated rent
- $920 high interval (Pro) →
- Mortgage (P&I)
- −$288
- Tax from tax record
- −$67 /mo · $803/yr
- Insurance
- −$23
- HOA
- −$0
- Vacancy / Maint / Mgmt
- −$193
- Net cashflow
- $349
Break-even live
Sensitivity live
| Price | -10% $380 | -5% $364 | +0% $349 | +5% $333 | +10% $318 |
|---|---|---|---|---|---|
| Rent | -10% $276 | -5% $312 | +0% $349 | +5% $385 | +10% $421 |
| Rate | -1.0pp $376 | -0.5pp $363 | base $349 | +0.5pp $334 | +1.0pp $320 |
UW: 25.0% down · 7.5% · 30yr · 1.5% tax · 5.0% vac · 8.0% maint · 8.0% mgmt
Financing live
Cash to close
- Down payment
- $13,750
- Closing costs
- $1,650
- Reserves months
- —
- Total cash needed
- —
Loan-product check · same deal, 3 products live
Conventional
25% down · 7.5% · 30yr
- Down + closing
- —
- Monthly P&I
- —
- Monthly cashflow
- —
- DSCR
- —
- Eligible?
- —
Personal DTI + credit; lowest rate.
DSCR
20% down · 8.5% · 30yr
- Down + closing
- —
- Monthly P&I
- —
- Monthly cashflow
- —
- DSCR
- —
- Eligible?
- —
No personal income docs; deal must DSCR.
Hard money
10% down · 12.0% · 12mo
- Down + closing
- —
- Monthly P&I
- —
- Monthly cashflow
- —
- DSCR
- —
- Eligible?
- —
Short-term bridge; refi at stabilization.
Rent comps 12 comps
| Address | Beds | Baths | Sqft | Rent | $/sqft | DOM | Units | Dist |
|---|---|---|---|---|---|---|---|---|
| 810 N Marshall Dr Midwest City, OK | 1.0 | 1.0 | 686 | $875 | $1.28 | 22d | 1 | 0.30mi |
| 705 N key Blvd Midwest City, OK | 1.0 | 1.0 | 700 | $795 | $1.14 | 25d | 1 | 0.30mi |
| 417 Babb Dr Midwest City, OK | 1.0 | 1.0 | 640 | $700 | $1.09 | 14d | 1 | 0.34mi |
| 305 Babb Dr Oklahoma City, OK | 1.0 | 1.0 | 625 | $825 | $1.32 | 6d | 1 | 0.34mi |
| 538 E Indian Dr Oklahoma City, OK | 2.0 | 1.0 | 739 | $895 | $1.21 | 0d | 1 | 0.36mi |
| 538 E Indian Dr Oklahoma City, OK | 2.0 | 1.0 | 739 | $920 | $1.24 | 23d | 1 | 0.36mi |
| 901 N Key Blvd Oklahoma City, OK | 1.0 | 1.0 | 620 | $600 | $0.97 | 16d | 1 | 0.39mi |
| 315 W Lilac Ln Oklahoma City, OK | 2.0 | 1.0 | 708 | $995 | $1.41 | 0d | 1 | 0.63mi |
| 314 W Peach St Midwest City, OK | 2.0 | 1.0 | 736 | $950 | $1.29 | 25d | 1 | 0.72mi |
| 313 W Peach St Oklahoma City, OK | 2.0 | 1.0 | 724 | $975 | $1.35 | 19d | 1 | 0.73mi |
| 677 Midtown Pl Midwest City, OK | 1.0–2.0 | 1.0–2.0 | 770 | $1,450 | $1.88 | 0d | 1 | 1.39mi |
| 2212 Felix Pl Midwest City, OK | 1.0 | 1.0 | 650 | $645 | $0.99 | 25d | 1 | 1.45mi |
Listing history 6 events
-
2026-05-19status Pending
-
2026-05-13$55,000 Active
-
2011-06-16soldstatus $53,500
-
2011-06-10soldstatus $53,500 446-char remark
Show marketing remark (446 chars)
The garden has been planted and is ready for your tender care. Beautiful landscaping and great covered deck on this cute 2 bed home. Kitchen has tile floors and seller is leaving washer/dryer/refrigerator. In 2009 seller replaced vinyl siding, windows (all but 2 small ones in bath/kitch), 2.5 ton H/A, dishwasher, stove, sink/commode in bathroom.Single car garage plus single car carport. This maintainance free home is ready for the new owner.
-
2011-05-06$54,900 446-char remark
Show marketing remark (446 chars)
The garden has been planted and is ready for your tender care. Beautiful landscaping and great covered deck on this cute 2 bed home. Kitchen has tile floors and seller is leaving washer/dryer/refrigerator. In 2009 seller replaced vinyl siding, windows (all but 2 small ones in bath/kitch), 2.5 ton H/A, dishwasher, stove, sink/commode in bathroom.Single car garage plus single car carport. This maintainance free home is ready for the new owner.
-
1997-09-08soldstatus $40,000
ⓘ Source: listings_history table (triggers on properties + properties_extension) + one-shot
backfill from property_details.listing_events for pre-trigger history.
Tax reassessment forecast OK · Resets to sale price
- Current annual tax
- $803 · $67/mo
- Projected year-2 tax
- $803 · $67/mo
- Expected delta
- $0/yr ($0/mo · 0.0%)
ⓘ Screening estimate from a state-policy table — verify with the county assessor before closing.
Climate risk First Street
- Flood 1/10 Low FEMA zone X (unshaded) · 0% chance over 30 yrs
- Wildfire 1/10 Low
- Heat 5/10 Major 7 d/yr ≥107°F today · 18 d/yr by 30 yrs out
- Wind 2/10 Low 4% chance of damaging wind over 30 yrs
- Air quality 2/10 Low 1 unhealthy d/yr today · 3 by 30 yrs out
Nearby sold comps map
Loading sold comps map…
Walkable amenities ~0.75 mi
Loading nearby amenities…
Taxation est. · year 1
- Rental income
- $11,043
- − Mortgage interest
- −$3,081
- − Property taxes
- −$803
- − Insurance
- −$275
- − Repairs & maintenance
- −$883
- − Management
- −$883
- − Depreciation
- −$1,600
- Taxable income
- $3,517
- Est. tax owed @ 24.0%
- −$844
- After-tax cash flow
- $3,341/yr
For passive investors: Depreciation is non-cash, so a rental often shows a tax loss while cash-flowing — sheltering income. Rental losses are passive: they offset passive income freely, and up to $25,000/yr can offset ordinary (W-2) income if you actively participate and your MAGI is under $100k (phasing out to $0 by $150k); unused losses carry forward. On sale, claimed depreciation is recaptured at up to 25%, and gains may owe capital-gains tax (a 1031 exchange can defer both). Figures are a year-1 estimate at your 24.0% rate — not tax advice; consult a CPA.
Schools (NCES district)
- District
- Midwest City-Del City
- NCES district ID
- 4019950
- Math proficiency
- 10% ▼ -11.00%
- Reading proficiency
- 17% ▼ -8.00%
- Median HH income
- $45,724
- Composite
- 12.09/100
- National rank
- #9658
- State rank
- #231 of 270 in OK
Livability — Midwest City
- Score
- 71/100
- State rank
- #30
- US rank
- #6637
Category grades
Schools grade is shown separately in the Schools card above.
Census & demographics
- Census place
- Midwest City, OK
- County
- Oklahoma County · 771,644 people
- City population
- 57,386
- Metro
- Oklahoma City, OK
- Population (ZIP)
- 32,348
- Household income
- $51,228
- Rent vs Own
- Severe rent burden
- 1440.0
Population outlook (Oklahoma County) Hauer SSP2
- Today (2025)
- 911,875 people
- By 2030
- 982,413 · +7.7%
- By 2040
- 1,130,468 · +24.0%
- By 2050
- 1,288,422 · +41.3%
- By 2075
- 1,711,482 · +87.7%
- By 2100
- 2,088,448 · +129.0%
Race, ethnicity, and origin ACS 2023
- Neighborhood character
- Diverse neighborhood (Simpson 0.63)
- Race & ethnicity
- White 55% Black 25% Two or more races 11% Hispanic / Latino 7% Native American 4% Asian 1%
- Hispanic origin (detail)
- Mexican 5%
- Common ancestry
- Lithuanian 2% Slovak 1% Serbian 1%
- Foreign-born
- 3% · Canada, Vietnam
- Languages at home
- 95% English-only · Spanish 3%
Political lean MEDSL · Oklahoma
- 2024 margin
- Toss-up / Even · D 48.0% · R 49.7% · Other 2.3%
- 2008→2024 swing
- +15.1pp toward D · 2008: -16.8pp · 2024: -1.7pp
- All cycles
- 2024: R+1.7 2020: R+1.1 2016: R+10.5 2012: R+16.7 2008: R+16.8
Not yet ingested
- Civics
- —
Market trends
- HPI YoY
- ▼ -156.25%
- Current HPI
- 257.0791
- Rent YoY
- ▲ 2.99%
- Metro
- Oklahoma City, OK
- State GDP YoY
- ▲ 1.55%
- F500 in state
- 6
Industry mix (Fortune 500 HQ in OK)
| Industry | F500 HQs | Revenue |
|---|---|---|
| Energy | 3 | $48B |
|
||
Price history
+37.5% since first listed6 events — show timeline
- 2026-05-19 Pending — MLSOK
- 2026-05-13 Listed $55,000 MLSOK
- 2011-06-16 Sold (Public Records) $53,500 Public Records
- 2011-06-10 Sold (MLS) $53,500 MLSOK
- 2011-05-06 Listed $54,900 MLSOK
- 1997-09-08 Sold (Public Records) $40,000 Public Records
Property tax history
+2.8%/yrLatest (2025): $803 · +1.0% YoY. Source: county tax records.
Cash-flow waterfall
monthlySold comps — $/sqft
last 12 mo · ≤1 miLoading sold comps…