1000 Windy Pass #104 · Barstow, CA
Flood risk 1/10 · Minimal
- FEMA flood zone
- X (unshaded)
- Chance of flooding over 30 yrs
- 0.0%
- Est. flood insurance / yr
- $507 – $1,088
Fire risk 4/10 · Minor
- Est. fire insurance / yr
- $659 – $1,223
Heat risk 8/10 · Major
- Hot days now (above 103°F)
- 3 days/yr
- Hot days in 30 yrs
- 10 days/yr
Wind risk 1/10 · Minimal
- Chance of severe wind over 30 yrs
- —
Air-quality risk 6/10 · Moderate
- Unhealthy air days now
- 11 days/yr
- Unhealthy air days in 30 yrs
- 15 days/yr
Risk factors via First Street. Map © Google.
Why this score? — see what drove the B- grade
The composite is a weighted blend of 9 inputs, each scored 0–100. Each bar is that input's sub-score; the figure is the points it added to the 100-point composite (weight × sub-score).
- Cash flow +30.0/30.0
- 1% rule +10.0/10.0
- DSCR +10.0/10.0
- ARV discount +7.5/15.0
- Livability +3.2/5.0
- Rent growth +3.1/5.0
- Condition / age +2.2/5.0
- Schools +1.4/10.0
- Appreciation +0.0/10.0
$50,000
🖨 Deal sheet (PDF) 📄 Offer letter ✓ Due diligence
Listing remarks MLS
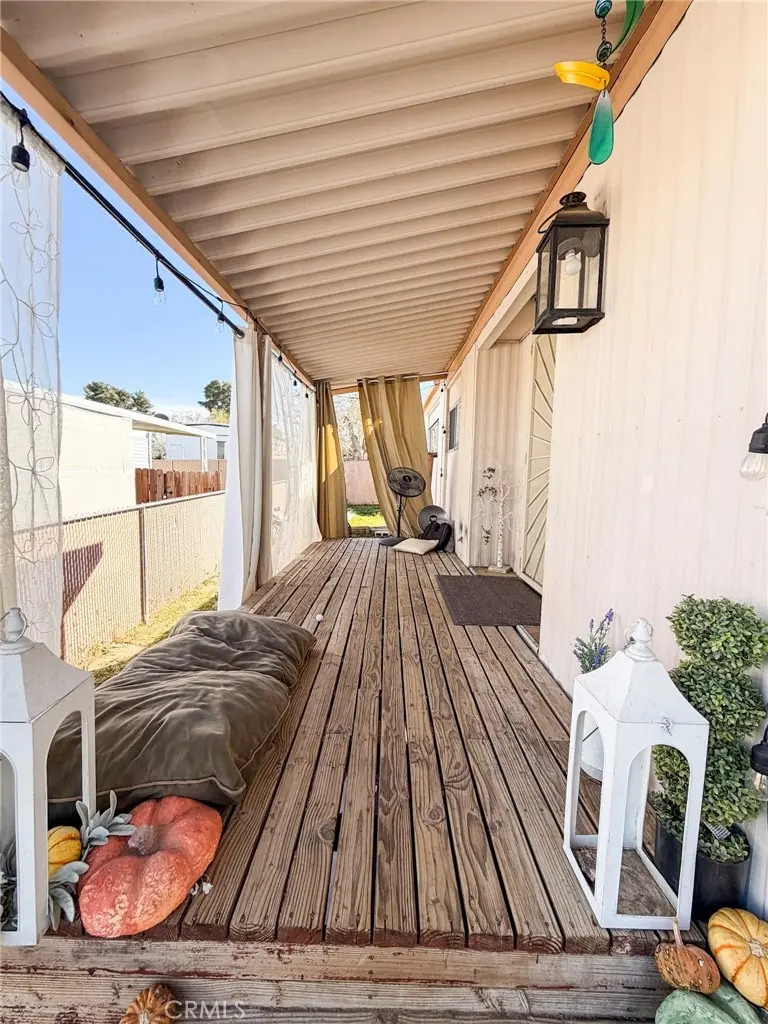
Welcome to this charming and affordable mobile home located in a well-maintained manufactured home park in the heart of Barstow, CA! Centrally situated, this home offers convenient access to shopping centers, local schools, dining options, and easy freeway connections—making daily commutes and errands simple and stress-free. Step inside to discover a fresh, inviting interior featuring newly painted walls and newer flooring throughout, giving the home a clean and modern feel. The open living area provides a comfortable space to relax or entertain, while the efficient layout maximizes functionality and flow. Additional highlights include ample natural light, generous storage, and low-maintenance living. The home’s attractive price point makes it an excellent opportunity for first-time home buyers ready to step into homeownership, or for investors seeking a solid rental property with strong potential. Affordable, updated, and centrally located—this is a fantastic opportunity you won’t want to miss!
Key facts
- Newly painted walls
- Ample natural light
- Newer flooring
Tags
Neighborhood map
What this means for you Summary
Snapshot
- This is a 3-bed/2.0-bath manufactured listed at $50k. Condition is rated fair.
Deal economics
- At list price, monthly cash flow is $1k ($14k/yr) — positive.
- The deal already cash-flows at list — no discount required.
- Meets the 1% rule at list price ($2k rent vs $50k).
- Recommended offer: $46k (9.0% below list) — sets the bar for market timing.
- Cap rate 34.5% vs local median 4.5% in Barstow — top-decile yield for the area; either an underpriced asset or a hidden risk that comps aren't pricing in. Stress-test before assuming the spread holds.
Location & tenants
- Location reads 63/100 on livability (#444 in CA) — a middle-class / working-renter tenant base. Strengths: commute A+, housing A+; Watch: amenities C-, health & safety C-, crime F.
- Barstow Unified (town): math 11% / reading 22% proficiency, ranked #482 of 517 in CA (top 93%) — low school quality limits family demand, transient renter base, plan for 1-2y turnover; 68% free/reduced lunch — lower-income household profile, screen leases tightly.
- Zoned schools: Crestline Elementary (math 2% / reading 2%, grade F, #1,571 of 1,571 statewide, top 100%, 477 students, 89% FRL); Barstow Junior High (math 4% / reading 13%, grade F, #495 of 498 statewide, top 100%, 742 students, 80% FRL); Barstow High (math 22% / reading 47%, grade F, #618 of 1,170 statewide, top 56%, 1,584 students, 67% FRL).
- Market conditions: Rents rising (+2.3%/yr); 349 active listings in the ZIP; 11 comparable units currently listed for rent nearby; rentals at typical pace (median 26d on market — plan ~3-4 weeks tenant-placement turnaround); 5,458 units permitted in San Bernardino County in 2024 (1,500 in 5+ unit buildings).
- This rent runs 37% of the median local income ($62k/yr) — at the standard rent-burdened threshold; future hikes will face affordability resistance.
Forward outlook
- Local home prices are declining (-3.0%/yr); year-one equity from $346 of loan paydown is wiped out by about $2k of value loss. Plan a longer hold.
- San Bernardino County population projected at +15% by 2050 — modest demand growth; plan on rents tracking national, not racing it.
- At projected returns (-3.0% appreciation + 2.3% rent growth), your $14k cash investment doubles in ~2 years — after that, you're playing with house money.
Negotiation context
- It's been on market 110 days — a 9% lower offer ($46k) is reasonable based on typical stale-listing flexibility.
Risks & watch-outs
- Climate carrying-cost: extreme-heat days projected 3→10/yr by 2055 (HVAC capex compounding) — expect insurance premiums to compound above CPI over the hold.
Questions for the listing agent
- It's been on market 110 days. Have you received any prior offers? Is the seller open to a 9% concession, seller financing, or rate buy-down credit?
- Have any recent inspections been done? Can we get a copy of the seller's disclosures and any deferred-maintenance estimates?
- Built in 1969 — when were the roof, HVAC, electrical panel, plumbing, and water heater last replaced?
- Why hasn't it sold? Are there any deal-killer items the seller is aware of (foundation, flood, title, zoning, code violations)?
- Is there a deadline driving the sale (1031 exchange, divorce, estate, relocation)? That informs how much negotiation room exists.
- Schools are F-rated, which usually means shorter tenancies and higher turnover. Who's the typical renter profile here, and what's been the actual vacancy rate?
- Crime grade is F in this area — have there been break-ins, vandalism, or insurance claims at this property in the last 3 years? What carrier currently insures it and at what premium?
- What's the average days-on-market for RENTAL listings here right now (not sales)? A rising rental-DOM trend means longer vacancies and softer asking-rent achievability than the comps imply.
- What's the recent tenant-quality profile in this submarket — average credit score on applications, eviction rate, late-payment / NSF rate, and stable-employment percentage? A property-management company in the area should have these aggregated.
- How much new for-sale + rental construction is in the pipeline within 1–3 miles? Heavy new supply typically softens prices + rents 12–24 months out; constrained supply supports both.
Investment metrics
- 1% rule
- 3.85% ✓
- Cap rate
- 34.46%
- Cash-on-cash
- 100.61%
- DSCR
- 5.48
- GRM
- 2.2
CMA / ARV
- ARV (median comp)
- $24,665
- List price
- $50,000
- Delta
- 102.72%
- Verdict
- OVERPRICED
- Comps
- 3 within 1.0 mi
Show comp detail 4 sales within ~0.75 mi
| Address | Dist | Beds/Ba | Sqft | Sold | Price | $/sf | Match |
|---|---|---|---|---|---|---|---|
| 1000 Windy Pass #82 | 0.00mi | 3/2.0 | 1,440 (-4%) | 9mo | $59,000 | $41 | 86 |
| 1000 Windy Pass #95 | 0.00mi | 2/2.0 (-1) | 1,440 (-4%) | 6mo | $25,000 | $17 | 83 |
| 1000 Windy Pass #156 | 0.10mi | 3/2.0 | 1,440 (-4%) | 11mo | $23,500 | $16 | 79 |
| 600 E Rimrock Rd #26 | 0.56mi | 2/2.0 (-1) | 1,344 (-10%) | 13mo | $20,000 | $15 | 41 |
Match score weights: distance 35% · size 25% · config 20% · recency 20%. Top-matched comps best support the ARV.
Projected returns pro-forma
-3.0% appreciation · 2.32% rent growth · sell at horizon
- IRR
- —
- Equity multiple
- 5.67×
- Total profit
- $65,381
- Equity at exit
- $7,455
- IRR
- —
- Equity multiple
- 11.57×
- Total profit
- $148,026
- Equity at exit
- $4,323
Cash invested: $14,000 (down + closing). Projections, not guarantees.
Landlord ↔ Tenant lean methodology
- Overall (STATE)
- 18 Strongly Tenant-Friendly
- State California
- 18 Strongly Tenant-Friendly · D+13
- County
- — inherits STATE
- City
- — inherits STATE
ZIP-level market 92311
- Home prices YoY
- -30.6%
- Rents YoY
- 2.3%
- Active inventory
- 349
- Price-to-rent
- 2.2×
Monthly cashflow live
- Estimated rent
- $1,923 high interval (Pro) →
- Mortgage (P&I)
- −$262
- Tax est. 1.5%
- −$62 /mo · $750/yr
- Insurance
- −$21
- HOA
- −$0
- Vacancy / Maint / Mgmt
- −$404
- Net cashflow
- $1,174
Break-even live
Sensitivity live
| Price | -10% $1,208 | -5% $1,191 | +0% $1,174 | +5% $1,157 | +10% $1,139 |
|---|---|---|---|---|---|
| Rent | -10% $1,022 | -5% $1,098 | +0% $1,174 | +5% $1,250 | +10% $1,326 |
| Rate | -1.0pp $1,199 | -0.5pp $1,187 | base $1,174 | +0.5pp $1,161 | +1.0pp $1,148 |
UW: 25.0% down · 7.5% · 30yr · 1.5% tax · 5.0% vac · 8.0% maint · 8.0% mgmt
Financing live
Cash to close
- Down payment
- $12,500
- Closing costs
- $1,500
- Reserves months
- —
- Total cash needed
- —
Loan-product check · same deal, 3 products live
Conventional
25% down · 7.5% · 30yr
- Down + closing
- —
- Monthly P&I
- —
- Monthly cashflow
- —
- DSCR
- —
- Eligible?
- —
Personal DTI + credit; lowest rate.
DSCR
20% down · 8.5% · 30yr
- Down + closing
- —
- Monthly P&I
- —
- Monthly cashflow
- —
- DSCR
- —
- Eligible?
- —
No personal income docs; deal must DSCR.
Hard money
10% down · 12.0% · 12mo
- Down + closing
- —
- Monthly P&I
- —
- Monthly cashflow
- —
- DSCR
- —
- Eligible?
- —
Short-term bridge; refi at stabilization.
Rent comps 11 comps
| Address | Beds | Baths | Sqft | Rent | $/sqft | DOM | Units | Dist |
|---|---|---|---|---|---|---|---|---|
| 936 Pinon Dr Barstow, CA | 4.0 | 2.0 | 1762 | $2,400 | $1.36 | 26d | 1 | 0.15mi |
| 810 Starlight St Barstow, CA | 3.0 | 2.0 | 1430 | $1,895 | $1.33 | 45d | 1 | 0.25mi |
| 332 Date Ave Barstow, CA | 4.0 | 2.0 | 1144 | $1,950 | $1.70 | 45d | 1 | 0.58mi |
| 1140 Deseret Ave Unit A Barstow, CA | 3.0 | 2.0 | 1270 | $1,550 | $1.22 | 45d | 1 | 0.61mi |
| 937 E Elizabeth St Barstow, CA | 4.0 | 1.0 | 1422 | $2,195 | $1.54 | 6d | 1 | 0.71mi |
| 650 S Muriel Dr Barstow, CA | 3.0 | 1.0 | 1320 | $1,625 | $1.23 | 26d | 1 | 0.95mi |
| 1900 Dill Rd Barstow, CA | 1.0–3.0 | 1.0–2.0 | 892 | $1,505 | $1.69 | 0d | 8 | 1.00mi |
| 251 Juniper St Unit A Barstow, CA | 2.0 | 1.0 | 1464 | $1,350 | $0.92 | 45d | 1 | 1.02mi |
| 200 E Elizabeth St Barstow, CA | 3.0 | 1.0 | 1096 | $1,700 | $1.55 | 26d | 1 | 1.03mi |
| 720 Mount Vernon Ave Barstow, CA | 2.0 | 1.0 | 1172 | $1,296 | $1.11 | 14d | 1 | 1.26mi |
| 100 E Fredricks St Barstow, CA | 2.0 | 1.0 | 1100 | $1,195 | $1.09 | 26d | 1 | 1.49mi |
Listing history 16 events
-
2026-06-21days on market $50,000 Active 110 DOM
-
2026-06-18days on market $50,000 Active 107 DOM
-
2026-06-17days on market $50,000 Active 106 DOM
-
2026-06-16days on market $50,000 Active 105 DOM
-
2026-06-15days on market $50,000 Active 104 DOM
-
2026-06-13days on market $50,000 Active 102 DOM
-
2026-06-13days on market $50,000 Active 101 DOM
-
2026-06-09days on market $50,000 Active 98 DOM
-
2026-06-08days on market $50,000 Active 97 DOM
-
2026-06-07days on market $50,000 Active 96 DOM
-
2026-06-04days on market $50,000 Active 93 DOM
-
2026-06-03days on market $50,000 Active 92 DOM
-
2026-06-02days on market $50,000 Active 91 DOM
-
2026-06-01days on market $50,000 Active 90 DOM
-
2026-05-31days on market $50,000 Active 89 DOM
-
2026-03-03$50,000 Active 1034-char remark
Show marketing remark (1034 chars)
Welcome to this charming and affordable mobile home located in a well-maintained manufactured home park in the heart of Barstow, CA! Centrally situated, this home offers convenient access to shopping centers, local schools, dining options, and easy freeway connections—making daily commutes and errands simple and stress-free. Step inside to discover a fresh, inviting interior featuring newly painted walls and newer flooring throughout, giving the home a clean and modern feel. The open living area provides a comfortable space to relax or entertain, while the efficient layout maximizes functionality and flow. Additional highlights include ample natural light, generous storage, and low-maintenance living. The home’s attractive price point makes it an excellent opportunity for first-time home buyers ready to step into homeownership, or for investors seeking a solid rental property with strong potential. Affordable, updated, and centrally located—this is a fantastic opportunity you won’t want to miss!
ⓘ Source: listings_history table (triggers on properties + properties_extension) + one-shot
backfill from property_details.listing_events for pre-trigger history.
Climate risk First Street
- Flood 1/10 Low FEMA zone X (unshaded) · 0% chance over 30 yrs
- Wildfire 4/10 Moderate
- Heat 8/10 Severe 3 d/yr ≥103°F today · 10 d/yr by 30 yrs out
- Wind 1/10 Low
- Air quality 6/10 Major 11 unhealthy d/yr today · 15 by 30 yrs out
Nearby sold comps map
Loading sold comps map…
Walkable amenities ~0.75 mi
Loading nearby amenities…
Taxation est. · year 1
- Rental income
- $23,079
- − Mortgage interest
- −$2,801
- − Property taxes
- −$750
- − Insurance
- −$250
- − Repairs & maintenance
- −$1,846
- − Management
- −$1,846
- − Depreciation
- −$1,455
- Taxable income
- $14,131
- Est. tax owed @ 24.0%
- −$3,391
- After-tax cash flow
- $10,694/yr
For passive investors: Depreciation is non-cash, so a rental often shows a tax loss while cash-flowing — sheltering income. Rental losses are passive: they offset passive income freely, and up to $25,000/yr can offset ordinary (W-2) income if you actively participate and your MAGI is under $100k (phasing out to $0 by $150k); unused losses carry forward. On sale, claimed depreciation is recaptured at up to 25%, and gains may owe capital-gains tax (a 1031 exchange can defer both). Figures are a year-1 estimate at your 24.0% rate — not tax advice; consult a CPA.
Condition & rehab AI · 12 photos
This mobile home requires moderate renovations to update the kitchen and bathrooms, and paint the interior walls. The home has average exterior and interior conditions, with some deferred maintenance needed.
Repairs flagged
- Moderate kitchen cabinets — dated and worn
- Moderate bathroom fixtures — dated and small
- Moderate kitchen countertops — worn
Value-add opportunities
- Resale update kitchen cabinets and countertops — modernizing the kitchen
- Resale update bathroom fixtures — modernizing the bathrooms
- Both paint interior walls — enhances the home's appearance and value
Renovation cost estimate screening
| Repair item | Severity | Est. cost |
|---|---|---|
| kitchen cabinets · dated and worn | Moderate | $3,000–15,000 |
| bathroom fixtures · dated and small | Moderate | $3,000–15,000 |
| kitchen countertops · worn | Moderate | $3,000–15,000 |
| Total estimated repair cost · 3 items | $9,000–45,000 |
Value-add ROI direction
- Resale update kitchen cabinets and countertops — modernizing the kitchen ↑
- Resale update bathroom fixtures — modernizing the bathrooms ↑
- Both paint interior walls — enhances the home's appearance and value ↑
ⓘ Cost ranges are severity-bucket heuristics (US national rule-of-thumb). Get contractor quotes + a written scope before underwriting a rehab budget.
Schools (NCES district)
- District
- Barstow Unified
- NCES district ID
- 0604020
- Math proficiency
- 11% ▼ -7.00%
- Reading proficiency
- 22% ▼ -7.00%
- Median HH income
- $44,505
- Composite
- 14.44/100
- National rank
- #9430
- State rank
- #482 of 517 in CA
Livability — Barstow
- Score
- 63/100
- State rank
- #444
- US rank
- #15099
Category grades
Schools grade is shown separately in the Schools card above.
Census & demographics
- Census place
- Barstow, CA
- County
- San Bernardino County · 2,030,291 people
- City population
- 33,954
- Metro
- Riverside-San Bernardino-Ontario, CA
- Population (ZIP)
- 33,954
- Household income
- $61,862
- Rent vs Own
- Severe rent burden
- 1305.0
Population outlook (San Bernardino County) Hauer SSP2
- Today (2025)
- 2,300,329 people
- By 2030
- 2,378,907 · +3.4%
- By 2040
- 2,523,137 · +9.7%
- By 2050
- 2,642,388 · +14.9%
- By 2075
- 2,880,769 · +25.2%
- By 2100
- 2,909,436 · +26.5%
Race, ethnicity, and origin ACS 2023
- Neighborhood character
- Diverse neighborhood (Simpson 0.68)
- Race & ethnicity
- Hispanic / Latino 46% White 29% Two or more races 22% Black 15% Native American 3% Asian 2% Pacific Islander 1%
- Hispanic origin (detail)
- Mexican 39% Puerto Rican 2%
- Common ancestry
- Portuguese 1% Lithuanian 1% Italian 1%
- Foreign-born
- 9% · Canada, South Korea
- Languages at home
- 77% English-only · Spanish 20% Tagalog/Filipino 1% Other Indo-European 1%
Political lean MEDSL · San Bernardino
- 2024 margin
- Toss-up / Even · D 47.5% · R 49.7% · Other 2.8%
- 2008→2024 swing
- -8.5pp toward R · 2008: 6.3pp · 2024: -2.1pp
- All cycles
- 2024: R+2.1 2020: D+10.7 2016: D+9.8 2012: D+5.4 2008: D+6.3
Not yet ingested
- Civics
- —
Market trends
- HPI YoY
- ▼ -139.26%
- Current HPI
- 316.4858
- Rent YoY
- ▲ 2.32%
- Metro
- Riverside-San Bernardino-Ontario, CA
- State GDP YoY
- ▲ 3.21%
- F500 in state
- 116
Industry mix (Fortune 500 HQ in CA)
| Industry | F500 HQs | Revenue |
|---|---|---|
| Technology | 27 | $1,492B |
|
||
| Financial Services | 3 | $174B |
|
||
| Retail | 3 | $44B |
|
||
| Insurance | 3 | $26B |
|
||
| Media / Entertainment | 2 | $115B |
|
||
| Pharmaceuticals / Biotech | 2 | $62B |
|
||
Price history
1 event — show timeline
- 2026-03-03 Listed $50,000 CRMLS
Cash-flow waterfall
monthlySold comps — $/sqft
last 12 mo · ≤1 miLoading sold comps…