1309 Park Blvd · Camden, NJ
Flood risk 6/10 · Moderate
- FEMA flood zone
- X (unshaded)
- Chance of flooding over 30 yrs
- 0.75%
- Est. flood insurance / yr
- $507 – $1,088
Fire risk 1/10 · Minimal
- Est. fire insurance / yr
- $526 – $976
Heat risk 7/10 · Major
- Hot days now (above 103°F)
- 7 days/yr
- Hot days in 30 yrs
- 15 days/yr
Wind risk 6/10 · Moderate
- Chance of severe wind over 30 yrs
- 27.0%
Air-quality risk 4/10 · Minor
- Unhealthy air days now
- 5 days/yr
- Unhealthy air days in 30 yrs
- 6 days/yr
Risk factors via First Street. Map © Google.
Why this score? — see what drove the C- grade
The composite is a weighted blend of 9 inputs, each scored 0–100. Each bar is that input's sub-score; the figure is the points it added to the 100-point composite (weight × sub-score).
- Cash flow +21.7/30.0
- ARV discount +7.5/15.0
- DSCR +6.9/10.0
- 1% rule +5.7/10.0
- Appreciation +3.8/10.0
- Livability +3.5/5.0
- Rent growth +2.5/5.0
- Condition / age +2.5/5.0
- Schools +0.7/10.0
$185,000
🖨 Deal sheet (PDF) 📄 Offer letter ✓ Due diligence
Listing remarks MLS
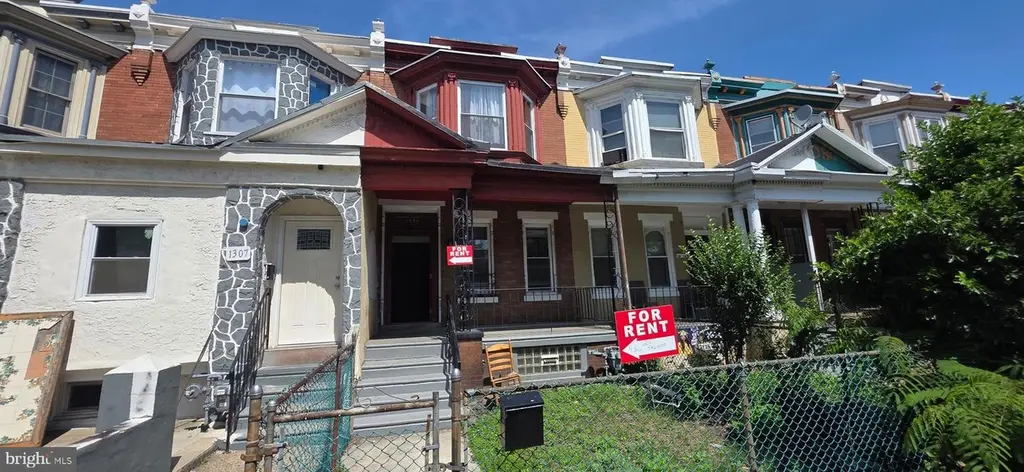
Welcome home to this recently refreshed and renovated townhome. Be greeted with a lovely front covered porch. Come in the front door and the first thing you'll notice is the new low upkeep vinyl flooring throughout the entire home. Upgrades include custom oversized molding, 6 panel doors, updated vinyl windows, and ceiling fans in all bedrooms. The master bedroom has wonderful built ins for additional storage. Plus, you'll find 3 more nicely sized bedrooms and a updated full bath with wainscoting that will complete the 2nd floor. There is an unfinished basement with a newer sewer line installed. Low maintenance brick exterior, new roof repairs, new plumbing, new windows, fresh paint throughout. Heater is under 5 years old. Washer and Dryer hookup. Worry free, just move in. All of this within walking distance to public transportation and shopping.
Key facts
- Laminate flooring
- Concrete basement
- Formica countertops
Tags
Property features AI
Exterior
- Parking: On-street parking
- Utilities: Public water; Public sewer; Natural gas service; Cable TV available
- Home design: Interior townhouse/rowhouse; Above-grade finished living space (1,662 finished above-grade square feet)
- Construction: Brick construction; Brick/mortar foundation; Asphalt roof; Replacement vinyl-clad windows; Pets allowed with no restrictions
- Exterior features: Fully fenced lot; Not in a federal flood zone
Interior
- Kitchen: Kitchen (appliances not specified)
- Bedrooms: Four bedrooms on the upper level; Master bedroom plus three additional bedrooms
- Flooring: Laminate flooring
- Bathrooms: One full bathroom on the main level; One full bathroom total
- Heating & cooling: Forced air heating; Natural gas heating and hot water; Circuit breaker electrical panel
- Interior features: Built-in shelving/cabinetry; Ceiling fans; Wainscoting; Drywall walls and ceilings
- Laundry & utility: Interior laundry
Neighborhood map
What this means for you Summary
Snapshot
- This is a 4-bed/1.0-bath townhouse listed at $185k.
Deal economics
- At list price, monthly cash flow is $285 ($3k/yr) — positive.
- The deal already cash-flows at list — no discount required.
- Meets the 1% rule at list price ($2k rent vs $185k).
Location & tenants
- Location reads 70/100 on livability (#262 in NJ) — a middle-class / working-renter tenant base. Strengths: amenities A+, commute A+, cost of living A; Watch: crime F, employment F.
- Camden City School District (urban): math 3% / reading 16% proficiency, ranked #472 of 472 in NJ (top 100%) — low school quality limits family demand, transient renter base, plan for 1-2y turnover; 86% free/reduced lunch — lower-income household profile, screen leases tightly.
- Zoned schools: Morgan Village Middle School (244 students, 77% FRL).
- Market conditions: 64 active listings in the ZIP; 10 comparable units currently listed for rent nearby; rentals at typical pace (median 20d on market — plan ~3-4 weeks tenant-placement turnaround); lower-income renter base — watch delinquency; 1,018 units permitted in Camden County in 2024 (509 in 5+ unit buildings).
- At $1,978/mo this rent would consume 65% of the median local household income ($37k/yr) (locally 1141% of renters already pay >50% of income on rent) — very limited rent-growth headroom before tenants either downsize or default.
Forward outlook
- Local home prices are declining (-2.4%/yr); year-one equity from $1k of loan paydown is wiped out by about $4k of value loss. Plan a longer hold.
- Camden County population projected to shrink 8% by 2050 — rents likely to lag national; underwrite the cash flow, not the appreciation.
Negotiation context
- Only 5 days on market — expect competitive offers; lowballing is unlikely to land.
- 3 sale attempts since 4y ago with the ask held roughly flat each time — persistent listings suggest the price (not the market) is what's stuck; bring a comps-based counter.
- Current owner paid $130k; 42% above their basis — modest negotiation headroom, anchor on the comps not their cost.
Risks & watch-outs
- Watch-outs: built in 1920 — expect roof / HVAC / electrical / plumbing capex.
- Climate carrying-cost: major flood risk; major wind risk, 27% chance of damaging wind over 30y; extreme-heat days projected 7→15/yr by 2055 (HVAC capex compounding) — expect insurance premiums to compound above CPI over the hold.
Questions for the listing agent
- Built in 1920 — when were the roof, HVAC, electrical panel, plumbing, and water heater last replaced?
- Is there a deadline driving the sale (1031 exchange, divorce, estate, relocation)? That informs how much negotiation room exists.
- Schools are F-rated, which usually means shorter tenancies and higher turnover. Who's the typical renter profile here, and what's been the actual vacancy rate?
- Crime grade is F in this area — have there been break-ins, vandalism, or insurance claims at this property in the last 3 years? What carrier currently insures it and at what premium?
- What's the average days-on-market for RENTAL listings here right now (not sales)? A rising rental-DOM trend means longer vacancies and softer asking-rent achievability than the comps imply.
- What's the recent tenant-quality profile in this submarket — average credit score on applications, eviction rate, late-payment / NSF rate, and stable-employment percentage? A property-management company in the area should have these aggregated.
- How much new for-sale + rental construction is in the pipeline within 1–3 miles? Heavy new supply typically softens prices + rents 12–24 months out; constrained supply supports both.
Investment metrics
- 1% rule
- 1.07% ✓
- Cap rate
- 8.14%
- Cash-on-cash
- 6.60%
- DSCR
- 1.29
- GRM
- 7.8
CMA / ARV
- ARV (on-the-fly)
- $118,002
- Comps found
- 12
Show comp detail 12 sales within ~0.75 mi
| Address | Dist | Beds/Ba | Sqft | Sold | Price | $/sf | Match |
|---|---|---|---|---|---|---|---|
| 1118 Langham Ave | 0.11mi | 3/1.5 (-1) | 1,636 (-2%) | 4mo | $220,000 | $134 | 82 |
| 1514 Newport St | 0.55mi | 3/1.0 (-1) | 1,629 (-2%) | 2mo | $72,000 | $44 | 65 |
| 1326 Princess Ave | 0.35mi | 4/2.0 | 1,792 (+8%) | 5mo | $127,500 | $71 | 63 |
| 1260 Kenwood Ave | 0.25mi | 3/1.5 (-1) | 1,476 (-11%) | 2mo | $100,000 | $68 | 61 |
| 1223 Whitman Ave | 0.43mi | 3/1.0 (-1) | 1,496 (-10%) | 1mo | $86,458 | $58 | 57 |
| 1268 Kenwood Ave | 0.26mi | 3/1.5 (-1) | 1,476 (-11%) | 6mo | $100,000 | $68 | 57 |
| 1165 Morton St | 0.58mi | 3/1.0 (-1) | 1,557 (-6%) | 2mo | $80,000 | $51 | 56 |
| 1498 Princess Ave | 0.58mi | 4/2.0 | 1,813 (+9%) | 0mo | $160,000 | $88 | 54 |
| 1155 Whitman Ave | 0.44mi | 3/1.5 (-1) | 1,431 (-14%) | 2mo | $206,000 | $144 | 48 |
| 1508 S Bradley Ave | 0.52mi | 3/2.0 (-1) | 1,499 (-10%) | 6mo | $160,000 | $107 | 46 |
| 1099 Morton St | 0.61mi | 3/1.0 (-1) | 1,431 (-14%) | 1mo | $65,000 | $45 | 43 |
| 1522 S 10th St | 0.60mi | 3/1.0 (-1) | 1,429 (-14%) | 2mo | $125,000 | $87 | 42 |
Match score weights: distance 35% · size 25% · config 20% · recency 20%. Top-matched comps best support the ARV.
Projected returns pro-forma
-2.36% appreciation · 3.0% rent growth · sell at horizon
- IRR
- -3.3%
- Equity multiple
- 0.87×
- Total profit
- $-6,795
- Equity at exit
- $32,922
- IRR
- 5.3%
- Equity multiple
- 1.42×
- Total profit
- $21,949
- Equity at exit
- $25,316
Cash invested: $51,800 (down + closing). Projections, not guarantees.
Landlord ↔ Tenant lean methodology
- Overall (STATE)
- 21 Tenant-Leaning
- State New Jersey
- 21 Tenant-Leaning · D+6
- County
- — inherits STATE
- City
- — inherits STATE
ZIP-level market 08103
- Home prices YoY
- -1.4%
- Active inventory
- 64
- Price-to-rent
- 7.8×
Monthly cashflow live
- Estimated rent
- $1,978 high interval (Pro) →
- Mortgage (P&I)
- −$970
- Tax from tax record
- −$231 /mo · $2,769/yr
- Insurance
- −$77
- HOA
- −$0
- Vacancy / Maint / Mgmt
- −$415
- Net cashflow
- $285
Break-even live
Sensitivity live
| Price | -10% $389 | -5% $337 | +0% $285 | +5% $232 | +10% $180 |
|---|---|---|---|---|---|
| Rent | -10% $128 | -5% $207 | +0% $285 | +5% $363 | +10% $441 |
| Rate | -1.0pp $378 | -0.5pp $332 | base $285 | +0.5pp $237 | +1.0pp $188 |
UW: 25.0% down · 7.5% · 30yr · 1.5% tax · 5.0% vac · 8.0% maint · 8.0% mgmt
Financing live
Cash to close
- Down payment
- $46,250
- Closing costs
- $5,550
- Reserves months
- —
- Total cash needed
- —
Loan-product check · same deal, 3 products live
Conventional
25% down · 7.5% · 30yr
- Down + closing
- —
- Monthly P&I
- —
- Monthly cashflow
- —
- DSCR
- —
- Eligible?
- —
Personal DTI + credit; lowest rate.
DSCR
20% down · 8.5% · 30yr
- Down + closing
- —
- Monthly P&I
- —
- Monthly cashflow
- —
- DSCR
- —
- Eligible?
- —
No personal income docs; deal must DSCR.
Hard money
10% down · 12.0% · 12mo
- Down + closing
- —
- Monthly P&I
- —
- Monthly cashflow
- —
- DSCR
- —
- Eligible?
- —
Short-term bridge; refi at stabilization.
Rent comps 10 comps
| Address | Beds | Baths | Sqft | Rent | $/sqft | DOM | Units | Dist |
|---|---|---|---|---|---|---|---|---|
| 1055 Kenwood Ave Camden, NJ | 4.0 | 1.0 | 1088 | $1,875 | $1.72 | 26d | 1 | 0.01mi |
| 1455 Wildwood Ave Camden, NJ | 3.0 | 1.5 | 1353 | $1,900 | $1.40 | 12d | 1 | 0.17mi |
| 708 Royden St Camden, NJ | 3.0 | 1.0 | 1113 | $1,595 | $1.43 | 19d | 1 | 0.59mi |
| 457 Mechanic St Camden, NJ | 3.0 | 2.0 | 1200 | $1,950 | $1.62 | 20d | 1 | 0.89mi |
| 609 Henry St Camden, NJ | 3.0 | 1.0 | 1290 | $1,600 | $1.24 | 26d | 1 | 0.91mi |
| 440 Henry St Camden, NJ | 3.0 | 1.5 | 1224 | $2,200 | $1.80 | 26d | 1 | 0.93mi |
| 324 S 27th St Camden, NJ | 3.0 | 1.0 | 1152 | $1,900 | $1.65 | 26d | 1 | 1.27mi |
| 2752 Mickle St Camden, NJ | 3.0 | 1.0 | 1450 | $1,850 | $1.28 | 18d | 1 | 1.28mi |
| 2754 Mickle St Camden, NJ | 3.0 | 1.0 | 1500 | $1,850 | $1.23 | 0d | 1 | 1.28mi |
| 1 Market St Camden, NJ | 3.0 | 1.0–2.0 | 1190 | $2,456 | $2.06 | 0d | 14 | 1.43mi |
Listing history 4 events
-
2026-06-21days on market $185,000 Active 5 DOM
-
2026-06-18days on market $185,000 Active 2 DOM
-
2026-06-17remarks 485-char remark
-
2026-06-17$185,000 Active 1 DOM
ⓘ Source: listings_history table (triggers on properties + properties_extension) + one-shot
backfill from property_details.listing_events for pre-trigger history.
Tax reassessment forecast NJ · Partial reset (capped growth)
- Current annual tax
- $2,769 · $231/mo
- Projected year-2 tax
- $3,688 · $307/mo
- Expected delta
- +$919/yr (+$77/mo · 33.2%)
ⓘ Screening estimate from a state-policy table — verify with the county assessor before closing.
Climate risk First Street
- Flood 6/10 Major FEMA zone X (unshaded) · 75% chance over 30 yrs
- Wildfire 1/10 Low
- Heat 7/10 Severe 7 d/yr ≥103°F today · 15 d/yr by 30 yrs out
- Wind 6/10 Major 27% chance of damaging wind over 30 yrs
- Air quality 4/10 Moderate 5 unhealthy d/yr today · 6 by 30 yrs out
Nearby sold comps map
Loading sold comps map…
Walkable amenities ~0.75 mi
Loading nearby amenities…
Taxation est. · year 1
- Rental income
- $23,738
- − Mortgage interest
- −$10,363
- − Property taxes
- −$2,769
- − Insurance
- −$925
- − Repairs & maintenance
- −$1,899
- − Management
- −$1,899
- − Depreciation
- −$5,382
- Taxable income
- $501
- Est. tax owed @ 24.0%
- −$120
- After-tax cash flow
- $3,297/yr
For passive investors: Depreciation is non-cash, so a rental often shows a tax loss while cash-flowing — sheltering income. Rental losses are passive: they offset passive income freely, and up to $25,000/yr can offset ordinary (W-2) income if you actively participate and your MAGI is under $100k (phasing out to $0 by $150k); unused losses carry forward. On sale, claimed depreciation is recaptured at up to 25%, and gains may owe capital-gains tax (a 1031 exchange can defer both). Figures are a year-1 estimate at your 24.0% rate — not tax advice; consult a CPA.
Schools (NCES district)
- District
- Camden City School District
- NCES district ID
- 3402640
- Math proficiency
- 3% ▼ -6.00%
- Reading proficiency
- 16% ▬ 0.00%
- Median HH income
- $25,845
- Composite
- 6.85/100
- National rank
- #9981
- State rank
- #472 of 472 in NJ
Livability — Camden
- Score
- 70/100
- State rank
- #262
- US rank
- #7721
Category grades
Schools grade is shown separately in the Schools card above.
Census & demographics
- Census place
- Camden, NJ
- County
- Camden County · 407,624 people
- City population
- 20,865
- Metro
- Philadelphia-Camden-Wilmington, PA-NJ-DE-MD
- Population (ZIP)
- 12,573
- Household income
- $36,793
- Rent vs Own
- Severe rent burden
- 1141.0
Population outlook (Camden County) Hauer SSP2
- Today (2025)
- 507,964 people
- By 2030
- 502,182 · -1.1%
- By 2040
- 485,602 · -4.4%
- By 2050
- 465,630 · -8.3%
- By 2075
- 419,986 · -17.3%
- By 2100
- 369,492 · -27.3%
Race, ethnicity, and origin ACS 2023
- Neighborhood character
- Diverse neighborhood (Simpson 0.57)
- Race & ethnicity
- Black 54% Hispanic / Latino 36% Two or more races 9% White 5% Asian 1%
- Hispanic origin (detail)
- Mexican 4% Puerto Rican 19% Dominican 4%
- Common ancestry
- Hispanic 1%
- Foreign-born
- 12% · Canada, Jamaica
- Languages at home
- 75% English-only · Spanish 22% Tagalog/Filipino 2%
Political lean MEDSL · Camden
- 2024 margin
- Strong D (+27.4) · D 63.0% · R 35.5% · Other 1.5%
- 2008→2024 swing
- -8.8pp toward R · 2008: 36.2pp · 2024: 27.4pp
- All cycles
- 2024: D+27.4 2020: D+33.5 2016: D+32.4 2012: D+36.6 2008: D+36.2
Not yet ingested
- Civics
- —
Market trends
- HPI YoY
- ▼ -2.36%
- Current HPI
- 162.557
- Rent YoY
- —
- Metro
- Philadelphia-Camden-Wilmington, PA-NJ-DE-MD
- State GDP YoY
- ▲ 2.05%
- F500 in state
- 34
Industry mix (Fortune 500 HQ in NJ)
| Industry | F500 HQs | Revenue |
|---|---|---|
| Consumer Goods | 3 | $31B |
|
||
| Pharmaceuticals | 2 | $153B |
|
||
| Technology | 2 | $21B |
|
||
| Insurance | 2 | $20B |
|
||
| Healthcare | 2 | $19B |
|
||
| Financial Services | 1 | $70B |
|
||
Price history
+23.3% since first listed8 events — show timeline
- 2026-06-16 Listed $185,000 BRIGHT MLS
- 2023-01-04 Sold (Public Records) $130,000 Public Records
- 2022-10-28 Sold (MLS) $130,000 BRIGHT MLS
- 2022-10-24 Pending — BRIGHT MLS
- 2022-10-10 Relisted — BRIGHT MLS
- 2022-07-30 Contingent — BRIGHT MLS
- 2022-06-24 Price Changed $125,000 BRIGHT MLS
- 2022-05-03 Listed $150,000 BRIGHT MLS
Property tax history
+5.3%/yrLatest (2025): $2,769 · +4.1% YoY. Source: county tax records.
Cash-flow waterfall
monthlySold comps — $/sqft
last 12 mo · ≤1 miLoading sold comps…