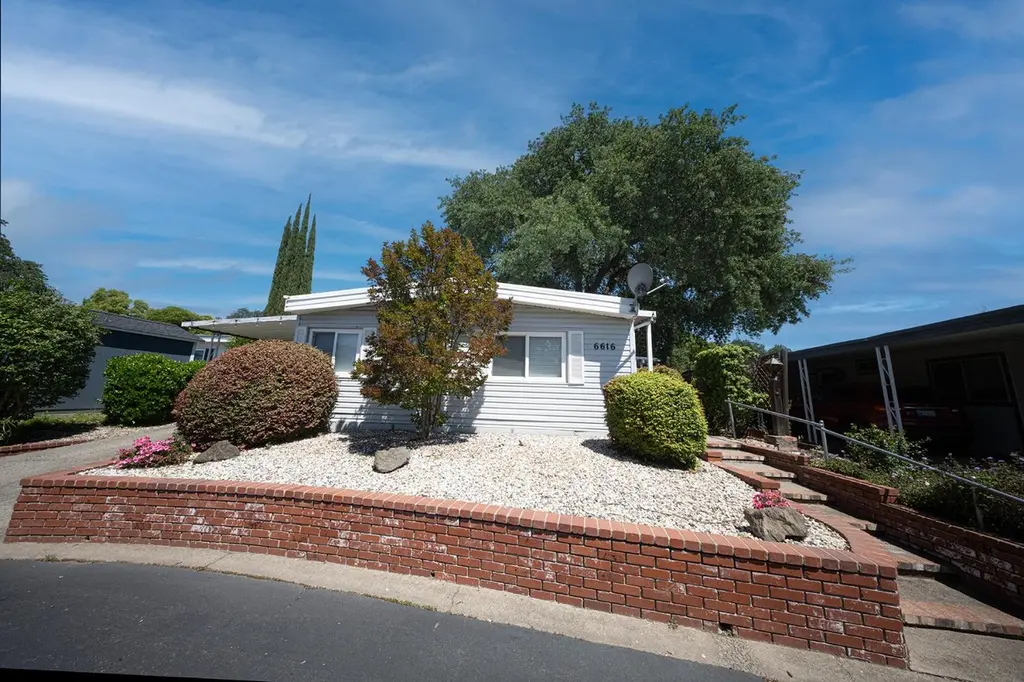
6616 Silver Springs Ct · Citrus Heights, CA
Flood risk 1/10 · Minimal
- FEMA flood zone
- X (unshaded)
- Chance of flooding over 30 yrs
- 0.0%
- Est. flood insurance / yr
- $507 – $1,088
Fire risk 1/10 · Minimal
- Est. fire insurance / yr
- $659 – $1,223
Heat risk 7/10 · Major
- Hot days now (above 102°F)
- 7 days/yr
- Hot days in 30 yrs
- 16 days/yr
Wind risk 1/10 · Minimal
- Chance of severe wind over 30 yrs
- —
Air-quality risk 10/10 · Severe
- Unhealthy air days now
- 34 days/yr
- Unhealthy air days in 30 yrs
- 36 days/yr
Risk factors via First Street. Map © Google.
Why this score? — see what drove the B- grade
The composite is a weighted blend of 9 inputs, each scored 0–100. Each bar is that input's sub-score; the figure is the points it added to the 100-point composite (weight × sub-score).
- Cash flow +29.8/30.0
- DSCR +10.0/10.0
- ARV discount +8.7/15.0
- 1% rule +8.4/10.0
- Schools +4.4/10.0
- Rent growth +3.0/5.0
- Livability +3.0/5.0
- Condition / age +2.5/5.0
- Appreciation +0.0/10.0
$164,000
🖨 Deal sheet (PDF) 📄 Offer letter ✓ Due diligence
Listing remarks
If you are looking to downsize don't miss out on this darling home with lots of upgrades! The well laid out kitchen has updated cabinets with beautiful granite countertops, and newer appliances. Pamper yourself in the gorgeous primary bath. New flooring in the living/dining room keeps it light and bright and move in ready! There is plenty of space in the backyard to use your gardening tools or just hang out and relax. Take a stroll up to the end of the court to the lake and enjoy the view! Stop along the way and visit with your neighbors on this friendly street. Join some of the many activities that Lakeview Village has to offer. What are you waiting for?!
Key facts
- Updated cabinets
- Newer appliances
- New flooring
Tags
Property features AI
Finance
- Other: Land lease amount listed (see listing for details)
- Financial info: Land lease: No
- HOA & community: No association
Exterior
- Parking: Covered parking
- Utilities: Public water; Public sewer; 220V outlet in laundry
- Home design: Manufactured in park; Double-wide; Built in 1975; Located in a senior community; Address: 6616 Silver Springs Ct, Citrus Heights, CA 95621
- Construction: Manufactured home made by Skyline
- Exterior features: Backyard; Adjacent to greenbelt; Metal roof
Interior
- Kitchen: Built-in electric oven; Gas cook top; Free-standing refrigerator; Dishwasher; Microwave
- Bedrooms: 2 bedrooms
- Flooring: Carpet; Laminate
- Bathrooms: 2 full bathrooms with double sinks, tub, and shower stall(s)
- Heating & cooling: Central heating; Central air conditioning; Ceiling fans
- Interior features: Formal dining area; Kitchen island; Stone countertops; Living room with unspecified feature
- Laundry & utility: Washer and dryer included; Laundry inside the home
Neighborhood map
What this means for you Summary
Snapshot
- This is a 2-bed/2.0-bath manufactured listed at $164k.
Deal economics
- At list price, monthly cash flow is $603 ($7k/yr) — positive.
- The deal already cash-flows at list — no discount required.
- Meets the 1% rule at list price ($2k rent vs $164k).
- Recommended offer: $159k (3.0% below list) — sets the bar for market timing.
- Cap rate 10.7% vs local median 3.4% in Citrus Heights — top-decile yield for the area; either an underpriced asset or a hidden risk that comps aren't pricing in. Stress-test before assuming the spread holds.
Location & tenants
- Location reads 60/100 on livability (#614 in CA) — a middle-class / working-renter tenant base. Strengths: housing A+; Watch: crime D-, amenities F, commute F.
- San Juan Unified (suburban): math 40% / reading 62% proficiency, ranked #138 of 517 in CA (top 27%) — acceptable for families but not a draw, mixed tenant base, ~2y average lease.
- Zoned schools: Orangevale Open K-8 (572 students, 22% FRL); Sylvan Middle (647 students, 71% FRL); El Camino Fundamental High (math 34% / reading 62%, grade D, #378 of 1,170 statewide, top 32%, 1,246 students, 50% FRL) — zoned schools at 48% FRL track the district average.
- Market conditions: Rents rising (+1.9%/yr); 219 active listings in the ZIP; 30 comparable units currently listed for rent nearby; rentals at typical pace (median 19d on market — plan ~3-4 weeks tenant-placement turnaround); solid renter incomes; 6,825 units permitted in Sacramento County in 2024 (1,752 in 5+ unit buildings).
- This rent runs 33% of the median local income ($81k/yr) — at the standard rent-burdened threshold; future hikes will face affordability resistance.
Forward outlook
- Local home prices are declining (-3.0%/yr); year-one equity from $1k of loan paydown is wiped out by about $5k of value loss. Plan a longer hold.
- Sacramento County population projected at +17% by 2050 — long-run rental-demand tailwind backs the buy-and-hold thesis.
- At projected returns (-3.0% appreciation + 1.9% rent growth), your $46k cash investment doubles in ~9 years — after that, you're playing with house money.
Negotiation context
- It's been on market 41 days — a 3% lower offer ($159k) is reasonable based on typical stale-listing flexibility.
Risks & watch-outs
- Climate carrying-cost: extreme-heat days projected 7→16/yr by 2055 (HVAC capex compounding) — expect insurance premiums to compound above CPI over the hold.
Questions for the listing agent
- It's been on market 41 days. Have you received any prior offers? Is the seller open to a 3% concession, seller financing, or rate buy-down credit?
- Built in 1975 — when were the roof, HVAC, electrical panel, plumbing, and water heater last replaced?
- Is there a deadline driving the sale (1031 exchange, divorce, estate, relocation)? That informs how much negotiation room exists.
- Schools are D-rated, which usually means shorter tenancies and higher turnover. Who's the typical renter profile here, and what's been the actual vacancy rate?
- Crime grade is D in this area — have there been break-ins, vandalism, or insurance claims at this property in the last 3 years? What carrier currently insures it and at what premium?
- What's the average days-on-market for RENTAL listings here right now (not sales)? A rising rental-DOM trend means longer vacancies and softer asking-rent achievability than the comps imply.
- What's the recent tenant-quality profile in this submarket — average credit score on applications, eviction rate, late-payment / NSF rate, and stable-employment percentage? A property-management company in the area should have these aggregated.
- How much new for-sale + rental construction is in the pipeline within 1–3 miles? Heavy new supply typically softens prices + rents 12–24 months out; constrained supply supports both.
Investment metrics
- 1% rule
- 1.34% ✓
- Cap rate
- 10.70%
- Cash-on-cash
- 15.76%
- DSCR
- 1.70
- GRM
- 6.2
CMA / ARV
- ARV (median comp)
- $168,360
- List price
- $164,000
- Delta
- -2.59%
- Verdict
- FAIR
- Comps
- 20 within 1.0 mi
Show comp detail 12 sales within ~0.75 mi
| Address | Dist | Beds/Ba | Sqft | Sold | Price | $/sf | Match |
|---|---|---|---|---|---|---|---|
| 6113 Summerset Ln | 0.26mi | 2/2.0 | 1,344 (0%) | 2mo | $169,000 | $126 | 87 |
| 6621 Grosse Point Ct | 0.06mi | 2/2.0 | 1,248 (-7%) | 1mo | $130,000 | $104 | 85 |
| 6116 Mame Ct | 0.14mi | 2/2.0 | 1,440 (+7%) | 3mo | $179,000 | $124 | 79 |
| 6641 Grosse Point Ct | 0.09mi | 2/2.0 | 1,464 (+9%) | 3mo | $175,000 | $120 | 79 |
| 6105 Mame Ct | 0.09mi | 3/2.0 (+1) | 1,248 (-7%) | 3mo | $85,000 | $68 | 76 |
| 6116 Mame Ct #905 | 0.13mi | 2/2.0 | 1,440 (+7%) | 8mo | $100,000 | $69 | 75 |
| 6625 Galaxy Ct | 0.10mi | 2/2.0 | 1,146 (-15%) | 2mo | $155,000 | $135 | 69 |
| 6637 Grosse Point Ct | 0.08mi | 3/2.0 (+1) | 1,536 (+14%) | 1mo | $95,000 | $62 | 67 |
| 6845 Caywood Ct | 0.36mi | 2/2.0 | 1,536 (+14%) | 2mo | $150,000 | $98 | 58 |
| 6923 Daisy Ln | 0.40mi | 2/2.0 | 1,488 (+11%) | 7mo | $155,000 | $104 | 58 |
| 6937 Grand Tree Ln | 0.47mi | 2/2.0 | 1,495 (+11%) | 6mo | $169,500 | $113 | 54 |
| 6206 Plymouth Rock Ln #110 | 0.59mi | 3/2.0 (+1) | 1,536 (+14%) | 1mo | $159,000 | $104 | 43 |
Match score weights: distance 35% · size 25% · config 20% · recency 20%. Top-matched comps best support the ARV.
Projected returns pro-forma
-3.0% appreciation · 1.9% rent growth · sell at horizon
- IRR
- 5.4%
- Equity multiple
- 1.21×
- Total profit
- $9,451
- Equity at exit
- $24,453
- IRR
- 13.8%
- Equity multiple
- 2.05×
- Total profit
- $48,152
- Equity at exit
- $14,180
Cash invested: $45,920 (down + closing). Projections, not guarantees.
Landlord ↔ Tenant lean methodology
- Overall (STATE)
- 18 Strongly Tenant-Friendly
- State California
- 18 Strongly Tenant-Friendly · D+13
- County
- — inherits STATE
- City
- — inherits STATE
ZIP-level market 95621
- Rents YoY
- 1.9%
- Active inventory
- 219
- Price-to-rent
- 6.2×
Monthly cashflow live
- Estimated rent
- $2,198 high interval (Pro) →
- Mortgage (P&I)
- −$860
- Tax est. 1.5%
- −$205 /mo · $2,460/yr
- Insurance
- −$68
- HOA
- −$0
- Vacancy / Maint / Mgmt
- −$462
- Net cashflow
- $603
Break-even live
Sensitivity live
| Price | -10% $716 | -5% $660 | +0% $603 | +5% $546 | +10% $490 |
|---|---|---|---|---|---|
| Rent | -10% $429 | -5% $516 | +0% $603 | +5% $690 | +10% $777 |
| Rate | -1.0pp $685 | -0.5pp $645 | base $603 | +0.5pp $560 | +1.0pp $517 |
UW: 25.0% down · 7.5% · 30yr · 1.5% tax · 5.0% vac · 8.0% maint · 8.0% mgmt
Financing live
Cash to close
- Down payment
- $41,000
- Closing costs
- $4,920
- Reserves months
- —
- Total cash needed
- —
Loan-product check · same deal, 3 products live
Conventional
25% down · 7.5% · 30yr
- Down + closing
- —
- Monthly P&I
- —
- Monthly cashflow
- —
- DSCR
- —
- Eligible?
- —
Personal DTI + credit; lowest rate.
DSCR
20% down · 8.5% · 30yr
- Down + closing
- —
- Monthly P&I
- —
- Monthly cashflow
- —
- DSCR
- —
- Eligible?
- —
No personal income docs; deal must DSCR.
Hard money
10% down · 12.0% · 12mo
- Down + closing
- —
- Monthly P&I
- —
- Monthly cashflow
- —
- DSCR
- —
- Eligible?
- —
Short-term bridge; refi at stabilization.
Rent comps 30 comps
| Address | Beds | Baths | Sqft | Rent | $/sqft | DOM | Units | Dist |
|---|---|---|---|---|---|---|---|---|
| 6219 Oak Valley Ln Citrus Heights, CA | 3.0 | 3.0 | 1304 | $2,295 | $1.76 | 20d | 1 | 0.32mi |
| 6219 Oak Valley Ln Citrus Heights, CA | 3.0 | 2.5 | 1304 | $2,295 | $1.76 | 46d | 1 | 0.32mi |
| 6319 Misty Wood Way Citrus Heights, CA | 3.0 | 2.0 | 1454 | $2,500 | $1.72 | 46d | 1 | 0.52mi |
| 6203 Ackland Ct Citrus Heights, CA | 3.0 | 1.5 | 1322 | $2,500 | $1.89 | 26d | 1 | 0.52mi |
| 6011 Shadow Ln Citrus Heights, CA | 1.0–2.0 | 1.0–2.0 | 779 | $2,348 | $3.01 | 4d | 15 | 0.66mi |
| 6940 Trailride Way Citrus Heights, CA | 3.0 | 2.0 | 1527 | $2,695 | $1.76 | 46d | 1 | 0.66mi |
| 6687 Greenback Ln Citrus Heights, CA | 3.0 | 2.0 | 1323 | $2,495 | $1.89 | 20d | 1 | 0.75mi |
| 6025 Dewey Dr Citrus Heights, CA | 3.0 | 2.0 | 1847 | $2,500 | $1.35 | 26d | 1 | 0.81mi |
| 6104 Rockport Ln Citrus Heights, CA | 3.0 | 2.5 | 1150 | $2,295 | $2.00 | 24d | 1 | 0.84mi |
| 5979 Devecchi Ave Citrus Heights, CA | 1.0–2.0 | 1.0–2.0 | 775 | $1,889 | $2.44 | 0d | 16 | 0.85mi |
| 7120 Van Maren Ln Citrus Heights, CA | 3.0 | 2.0 | 1292 | $2,495 | $1.93 | 20d | 1 | 0.87mi |
| 6558 Meadowcreek Way Citrus Heights, CA | 3.0 | 2.0 | 1304 | $2,500 | $1.92 | 46d | 1 | 0.89mi |
| 7135 Cobalt Way Citrus Heights, CA | 3.0 | 1.0 | 1200 | $1,995 | $1.66 | 6d | 1 | 0.98mi |
| 5844 Garden Park Ct Unit RV 5853-D Carmichael, CA | 2.0 | 1.0 | 915 | $1,525 | $1.67 | 18d | 1 | 0.99mi |
| 5844 Garden Park Ct Unit RV 5877-B Carmichael, CA | 2.0 | 1.0 | 915 | $1,575 | $1.72 | 18d | 1 | 0.99mi |
| 5417 Olympic Way Sacramento, CA | 2.0 | 1.0 | 920 | $1,795 | $1.95 | 17d | 1 | 1.03mi |
| 7024 San Altos Cir Citrus Heights, CA | 2.0 | 2.0 | 1120 | $2,800 | $2.50 | 46d | 1 | 1.04mi |
| 5718 Manzanita Ave Carmichael, CA | 2.0 | 1.0 | 980 | $2,000 | $2.04 | 46d | 1 | 1.09mi |
| 7139 Baranga Dr Citrus Heights, CA | 3.0 | 1.5 | 1162 | $2,500 | $2.15 | 4d | 1 | 1.13mi |
| 5922 Petaluma Ct Sacramento, CA | 2.0 | 2.0 | 1048 | $2,075 | $1.98 | 0d | 1 | 1.18mi |
| 6172 Peoria Dr Citrus Heights, CA | 2.0 | 1.0 | 917 | $1,695 | $1.85 | 6d | 1 | 1.26mi |
| 5587 Keoncrest Cir Unit 2 Sacramento, CA | 2.0 | 1.5 | 900 | $2,000 | $2.22 | 0d | 1 | 1.32mi |
| 6413 Tupelo Dr Citrus Heights, CA | 1.0–2.0 | 1.0–2.0 | 775 | $2,000 | $2.58 | 4d | 10 | 1.35mi |
| 6841 Concert Way Sacramento, CA | 2.0 | 2.0 | 1000 | $1,995 | $2.00 | 0d | 1 | 1.36mi |
| 7323 Chivalry Way Citrus Heights, CA | 2.0 | 2.0 | 1121 | $2,095 | $1.87 | 12d | 1 | 1.38mi |
| 6225 Wildomar Way Carmichael, CA | 3.0 | 1.0 | 1040 | $3,000 | $2.88 | 46d | 1 | 1.40mi |
| 5233 Calistoga Way Sacramento, CA | 3.0 | 2.0 | 1200 | $2,495 | $2.08 | 0d | 1 | 1.44mi |
| 7761 Pompei Ct Unit 7763 Citrus Heights, CA | 2.0 | 1.0 | 900 | $1,705 | $1.89 | 26d | 1 | 1.45mi |
| 7311 Huntington Square Ln Citrus Heights, CA | 2.0 | 1.0 | 975 | $1,955 | $2.01 | 4d | 5 | 1.48mi |
| 6635 Sylvan Rd Citrus Heights, CA | 1.0–2.0 | 1.0–2.0 | 865 | $2,120 | $2.45 | 9d | 8 | 1.50mi |
Listing history 16 events
-
2026-06-22days on market $164,000 Active 41 DOM
-
2026-06-21days on market $164,000 Active 40 DOM
-
2026-06-18days on market $164,000 Active 37 DOM
-
2026-06-17days on market $164,000 Active 36 DOM
-
2026-06-16days on market $164,000 Active 35 DOM
-
2026-06-15days on market $164,000 Active 34 DOM
-
2026-06-13days on market $164,000 Active 32 DOM
-
2026-06-13pricedays on market $164,000 Active 31 DOM
-
2026-06-09days on market $169,000 Active 28 DOM
-
2026-06-08days on market $169,000 Active 27 DOM
-
2026-06-07days on market $169,000 Active 26 DOM
-
2026-06-05days on market $169,000 Active 23 DOM
-
2026-06-03days on market $169,000 Active 22 DOM
-
2026-06-02days on market $169,000 Active 21 DOM
-
2026-06-01days on market $169,000 Active 20 DOM
-
2026-05-31days on market $169,000 Active 19 DOM
ⓘ Source: listings_history table (triggers on properties + properties_extension) + one-shot
backfill from property_details.listing_events for pre-trigger history.
Climate risk First Street
- Flood 1/10 Low FEMA zone X (unshaded) · 0% chance over 30 yrs
- Wildfire 1/10 Low
- Heat 7/10 Severe 7 d/yr ≥102°F today · 16 d/yr by 30 yrs out
- Wind 1/10 Low
- Air quality 10/10 Extreme 34 unhealthy d/yr today · 36 by 30 yrs out
Nearby sold comps map
Loading sold comps map…
Walkable amenities ~0.75 mi
Loading nearby amenities…
Taxation est. · year 1
- Rental income
- $26,374
- − Mortgage interest
- −$9,187
- − Property taxes
- −$2,460
- − Insurance
- −$820
- − Repairs & maintenance
- −$2,110
- − Management
- −$2,110
- − Depreciation
- −$4,771
- Taxable income
- $4,916
- Est. tax owed @ 24.0%
- −$1,180
- After-tax cash flow
- $6,055/yr
For passive investors: Depreciation is non-cash, so a rental often shows a tax loss while cash-flowing — sheltering income. Rental losses are passive: they offset passive income freely, and up to $25,000/yr can offset ordinary (W-2) income if you actively participate and your MAGI is under $100k (phasing out to $0 by $150k); unused losses carry forward. On sale, claimed depreciation is recaptured at up to 25%, and gains may owe capital-gains tax (a 1031 exchange can defer both). Figures are a year-1 estimate at your 24.0% rate — not tax advice; consult a CPA.
Schools (NCES district)
- District
- San Juan Unified
- NCES district ID
- 0634620
- Math proficiency
- 40% ▲ 3.00%
- Reading proficiency
- 62% ▲ 16.00%
- Median HH income
- $55,655
- Composite
- 44.07/100
- National rank
- #2878
- State rank
- #138 of 517 in CA
Livability — Citrus Heights
- Score
- 60/100
- State rank
- #614
- US rank
- #19580
Category grades
Schools grade is shown separately in the Schools card above.
Census & demographics
- Census place
- Citrus Heights, CA
- County
- Sacramento County · 1,539,646 people
- City population
- 89,370
- Metro
- Sacramento-Roseville-Folsom, CA
- Population (ZIP)
- 42,442
- Household income
- $80,901
- Rent vs Own
- Severe rent burden
- 1854.0
Population outlook (Sacramento County) Hauer SSP2
- Today (2025)
- 1,660,763 people
- By 2030
- 1,732,990 · +4.3%
- By 2040
- 1,855,755 · +11.7%
- By 2050
- 1,941,335 · +16.9%
- By 2075
- 2,046,162 · +23.2%
- By 2100
- 1,961,444 · +18.1%
Race, ethnicity, and origin ACS 2023
- Neighborhood character
- Predominantly White (66%)
- Race & ethnicity
- White 66% Hispanic / Latino 19% Two or more races 11% Asian 6% Black 2%
- Hispanic origin (detail)
- Mexican 16%
- Common ancestry
- Subsaharan African 3% Lithuanian 3% Scotch-Irish 2%
- Foreign-born
- 15% · Canada, Vietnam
- Languages at home
- 78% English-only · Spanish 10% Russian/Polish/Slavic 6% Other Indo-European 3%
Political lean MEDSL · Sacramento
- 2024 margin
- D (+19.7) · D 58.1% · R 38.4% · Other 3.5%
- 2008→2024 swing
- +0.7pp no change · 2008: 19.0pp · 2024: 19.7pp
- All cycles
- 2024: D+19.7 2020: D+25.3 2016: D+23.7 2012: D+16.3 2008: D+19.0
Not yet ingested
- Civics
- —
Market trends
- HPI YoY
- ▼ -408.14%
- Current HPI
- 351.9333
- Rent YoY
- ▲ 1.90%
- Metro
- Sacramento-Roseville-Folsom, CA
- State GDP YoY
- ▲ 3.21%
- F500 in state
- 116
Industry mix (Fortune 500 HQ in CA)
| Industry | F500 HQs | Revenue |
|---|---|---|
| Technology | 27 | $1,492B |
|
||
| Financial Services | 3 | $174B |
|
||
| Retail | 3 | $44B |
|
||
| Insurance | 3 | $26B |
|
||
| Media / Entertainment | 2 | $115B |
|
||
| Pharmaceuticals / Biotech | 2 | $62B |
|
||
Cash-flow waterfall
monthlySold comps — $/sqft
last 12 mo · ≤1 miLoading sold comps…