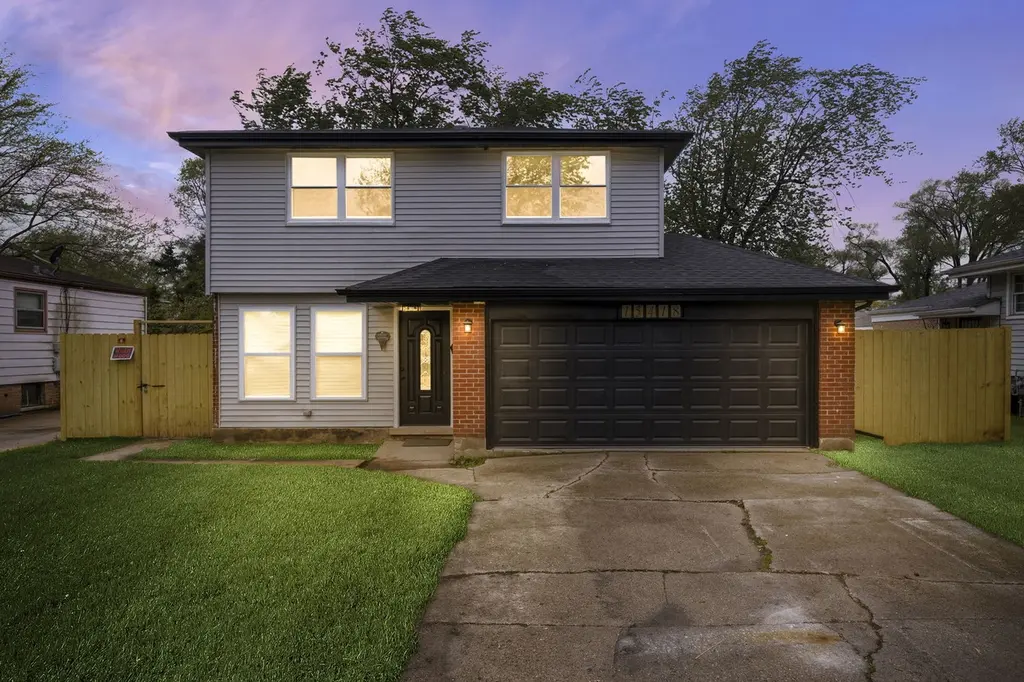
15418 Minerva Ave · Dolton, IL
Flood risk 3/10 · Minor
- FEMA flood zone
- X (unshaded)
- Chance of flooding over 30 yrs
- 0.2%
- Est. flood insurance / yr
- $507 – $1,088
Fire risk 1/10 · Minimal
- Est. fire insurance / yr
- $804 – $1,492
Heat risk 3/10 · Minor
- Hot days now (above 101°F)
- 7 days/yr
- Hot days in 30 yrs
- 15 days/yr
Wind risk 2/10 · Minimal
- Chance of severe wind over 30 yrs
- 0.0%
Air-quality risk 4/10 · Minor
- Unhealthy air days now
- 4 days/yr
- Unhealthy air days in 30 yrs
- 5 days/yr
Risk factors via First Street. Map © Google.
Why this score? — see what drove the D- grade
The composite is a weighted blend of 9 inputs, each scored 0–100. Each bar is that input's sub-score; the figure is the points it added to the 100-point composite (weight × sub-score).
- Cash flow +13.2/30.0
- 1% rule +6.1/10.0
- Rent growth +4.9/5.0
- DSCR +4.0/10.0
- Livability +3.7/5.0
- Condition / age +2.5/5.0
- Schools +0.7/10.0
- ARV discount +0.0/15.0
- Appreciation +0.0/10.0
$225,000
🖨 Deal sheet (PDF) 📄 Offer letter ✓ Due diligence
Listing remarks
$13,000 GRANT AVAILABLE! A fully renovated Cook County Land Bank split-level home nestled one block from the Village of South Holland city limits! This 3 bedroom, 1.5 bath home has been completely transformed from top to bottom! Renovated down to the studs with all new mechanicals (electric, HVAC, and plumbing) including new gas and water lines and hot water tank! Step inside to modern black and white finishes, stunning updated flooring that runs throughout the main level, and a sleek kitchen design complete with white shaker cabinets, stainless steel appliances, and a bold black custom tile backsplash. The kitchen flows seamlessly to the backyard through the added french doors, perfect for
Key facts
- Fully renovated
- Sleek kitchen design
- Updated flooring
Tags
Property features AI
Finance
- Other: Property currently not leased; Possession at closing; Directions: North of 155th St and South of 154th St, West of University Ave and East of Dobson Ave
- HOA & community: No master association fee required
Exterior
- Parking: Attached heated garage; Concrete driveway; 2 garage spaces (4 parking spaces total)
- Utilities: Water source: Lake Michigan; Public sewer
- Home design: Detached single-family home; 1.5-story; Fee simple ownership; Rehab completed in 2026; Built 61–70 years ago; Built before 1978
- Construction: Brick construction
- Exterior features: Lot under 0.25 acre; Lot dimensions: 6400
Interior
- Kitchen: Kitchen on main level
- Bedrooms: 3 bedrooms (master and other bedrooms on the second level)
- Bathrooms: 1 full bath; 1 half bath
- Heating & cooling: Natural gas heating; Central air conditioning
- Interior features: French doors; Some photos virtually staged
- Laundry & utility: Laundry on upper level with a laundry closet
Neighborhood map
What this means for you Summary
Snapshot
- This is a 3-bed/1.5-bath single-family listed at $225k.
Deal economics
- At list price, monthly cash flow is $-4 ($-52/yr) — negative.
- To cash-flow at today's rent, offer at most $224k (0.3% below list).
- Meets the 1% rule at list price ($2k rent vs $225k).
- Recommended offer: $222k (1.5% below list) — sets the bar for market timing.
- Cap rate 6.3% vs local median 9.3% in Dolton — below-typical yield; the buyer is paying a premium for something (appreciation thesis, condition, location) that the cap rate doesn't capture.
Location & tenants
- Location reads 74/100 on livability (#263 in IL, #4,883 nationally) — a middle-class / working-renter tenant base. Strengths: commute A+, cost of living A+, housing A+; Watch: employment C-, health & safety C-, crime D-.
- Thornton Twp Hsd 205 (suburban): math 7% / reading 8% proficiency, ranked #594 of 620 in IL (top 96%) — low school quality limits family demand, transient renter base, plan for 1-2y turnover.
- Zoned schools: New Beginnings Learning Academy (math 2% / reading 8%, grade F, #1,741 of 2,056 statewide, top 93%, 326 students, 0% FRL); Creative Communications Acad (math 2% / reading 2%, grade F, #660 of 665 statewide, top 100%, 177 students, 0% FRL); Thornridge High School (math 8% / reading 8%, grade F, #589 of 693 statewide, top 86%, 1,057 students, 0% FRL).
- Market conditions: Rents rising fast (+9.7%/yr); 129 active listings in the ZIP; 19 comparable units currently listed for rent nearby; rentals leasing fast (median 12d on market — plan ~1-2 weeks tenant-placement turnaround); 6,272 units permitted in Cook County in 2024 (4,658 in 5+ unit buildings).
- At $2,499/mo this rent would consume 52% of the median local household income ($58k/yr) (locally 919% of renters already pay >50% of income on rent) — very limited rent-growth headroom before tenants either downsize or default.
Forward outlook
- Local home prices are declining (-3.0%/yr); year-one equity from $2k of loan paydown is wiped out by about $7k of value loss. Plan a longer hold.
Negotiation context
- It's been on market 16 days — a 2% lower offer ($222k) is reasonable based on typical stale-listing flexibility.
- Current owner paid $54k; list at $225k implies a 313% gain — meaningful room to come down on a strong offer.
Risks & watch-outs
- Watch-outs: property tax is 3.8% of price; built in 1959 — expect roof / HVAC / electrical / plumbing capex.
Questions for the listing agent
- What do current leases actually rent for vs. the listed asking? Can we see a recent rent roll and the last 12 months of T-12 income?
- Built in 1959 — when were the roof, HVAC, electrical panel, plumbing, and water heater last replaced?
- Property tax is high relative to price — has the assessment been appealed recently, and will the sale trigger a re-assessment?
- Is there a deadline driving the sale (1031 exchange, divorce, estate, relocation)? That informs how much negotiation room exists.
- Schools are F-rated, which usually means shorter tenancies and higher turnover. Who's the typical renter profile here, and what's been the actual vacancy rate?
- Crime grade is D in this area — have there been break-ins, vandalism, or insurance claims at this property in the last 3 years? What carrier currently insures it and at what premium?
- The area grade is low — what's the realistic commute time and amenity access for the typical tenant pool here? Any planned neighborhood developments (good or bad) we should know about?
- What's the average days-on-market for RENTAL listings here right now (not sales)? A rising rental-DOM trend means longer vacancies and softer asking-rent achievability than the comps imply.
- What's the recent tenant-quality profile in this submarket — average credit score on applications, eviction rate, late-payment / NSF rate, and stable-employment percentage? A property-management company in the area should have these aggregated.
- How much new for-sale + rental construction is in the pipeline within 1–3 miles? Heavy new supply typically softens prices + rents 12–24 months out; constrained supply supports both.
Investment metrics
- 1% rule
- 1.11% ✓
- Cap rate
- 6.27%
- Cash-on-cash
- -0.08%
- DSCR
- 1.00
- GRM
- 7.5
CMA / ARV
- ARV (on-the-fly)
- $162,266
- Comps found
- 12
Show comp detail 12 sales within ~0.75 mi
| Address | Dist | Beds/Ba | Sqft | Sold | Price | $/sf | Match |
|---|---|---|---|---|---|---|---|
| 15539 Minerva Ave | 0.17mi | 3/1.5 | 1,050 (+2%) | 2mo | $134,000 | $128 | 87 |
| 15722 Woodlawn East Ave | 0.39mi | 3/1.5 | 1,015 (-1%) | 1mo | $101,000 | $100 | 79 |
| 15634 Avalon Ave | 0.32mi | 4/1.5 (+1) | 1,029 (+0%) | 1mo | $115,000 | $112 | 78 |
| 1340 Prince Dr | 0.31mi | 3/2.0 | 1,066 (+4%) | 2mo | $160,000 | $150 | 76 |
| 1138 E 151st St | 0.46mi | 3/1.5 | 1,056 (+3%) | 2mo | $210,000 | $199 | 72 |
| 15509 Rose Dr | 0.43mi | 2/1.0 (-1) | 1,100 (+7%) | 1mo | $135,000 | $123 | 61 |
| 717 E 154th St | 0.46mi | 3/1.0 | 1,120 (+9%) | 2mo | $177,000 | $158 | 60 |
| 15310 Oak St | 0.70mi | 4/1.5 (+1) | 1,037 (+1%) | 1mo | $190,000 | $183 | 60 |
| 15503 Park Ln | 0.63mi | 3/2.0 | 968 (-6%) | 0mo | $170,000 | $176 | 59 |
| 14927 Cottage Grove Ave | 0.69mi | 3/2.0 | 1,095 (+7%) | 1mo | $250,000 | $228 | 54 |
| 15043 Meadow Ln | 0.52mi | 3/1.0 | 1,151 (+12%) | 1mo | $130,000 | $113 | 53 |
| 16001 Avalon Ave | 0.72mi | 4/2.0 (+1) | 1,136 (+11%) | 1mo | $187,500 | $165 | 41 |
Match score weights: distance 35% · size 25% · config 20% · recency 20%. Top-matched comps best support the ARV.
Projected returns pro-forma
-3.0% appreciation · 8.0% rent growth · sell at horizon
- IRR
- -9.5%
- Equity multiple
- 0.63×
- Total profit
- $-23,230
- Equity at exit
- $33,548
- IRR
- 6.8%
- Equity multiple
- 1.65×
- Total profit
- $40,746
- Equity at exit
- $19,454
Cash invested: $63,000 (down + closing). Projections, not guarantees.
Landlord ↔ Tenant lean methodology
- Overall (STATE)
- 43 Moderately Tenant-Leaning
- State Illinois
- 43 Moderately Tenant-Leaning · D+7
- County
- — inherits STATE
- City
- — inherits STATE
ZIP-level market 60419
- Home prices YoY
- -25.7%
- Rents YoY
- 9.7%
- Active inventory
- 129
- Price-to-rent
- 7.5×
Monthly cashflow live
- Estimated rent
- $2,499 high interval (Pro) →
- Mortgage (P&I)
- −$1,180
- Tax from tax record
- −$705 /mo · $8,463/yr
- Insurance
- −$94
- HOA
- −$0
- Vacancy / Maint / Mgmt
- −$525
- Net cashflow
- $-4
Break-even live
Sensitivity live
| Price | -10% $123 | -5% $59 | +0% $-4 | +5% $-68 | +10% $-132 |
|---|---|---|---|---|---|
| Rent | -10% $-202 | -5% $-103 | +0% $-4 | +5% $94 | +10% $193 |
| Rate | -1.0pp $109 | -0.5pp $53 | base $-4 | +0.5pp $-63 | +1.0pp $-122 |
UW: 25.0% down · 7.5% · 30yr · 1.5% tax · 5.0% vac · 8.0% maint · 8.0% mgmt
Financing live
Cash to close
- Down payment
- $56,250
- Closing costs
- $6,750
- Reserves months
- —
- Total cash needed
- —
Loan-product check · same deal, 3 products live
Conventional
25% down · 7.5% · 30yr
- Down + closing
- —
- Monthly P&I
- —
- Monthly cashflow
- —
- DSCR
- —
- Eligible?
- —
Personal DTI + credit; lowest rate.
DSCR
20% down · 8.5% · 30yr
- Down + closing
- —
- Monthly P&I
- —
- Monthly cashflow
- —
- DSCR
- —
- Eligible?
- —
No personal income docs; deal must DSCR.
Hard money
10% down · 12.0% · 12mo
- Down + closing
- —
- Monthly P&I
- —
- Monthly cashflow
- —
- DSCR
- —
- Eligible?
- —
Short-term bridge; refi at stabilization.
Rent comps 19 comps
| Address | Beds | Baths | Sqft | Rent | $/sqft | DOM | Units | Dist |
|---|---|---|---|---|---|---|---|---|
| 15231 Hastings Dr Dolton, IL | 4.0 | 1.5 | 1487 | $2,146 | $1.44 | 9d | 1 | 0.29mi |
| 15509 Park Ln South Holland, IL | 4.0 | 1.5 | 1200 | $3,400 | $2.83 | 26d | 1 | 0.63mi |
| 15509 Park Ln South Holland, IL | 4.0 | 1.5 | 1200 | $3,400 | $2.83 | 9d | 1 | 0.63mi |
| 16001 Avalon Ave South Holland, IL | 3.0 | 2.0 | 1136 | $3,330 | $2.93 | 8d | 1 | 0.75mi |
| 14916 Langley Ave Dolton, IL | 3.0 | 1.5 | 1418 | $2,500 | $1.76 | 26d | 1 | 0.78mi |
| 15238 Doctor Martin Luther King Junior Dr Unit 2W Dolton, IL | 2.0 | 1.0 | 800 | $1,500 | $1.88 | 12d | 1 | 0.89mi |
| 14817 Champlain Ave Dolton, IL | 2.0 | 1.0 | 980 | $2,430 | $2.48 | 23d | 1 | 0.90mi |
| 14716 Dorchester Ave Dolton, IL | 3.0 | 2.0 | 1250 | $2,800 | $2.24 | 21d | 1 | 0.94mi |
| 14738 Blackstone Ave Dolton, IL | 3.0 | 1.0 | 1017 | $2,400 | $2.36 | 12d | 1 | 0.96mi |
| 660 Clyde Ave Calumet City, IL | 3.0 | 1.5 | 1400 | $1,750 | $1.25 | 5d | 1 | 1.02mi |
| 16246 Dobson Ave South Holland, IL | 3.0 | 2.0 | 1250 | $3,170 | $2.54 | 0d | 1 | 1.07mi |
| 409 Madison Ave Unit 2 Calumet City, IL | 3.0 | 1.5 | 1200 | $1,795 | $1.50 | 5d | 1 | 1.10mi |
| 14610 Blackstone Ave Dolton, IL | 3.0 | 1.0 | 1017 | $2,400 | $2.36 | 8d | 1 | 1.12mi |
| 659 Paxton Ave Calumet City, IL | 3.0 | 2.0 | 1255 | $2,461 | $1.96 | 12d | 1 | 1.17mi |
| 14433 Woodlawn Ave Dolton, IL | 4.0 | 2.0 | 1300 | $2,000 | $1.54 | 20d | 1 | 1.20mi |
| 14500 Cottage Grove Ave Unit 3 Dolton, IL | 2.0 | 1.0 | 1000 | $1,475 | $1.48 | 26d | 1 | 1.23mi |
| 405 Clyde Ave Calumet City, IL | 3.0 | 1.0 | 973 | $2,300 | $2.36 | 0d | 1 | 1.25mi |
| 1860 State St Calumet City, IL | 3.0 | 1.0 | 1100 | $1,800 | $1.64 | 19d | 1 | 1.49mi |
| 14305 Irving Ave Unit 2 Dolton, IL | 3.0 | 1.0 | 1100 | $2,200 | $2.00 | 26d | 1 | 1.50mi |
Listing history 19 events
-
2026-06-21days on market $225,000 Active 16 DOM
-
2026-06-18days on market $225,000 Active 13 DOM
-
2026-06-17days on market $225,000 Active 12 DOM
-
2026-06-16days on market $225,000 Active 11 DOM
-
2026-06-15days on market $225,000 Active 10 DOM
-
2026-06-13days on market $225,000 Active 8 DOM
-
2026-06-13days on market $225,000 Active 7 DOM
-
2026-06-09days on market $225,000 Active 4 DOM
-
2026-06-08days on market $225,000 Active 3 DOM
-
2026-06-07pricedays on market $225,000 Active 2 DOM
-
2026-06-04days on market $230,000 Active 34 DOM
-
2026-06-03days on market $230,000 Active 33 DOM
-
2026-06-02days on market $230,000 Active 32 DOM
-
2026-06-01days on market $230,000 Active 31 DOM
-
2026-05-31days on market $230,000 Active 30 DOM
-
2026-05-01historical
-
2026-05-01$230,000 Active
-
1984-09-21soldstatus $54,500
-
1984-09-01soldstatus $54,500
ⓘ Source: listings_history table (triggers on properties + properties_extension) + one-shot
backfill from property_details.listing_events for pre-trigger history.
Tax reassessment forecast IL · Partial reset (capped growth)
- Current annual tax
- $8,463 · $705/mo
- Projected year-2 tax
- $8,463 · $705/mo
- Expected delta
- $0/yr ($0/mo · 0.0%)
ⓘ Screening estimate from a state-policy table — verify with the county assessor before closing.
Climate risk First Street
- Flood 3/10 Moderate FEMA zone X (unshaded) · 20% chance over 30 yrs
- Wildfire 1/10 Low
- Heat 3/10 Moderate 7 d/yr ≥101°F today · 15 d/yr by 30 yrs out
- Wind 2/10 Low 0% chance of damaging wind over 30 yrs
- Air quality 4/10 Moderate 4 unhealthy d/yr today · 5 by 30 yrs out
Nearby sold comps map
Loading sold comps map…
Walkable amenities ~0.75 mi
Loading nearby amenities…
Taxation est. · year 1
- Rental income
- $29,994
- − Mortgage interest
- −$12,603
- − Property taxes
- −$8,463
- − Insurance
- −$1,125
- − Repairs & maintenance
- −$2,399
- − Management
- −$2,399
- − Depreciation
- −$6,545
- Taxable loss
- −$3,542
- Est. tax savings @ 24.0%
- +$850
- After-tax cash flow
- $798/yr
For passive investors: Depreciation is non-cash, so a rental often shows a tax loss while cash-flowing — sheltering income. Rental losses are passive: they offset passive income freely, and up to $25,000/yr can offset ordinary (W-2) income if you actively participate and your MAGI is under $100k (phasing out to $0 by $150k); unused losses carry forward. On sale, claimed depreciation is recaptured at up to 25%, and gains may owe capital-gains tax (a 1031 exchange can defer both). Figures are a year-1 estimate at your 24.0% rate — not tax advice; consult a CPA.
Schools (NCES district)
- District
- Thornton Twp Hsd 205
- NCES district ID
- 1738970
- Math proficiency
- 7% ▬ 0.00%
- Reading proficiency
- 8% ▼ -2.00%
- Median HH income
- $43,392
- Composite
- 6.92/100
- National rank
- #9976
- State rank
- #594 of 620 in IL
Livability — Dolton
- Score
- 74/100
- State rank
- #263
- US rank
- #4883
Category grades
Schools grade is shown separately in the Schools card above.
Census & demographics
- Census place
- Dolton, IL
- County
- Cook County · 4,486,803 people
- City population
- 20,825
- Metro
- Chicago-Naperville-Elgin, IL-IN-WI
- Population (ZIP)
- 20,825
- Household income
- $57,887
- Rent vs Own
- Severe rent burden
- 919.0
Population outlook (Cook County) Hauer SSP2
- Today (2025)
- 5,347,519 people
- By 2030
- 5,357,703 · +0.2%
- By 2040
- 5,324,924 · -0.4%
- By 2050
- 5,230,762 · -2.2%
- By 2075
- 4,785,735 · -10.5%
- By 2100
- 4,188,836 · -21.7%
Race, ethnicity, and origin ACS 2023
- Neighborhood character
- Predominantly Black (91%)
- Race & ethnicity
- Black 91% White 4% Two or more races 3% Hispanic / Latino 1%
- Common ancestry
- Romanian 1% Hispanic 1%
- Foreign-born
- 3% · Canada
- Languages at home
- 95% English-only · French/Haitian/Cajun 2% Spanish 1%
Political lean MEDSL · Cook
- 2024 margin
- Solid D (+42.0) · D 70.4% · R 28.4% · Other 1.2%
- 2008→2024 swing
- -11.4pp toward R · 2008: 53.4pp · 2024: 42.0pp
- All cycles
- 2024: D+42.0 2020: D+50.3 2016: D+53.0 2012: D+49.4 2008: D+53.4
Not yet ingested
- Civics
- —
Market trends
- HPI YoY
- ▼ -66.88%
- Current HPI
- 193.2346
- Rent YoY
- ▲ 9.65%
- Metro
- Chicago-Naperville-Elgin, IL-IN-WI
- State GDP YoY
- ▲ 1.59%
- F500 in state
- 60
Industry mix (Fortune 500 HQ in IL)
| Industry | F500 HQs | Revenue |
|---|---|---|
| Insurance | 4 | $201B |
|
||
| Consumer Goods | 4 | $87B |
|
||
| Industrial Machinery | 3 | $64B |
|
||
| Healthcare | 2 | $55B |
|
||
| Retail / Pharmacy | 1 | $148B |
|
||
| Agriculture / Food | 1 | $86B |
|
||
Price history
+322.0% since first listed4 events — show timeline
- 2026-05-01 Listed $230,000 MRED as Distributed by MLS Grid
- 2026-05-01 Listing Removed — MRED as Distributed by MLS Grid
- 1984-09-21 Sold (Public Records) $54,500 Public Records
- 1984-09-01 Sold (Public Records) $54,500 Public Records
Property tax history
+5.5%/yrLatest (2023): $8,463 · -7.1% YoY. Source: county tax records.
Cash-flow waterfall
monthlySold comps — $/sqft
last 12 mo · ≤1 miLoading sold comps…