900 Old Stockton Rd #127 · Oakdale, CA
Flood risk 1/10 · Minimal
- FEMA flood zone
- X (unshaded)
- Chance of flooding over 30 yrs
- 0.0%
- Est. flood insurance / yr
- $507 – $1,088
Fire risk 7/10 · Major
- Est. fire insurance / yr
- $659 – $1,223
Heat risk 7/10 · Major
- Hot days now (above 103°F)
- 7 days/yr
- Hot days in 30 yrs
- 15 days/yr
Wind risk 1/10 · Minimal
- Chance of severe wind over 30 yrs
- —
Air-quality risk 10/10 · Severe
- Unhealthy air days now
- 34 days/yr
- Unhealthy air days in 30 yrs
- 35 days/yr
Risk factors via First Street. Map © Google.
Why this score? — see what drove the B+ grade
The composite is a weighted blend of 9 inputs, each scored 0–100. Each bar is that input's sub-score; the figure is the points it added to the 100-point composite (weight × sub-score).
- Cash flow +30.0/30.0
- ARV discount +15.0/15.0
- 1% rule +10.0/10.0
- DSCR +10.0/10.0
- Condition / age +4.0/5.0
- Schools +3.2/10.0
- Livability +3.2/5.0
- Rent growth +2.5/5.0
- Appreciation +0.0/10.0
$89,900
🖨 Deal sheet 📄 Offer letter ✓ Due diligence
Listing remarks
Complete remodel updated 3/2 with expando - double size lot. Must see move in ready tankless water heater. Won't last long. All Family park.
Key facts
- Move in ready
- Double size lot
- 2 parking spots
Tags
Property features AI
Finance
- Other: Located in River Paradise Mobile Home Park (address: 900 Old Stockton Rd #127, Oakdale, CA 95361); Directions: Use GPS or Yosemite Ave North, turn East to A St, turn North on Old Stockton Rd to River Paradise Mobile Home Park — home is straight back on left side
- HOA & community: No association; Not a senior community; Land lease: No (listed land lease amount present)
Exterior
- Parking: Off-street parking
- Utilities: Gas plumbed; Individual electric meter; Individual gas meter; 220V outlet in laundry; Public water; Sewer: other
- Home design: Manufactured in park; Single wide; Built in 1978; Made by Fleetwood (90005 Fleetwood Homes Inc); Wood skirting
- Construction: Composition roof; Wood skirting; Manufactured single-wide construction
- Exterior features: Composition roof; Shed(s) on property; No notable lot features
Interior
- Kitchen: Built-in gas range; Dishwasher; Microwave
- Bedrooms: 3 bedrooms
- Flooring: Laminate flooring
- Bathrooms: 2 full bathrooms; Double sinks; Shower stall(s)
- Heating & cooling: Central heating; Central cooling
- Interior features: Updated/remodeled interior; Great room living area; Kitchen and family room combined; Breakfast area; Synthetic countertops; Covered patio and porch steps; Dual-pane full windows
- Laundry & utility: Indoor laundry room; Tankless water heater
Neighborhood map
What this means for you Summary
Snapshot
- This is a 3-bed/2.0-bath manufactured listed at $90k. Condition is rated good.
Deal economics
- At list price, monthly cash flow is $1k ($13k/yr) — positive.
- The deal already cash-flows at list — no discount required.
- Meets the 1% rule at list price ($2k rent vs $90k).
- Cap rate 20.4% vs local median 2.7% in Oakdale — top-decile yield for the area; either an underpriced asset or a hidden risk that comps aren't pricing in. Stress-test before assuming the spread holds.
Location & tenants
- Location reads 64/100 on livability (#412 in CA) — a middle-class / working-renter tenant base. Strengths: housing A+, health & safety B; Watch: commute F, cost of living F.
- Oakdale Joint Unified (suburban): math 27% / reading 45% proficiency, ranked #256 of 517 in CA (top 50%) — families likely to look elsewhere, expect single-tenant / working-renter base with shorter leases.
- Market conditions: 199 active listings in the ZIP; 12 comparable units currently listed for rent nearby; rentals leasing fast (median 14d on market — plan ~1-2 weeks tenant-placement turnaround); solid renter incomes; 923 units permitted in Stanislaus County in 2024 (63 in 5+ unit buildings).
Forward outlook
- Local home prices are declining (-3.0%/yr); year-one equity from $622 of loan paydown is wiped out by about $3k of value loss. Plan a longer hold.
- Stanislaus County population projected at +14% by 2050 — modest demand growth; plan on rents tracking national, not racing it.
- At projected returns (-3.0% appreciation + 3.0% rent growth), your $25k cash investment doubles in ~3 years — after that, you're playing with house money.
Negotiation context
- Only 1 days on market — expect competitive offers; lowballing is unlikely to land.
Risks & watch-outs
- Climate carrying-cost: major wildfire risk; extreme-heat days projected 7→15/yr by 2055 (HVAC capex compounding) — expect insurance premiums to compound above CPI over the hold.
Questions for the listing agent
- Built in 1978 — when were the roof, HVAC, electrical panel, plumbing, and water heater last replaced?
- Is there a deadline driving the sale (1031 exchange, divorce, estate, relocation)? That informs how much negotiation room exists.
- What's the average days-on-market for RENTAL listings here right now (not sales)? A rising rental-DOM trend means longer vacancies and softer asking-rent achievability than the comps imply.
- What's the recent tenant-quality profile in this submarket — average credit score on applications, eviction rate, late-payment / NSF rate, and stable-employment percentage? A property-management company in the area should have these aggregated.
- How much new for-sale + rental construction is in the pipeline within 1–3 miles? Heavy new supply typically softens prices + rents 12–24 months out; constrained supply supports both.
Investment metrics
- 1% rule
- 2.36% ✓
- Cap rate
- 20.42%
- Cash-on-cash
- 50.45%
- DSCR
- 3.24
- GRM
- 3.5
CMA / ARV
- ARV (on-the-fly)
- $160,308
- Comps found
- 7
Show comp detail 7 sales within ~0.75 mi
| Address | Dist | Beds/Ba | Sqft | Sold | Price | $/sf | Match |
|---|---|---|---|---|---|---|---|
| 900 Old Stockton #506 Rd #506 | 0.02mi | 2/2.0 (-1) | 1,107 (+1%) | 5mo | $140,000 | $126 | 88 |
| 900 Old Stockton Rd #511 | 0.03mi | 3/2.0 | 1,167 (+6%) | 2mo | $197,000 | $169 | 86 |
| 900 Old Stockton Rd #541 | 0.08mi | 2/2.0 (-1) | 1,034 (-6%) | 6mo | $170,000 | $164 | 76 |
| 900 Old Stockton Rd #104 | 0.03mi | 3/2.0 | 1,213 (+10%) | 8mo | $135,000 | $111 | 74 |
| 900 Old Stockton Rd #501 | 0.01mi | 2/2.0 (-1) | 1,034 (-6%) | 13mo | $150,500 | $146 | 74 |
| 900 Old Stockton Rd #203 | 0.02mi | 2/2.0 (-1) | 990 (-10%) | 8mo | $120,000 | $121 | 71 |
| 900 Old Stockton Rd #551 | 0.02mi | 2/2.0 (-1) | 960 (-13%) | 15mo | $145,000 | $151 | 61 |
Match score weights: distance 35% · size 25% · config 20% · recency 20%. Top-matched comps best support the ARV.
Projected returns pro-forma
-3.0% appreciation · 3.0% rent growth · sell at horizon
- IRR
- 48.2%
- Equity multiple
- 3.10×
- Total profit
- $52,870
- Equity at exit
- $13,404
- IRR
- 53.8%
- Equity multiple
- 6.28×
- Total profit
- $132,963
- Equity at exit
- $7,773
Cash invested: $25,172 (down + closing). Projections, not guarantees.
Landlord ↔ Tenant lean methodology
- Overall (STATE)
- 18 Strongly Tenant-Friendly
- State California
- 18 Strongly Tenant-Friendly · D+13
- County
- — inherits STATE
- City
- — inherits STATE
ZIP-level market 95361
- Active inventory
- 199
- Price-to-rent
- 3.5×
Monthly cashflow live
- Estimated rent
- $2,126 high interval (Pro) →
- Mortgage (P&I)
- −$471
- Tax est. 1.5%
- −$112 /mo · $1,348/yr
- Insurance
- −$37
- HOA
- −$0
- Vacancy / Maint / Mgmt
- −$446
- Net cashflow
- $1,058
Break-even live
UW: 25.0% down · 7.5% · 30yr · 1.5% tax · 5.0% vac · 8.0% maint · 8.0% mgmt
Financing live
Cash to close
- Down payment
- $22,475
- Closing costs
- $2,697
- Reserves months
- —
- Total cash needed
- —
Loan-product check · same deal, 3 products live
Conventional
25% down · 7.5% · 30yr
- Down + closing
- —
- Monthly P&I
- —
- Monthly cashflow
- —
- DSCR
- —
- Eligible?
- —
Personal DTI + credit; lowest rate.
DSCR
20% down · 8.5% · 30yr
- Down + closing
- —
- Monthly P&I
- —
- Monthly cashflow
- —
- DSCR
- —
- Eligible?
- —
No personal income docs; deal must DSCR.
Hard money
10% down · 12.0% · 12mo
- Down + closing
- —
- Monthly P&I
- —
- Monthly cashflow
- —
- DSCR
- —
- Eligible?
- —
Short-term bridge; refi at stabilization.
Rent comps 12 comps
| Address | Beds | Baths | Sqft | Rent | $/sqft | DOM | Units | Dist |
|---|---|---|---|---|---|---|---|---|
| 243 Meadowlark Ln Oakdale, CA | 2.0 | 1.5 | 932 | $2,227 | $2.39 | 13d | 1 | 0.23mi |
| 861 Cloverland Way Oakdale, CA | 3.0 | 2.0 | 1322 | $2,150 | $1.63 | 13d | 1 | 0.25mi |
| 405 N 1st Ave Oakdale, CA | 3.0 | 2.0 | 1500 | $2,250 | $1.50 | 13d | 1 | 0.53mi |
| 730 Walnut St Oakdale, CA | 3.0 | 2.0 | 1392 | $2,500 | $1.80 | 13d | 1 | 0.62mi |
| 333 Poplar St Oakdale, CA | 2.0 | 1.0–1.5 | 877 | $1,575 | $1.79 | 13d | 3 | 0.80mi |
| 333 Poplar St Oakdale, CA | 2.0 | 1.0–1.5 | 877 | $1,575 | $1.79 | 21d | 3 | 0.80mi |
| 313 S 2nd Ave Oakdale, CA | 2.0 | 1.0 | 800 | $1,500 | $1.88 | 13d | 1 | 0.97mi |
| 325 W H St Oakdale, CA | 2.0 | 1.0 | 700 | $1,475 | $2.11 | 43d | 1 | 1.03mi |
| 425 S 3rd Ave Unit A Oakdale, CA | 3.0 | 1.0 | 1027 | $1,600 | $1.56 | 13d | 1 | 1.06mi |
| 1253 Caballero St Unit 1253 Oakdale, CA | 3.0 | 2.5 | 1300 | $2,300 | $1.77 | 13d | 1 | 1.18mi |
| 150 S Wood Ave Unit 214W Oakdale, CA | 2.0 | 1.0 | 981 | $1,703 | $1.74 | 43d | 1 | 1.29mi |
| 150 S Wood Ave Unit 117W Oakdale, CA | 2.0 | 1.0 | 981 | $1,732 | $1.77 | 43d | 1 | 1.29mi |
Listing history 2 events
-
2026-06-17remarks 140-char remark
-
2026-06-17$89,900 Active 1 DOM
ⓘ Source: listings_history table (triggers on properties + properties_extension) + one-shot
backfill from property_details.listing_events for pre-trigger history.
Climate risk First Street
- Flood 1/10 Low FEMA zone X (unshaded) · 0% chance over 30 yrs
- Wildfire 7/10 Severe
- Heat 7/10 Severe 7 d/yr ≥103°F today · 15 d/yr by 30 yrs out
- Wind 1/10 Low
- Air quality 10/10 Extreme 34 unhealthy d/yr today · 35 by 30 yrs out
Nearby sold comps map
Loading sold comps map…
Walkable amenities ~0.75 mi
Loading nearby amenities…
Taxation est. · year 1
- Rental income
- $25,513
- − Mortgage interest
- −$5,036
- − Property taxes
- −$1,348
- − Insurance
- −$450
- − Repairs & maintenance
- −$2,041
- − Management
- −$2,041
- − Depreciation
- −$2,615
- Taxable income
- $11,982
- Est. tax owed @ 24.0%
- −$2,876
- After-tax cash flow
- $9,824/yr
For passive investors: Depreciation is non-cash, so a rental often shows a tax loss while cash-flowing — sheltering income. Rental losses are passive: they offset passive income freely, and up to $25,000/yr can offset ordinary (W-2) income if you actively participate and your MAGI is under $100k (phasing out to $0 by $150k); unused losses carry forward. On sale, claimed depreciation is recaptured at up to 25%, and gains may owe capital-gains tax (a 1031 exchange can defer both). Figures are a year-1 estimate at your 24.0% rate — not tax advice; consult a CPA.
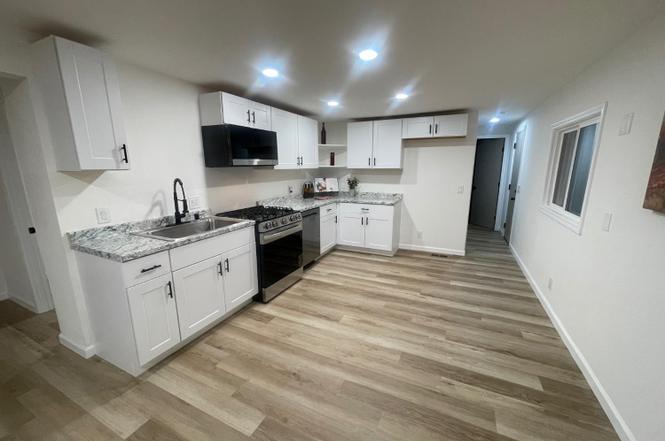
Condition & rehab AI · 2 photos
This home is move-in ready with a complete remodel, featuring new kitchen, bathrooms, flooring, and exterior. It has a good condition score and is ready for a new owner or tenant.
Value-add opportunities
- Both Painting exterior and interior walls — Enhances curb appeal and interior aesthetics.
- Both Landscaping improvements — Enhances curb appeal and adds value.
- Both Add a small front porch or bench — Improves curb appeal and adds functionality for outdoor seating or relaxation.
Renovation cost estimate screening
Value-add ROI direction
- Both Painting exterior and interior walls — Enhances curb appeal and interior aesthetics. ↑
- Both Landscaping improvements — Enhances curb appeal and adds value. ↑
- Both Add a small front porch or bench — Improves curb appeal and adds functionality for outdoor seating or relaxation. ↑
ⓘ Cost ranges are severity-bucket heuristics (US national rule-of-thumb). Get contractor quotes + a written scope before underwriting a rehab budget.
Schools (NCES district)
- District
- Oakdale Joint Unified
- NCES district ID
- 0600062
- Math proficiency
- 27% ▼ -13.00%
- Reading proficiency
- 45% ▼ -7.00%
- Median HH income
- $60,377
- Composite
- 32.1/100
- National rank
- #5805
- State rank
- #256 of 517 in CA
Livability — Oakdale
- Score
- 64/100
- State rank
- #412
- US rank
- #14042
Category grades
Schools grade is shown separately in the Schools card above.
Census & demographics
- Census place
- Oakdale, CA
- County
- Stanislaus County · 445,786 people
- City population
- 34,810
- Metro
- Modesto, CA
- Population (ZIP)
- 34,810
- Household income
- $92,963
- Rent vs Own
- Severe rent burden
- 1276.0
Population outlook (Stanislaus County) Hauer SSP2
- Today (2025)
- 579,493 people
- By 2030
- 598,000 · +3.2%
- By 2040
- 630,930 · +8.9%
- By 2050
- 658,300 · +13.6%
- By 2075
- 712,363 · +22.9%
- By 2100
- 719,805 · +24.2%
Race, ethnicity, and origin ACS 2023
- Neighborhood character
- Majority White (61%)
- Race & ethnicity
- White 61% Hispanic / Latino 30% Two or more races 18% Asian 2%
- Hispanic origin (detail)
- Mexican 25%
- Common ancestry
- Russian 5% Italian 4% Iranian 2%
- Foreign-born
- 11% · Canada, China
- Languages at home
- 80% English-only · Spanish 18% German/W. Germanic 1% Other Indo-European 1%
Political lean MEDSL · Stanislaus
- 2024 margin
- R (+11.0) · D 43.2% · R 54.2% · Other 2.6%
- 2008→2024 swing
- -12.7pp toward R · 2008: 1.7pp · 2024: -11.0pp
- All cycles
- 2024: R+11.0 2020: D+0.8 2016: D+0.6 2012: D+0.7 2008: D+1.7
Not yet ingested
- Civics
- —
Market trends
- HPI YoY
- ▼ -507.52%
- Current HPI
- 283.0924
- Rent YoY
- —
- Metro
- Modesto, CA
- State GDP YoY
- ▲ 3.21%
- F500 in state
- 116
Industry mix (Fortune 500 HQ in CA)
| Industry | F500 HQs | Revenue |
|---|---|---|
| Technology | 27 | $1,492B |
|
||
| Financial Services | 3 | $174B |
|
||
| Retail | 3 | $44B |
|
||
| Insurance | 3 | $26B |
|
||
| Media / Entertainment | 2 | $115B |
|
||
| Pharmaceuticals / Biotech | 2 | $62B |
|
||
Cash-flow waterfall
monthlySold comps — $/sqft
last 12 mo · ≤1 miLoading sold comps…