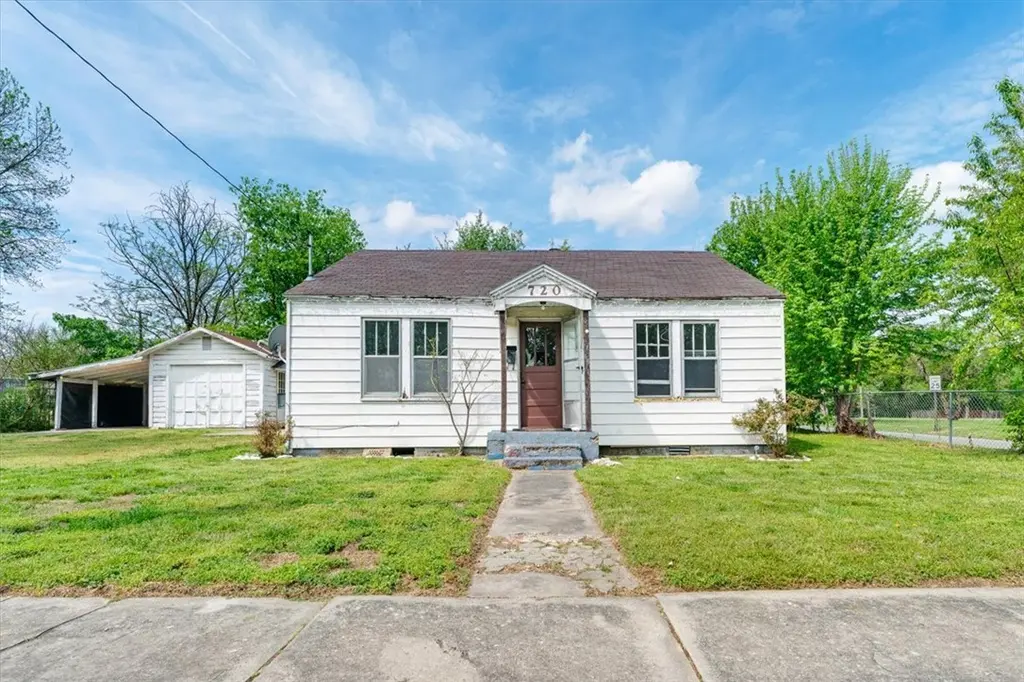
720 Kansas St · Springdale, AR
Flood risk 1/10 · Minimal
- FEMA flood zone
- X (unshaded)
- Chance of flooding over 30 yrs
- 0.0%
- Est. flood insurance / yr
- $507 – $1,088
Fire risk 4/10 · Minor
- Est. fire insurance / yr
- $1,499 – $2,785
Heat risk 5/10 · Moderate
- Hot days now (above 105°F)
- 7 days/yr
- Hot days in 30 yrs
- 20 days/yr
Wind risk 2/10 · Minimal
- Chance of severe wind over 30 yrs
- 2.0%
Air-quality risk 2/10 · Minimal
- Unhealthy air days now
- 1 days/yr
- Unhealthy air days in 30 yrs
- 1 days/yr
Risk factors via First Street. Map © Google.
Why this score? — see what drove the C- grade
The composite is a weighted blend of 9 inputs, each scored 0–100. Each bar is that input's sub-score; the figure is the points it added to the 100-point composite (weight × sub-score).
- Cash flow +17.0/30.0
- ARV discount +15.0/15.0
- DSCR +5.3/10.0
- 1% rule +3.6/10.0
- Livability +3.5/5.0
- Rent growth +3.2/5.0
- Schools +3.1/10.0
- Condition / age +2.5/5.0
- Appreciation +0.0/10.0
$139,900
🖨 Deal sheet (PDF) 📄 Offer letter ✓ Due diligence
Listing remarks MLS
Calling all investors, DIY enthusiasts, and visionary homeowners! Situated on a corner lot in Springdale, this 1944 single-family home offers a rare opportunity to create something special right in town. Whether you’re searching for your next flip, investment property, or a home to customize from the ground up, this property is full of potential and ready for your vision. A true blank canvas with endless possibilities, this is your chance to bring new life to a home in a convenient in-town location. //AGENT OWNED//
Key facts
- In town location
- Corner lot
- 8,712 sq ft lot
Tags
Neighborhood map
What this means for you Summary
Snapshot
- This is a 2-bed/1.0-bath single-family listed at $140k.
Deal economics
- At list price, monthly cash flow is $94 ($1k/yr) — positive.
- The deal already cash-flows at list — no discount required.
- To meet the 1% rule (rent ≥ 1% of price), the offer needs to be $120k (14.1% below list).
- Recommended offer: $120k (14.1% below list) — sets the bar for 1% rule.
- Cap rate 7.1% vs local median 3.2% in Springdale — top-decile yield for the area; either an underpriced asset or a hidden risk that comps aren't pricing in. Stress-test before assuming the spread holds.
Location & tenants
- Location reads 70/100 on livability (#48 in AR) — a middle-class / working-renter tenant base. Strengths: cost of living A+, housing A+, health & safety A+; Watch: commute D+, employment D+, crime D-.
- Springdale School District (urban): math 38% / reading 35% proficiency, ranked #100 of 238 in AR (top 42%) — families likely to look elsewhere, expect single-tenant / working-renter base with shorter leases.
- Zoned schools: Elmdale Elementary School (math 38% / reading 23%, grade F, #298 of 454 statewide, top 67%, 547 students, 88% FRL); Hellstern Middle School (math 57% / reading 56%, grade B, #17 of 201 statewide, top 8%, 781 students, 43% FRL); Har-Ber High School (math 25% / reading 41%, grade F, #115 of 292 statewide, top 40%, 2,274 students, 53% FRL) — zoned schools at 61% FRL track the district average.
- Market conditions: Rents rising (+2.9%/yr); 370 active listings in the ZIP; 40 comparable units currently listed for rent nearby; rentals at typical pace (median 26d on market — plan ~3-4 weeks tenant-placement turnaround); 40% of comp listings sitting > 30 days — soft ceiling on asking rent; 3,494 units permitted in Washington County in 2024 (1,497 in 5+ unit buildings).
Forward outlook
- Local home prices are declining (-3.0%/yr); year-one equity from $967 of loan paydown is wiped out by about $4k of value loss. Plan a longer hold.
- Washington County population projected at +47% by 2050 — long-run rental-demand tailwind backs the buy-and-hold thesis.
Negotiation context
- It's been on market 59 days — a 3% lower offer ($136k) is reasonable based on typical stale-listing flexibility.
- 2 sale attempts with the ask held roughly flat each time — persistent listings suggest the price (not the market) is what's stuck; bring a comps-based counter.
- Current owner paid $110k; 27% above their basis — modest negotiation headroom, anchor on the comps not their cost.
Risks & watch-outs
- Watch-outs: built in 1944 — expect roof / HVAC / electrical / plumbing capex.
- Climate carrying-cost: extreme-heat days projected 7→20/yr by 2055 (HVAC capex compounding) — expect insurance premiums to compound above CPI over the hold.
Questions for the listing agent
- It's been on market 59 days. Have you received any prior offers? Is the seller open to a 14% concession, seller financing, or rate buy-down credit?
- Built in 1944 — when were the roof, HVAC, electrical panel, plumbing, and water heater last replaced?
- Is there a deadline driving the sale (1031 exchange, divorce, estate, relocation)? That informs how much negotiation room exists.
- Schools are D-rated, which usually means shorter tenancies and higher turnover. Who's the typical renter profile here, and what's been the actual vacancy rate?
- Crime grade is D in this area — have there been break-ins, vandalism, or insurance claims at this property in the last 3 years? What carrier currently insures it and at what premium?
- What's the average days-on-market for RENTAL listings here right now (not sales)? A rising rental-DOM trend means longer vacancies and softer asking-rent achievability than the comps imply.
- What's the recent tenant-quality profile in this submarket — average credit score on applications, eviction rate, late-payment / NSF rate, and stable-employment percentage? A property-management company in the area should have these aggregated.
- How much new for-sale + rental construction is in the pipeline within 1–3 miles? Heavy new supply typically softens prices + rents 12–24 months out; constrained supply supports both.
Investment metrics
- 1% rule
- 0.86% ✗
- Cap rate
- 7.10%
- Cash-on-cash
- 2.87%
- DSCR
- 1.13
- GRM
- 9.7
CMA / ARV
- ARV (median comp)
- $205,941
- List price
- $139,900
- Delta
- -32.07%
- Verdict
- UNDERPRICED
- Comps
- 20 within 1.0 mi
Show comp detail 12 sales within ~0.75 mi
| Address | Dist | Beds/Ba | Sqft | Sold | Price | $/sf | Match |
|---|---|---|---|---|---|---|---|
| 414 W Price Ave | 0.42mi | 3/1.0 (+1) | 1,008 (+1%) | 2mo | $228,768 | $227 | 72 |
| 1515 Greenlawn Dr | 0.40mi | 3/1.5 (+1) | 1,025 (+3%) | 1mo | $230,000 | $224 | 68 |
| 500 W Center Ave | 0.43mi | 2/1.0 | 1,092 (+10%) | 1mo | $255,000 | $234 | 63 |
| 401 Price Ave | 0.45mi | 2/1.0 | 1,077 (+8%) | 3mo | $290,000 | $269 | 63 |
| 1513 Greenlawn Dr | 0.40mi | 3/1.0 (+1) | 904 (-9%) | 1mo | $130,000 | $144 | 60 |
| 402 W Center Ave | 0.46mi | 3/1.0 (+1) | 1,064 (+7%) | 3mo | $300,000 | $282 | 60 |
| 1204 W Center Ave | 0.27mi | 3/2.0 (+1) | 1,128 (+13%) | 1mo | $290,000 | $257 | 55 |
| 1620 E Steele Ave | 0.59mi | 3/1.0 (+1) | 992 (-0%) | 14mo | $205,000 | $207 | 55 |
| 710 Mill St | 0.59mi | 2/1.0 | 888 (-11%) | 4mo | $265,000 | $298 | 51 |
| 526 Spring St | 0.62mi | 3/1.0 (+1) | 1,038 (+4%) | 13mo | $176,000 | $170 | 48 |
| 1804 Shelby Ave | 0.63mi | 3/1.0 (+1) | 1,086 (+9%) | 7mo | $225,000 | $207 | 45 |
| 1803 Shelby Ave | 0.63mi | 3/1.0 (+1) | 1,131 (+14%) | 10mo | $220,000 | $195 | 35 |
Match score weights: distance 35% · size 25% · config 20% · recency 20%. Top-matched comps best support the ARV.
Projected returns pro-forma
-3.0% appreciation · 2.87% rent growth · sell at horizon
- IRR
- -11.9%
- Equity multiple
- 0.57×
- Total profit
- $-16,906
- Equity at exit
- $20,860
- IRR
- -3.0%
- Equity multiple
- 0.80×
- Total profit
- $-7,878
- Equity at exit
- $12,096
Cash invested: $39,172 (down + closing). Projections, not guarantees.
Landlord ↔ Tenant lean methodology
- Overall (STATE)
- 92 Strongly Landlord-Friendly
- State Arkansas
- 92 Strongly Landlord-Friendly · R+14
- County
- — inherits STATE
- City
- — inherits STATE
ZIP-level market 72764
- Rents YoY
- 2.9%
- Active inventory
- 370
- Price-to-rent
- 9.7×
Monthly cashflow live
- Estimated rent
- $1,202 high interval (Pro) →
- Mortgage (P&I)
- −$734
- Tax from tax record
- −$64 /mo · $770/yr
- Insurance
- −$58
- HOA
- −$0
- Vacancy / Maint / Mgmt
- −$253
- Net cashflow
- $94
Break-even live
Sensitivity live
| Price | -10% $173 | -5% $133 | +0% $94 | +5% $54 | +10% $15 |
|---|---|---|---|---|---|
| Rent | -10% $-1 | -5% $46 | +0% $94 | +5% $141 | +10% $189 |
| Rate | -1.0pp $164 | -0.5pp $129 | base $94 | +0.5pp $57 | +1.0pp $21 |
UW: 25.0% down · 7.5% · 30yr · 1.5% tax · 5.0% vac · 8.0% maint · 8.0% mgmt
Financing live
Cash to close
- Down payment
- $34,975
- Closing costs
- $4,197
- Reserves months
- —
- Total cash needed
- —
Loan-product check · same deal, 3 products live
Conventional
25% down · 7.5% · 30yr
- Down + closing
- —
- Monthly P&I
- —
- Monthly cashflow
- —
- DSCR
- —
- Eligible?
- —
Personal DTI + credit; lowest rate.
DSCR
20% down · 8.5% · 30yr
- Down + closing
- —
- Monthly P&I
- —
- Monthly cashflow
- —
- DSCR
- —
- Eligible?
- —
No personal income docs; deal must DSCR.
Hard money
10% down · 12.0% · 12mo
- Down + closing
- —
- Monthly P&I
- —
- Monthly cashflow
- —
- DSCR
- —
- Eligible?
- —
Short-term bridge; refi at stabilization.
Rent comps 40 comps
| Address | Beds | Baths | Sqft | Rent | $/sqft | DOM | Units | Dist |
|---|---|---|---|---|---|---|---|---|
| 606 Virginia St Unit 202 Springdale, AR | 3.0 | 1.0 | 740 | $1,025 | $1.39 | 46d | 1 | 0.08mi |
| 606 Virginia St Unit 201 Springdale, AR | 3.0 | 1.0 | 740 | $1,025 | $1.39 | 25d | 1 | 0.08mi |
| 606 Virginia St Apt 102 Springdale, AR | 3.0 | 1.0 | 740 | $1,025 | $1.39 | 16d | 1 | 0.09mi |
| 811 N Pleasant St Apt E Springdale, AR | 1.0 | 1.0 | 560 | $975 | $1.74 | 46d | 1 | 0.11mi |
| 811 N Pleasant St Apt F Springdale, AR | 2.0 | 1.0 | 780 | $1,250 | $1.60 | 46d | 1 | 0.11mi |
| 815 N Pleasant St Unit C Springdale, AR | 2.0 | 1.0 | 700 | $1,250 | $1.79 | 46d | 1 | 0.13mi |
| 610 Sherman St Unit 612 Springdale, AR | 2.0 | 1.0 | 650 | $975 | $1.50 | 25d | 1 | 0.25mi |
| 628 W Price Ave Springdale, AR | 1.0 | 1.5 | 840 | $1,250 | $1.49 | 46d | 1 | 0.37mi |
| 126 Rhodes Ave Springdale, AR | 1.0 | 1.0 | 624 | $900 | $1.44 | 46d | 1 | 0.67mi |
| 202 E Emma Ave Springdale, AR | 2.0 | 1.0 | 740 | $1,650 | $2.23 | 16d | 2 | 0.74mi |
| 400 N Campbell Dr Unit D Springdale, AR | 2.0 | 1.0 | 745 | $925 | $1.24 | 46d | 1 | 0.89mi |
| 2008 Theodore Dr Unit D Springdale, AR | 2.0 | 1.0 | 745 | $925 | $1.24 | 25d | 1 | 0.94mi |
| 329 Berry St Unit 204 Springdale, AR | 2.0 | 1.0 | 923 | $1,050 | $1.14 | 46d | 1 | 0.94mi |
| 329 Berry St Unit 204 Springdale, AR | 2.0 | 1.0 | 923 | $1,050 | $1.14 | 16d | 1 | 0.94mi |
| 1705 N Lowell Rd Springdale, AR | 2.0 | 1.0 | 850 | $1,125 | $1.32 | 46d | 1 | 0.94mi |
| 505 E Emma Ave Springdale, AR | 2.0 | 1.0–2.0 | 885 | $2,261 | $2.55 | 15d | 127 | 0.95mi |
| 305 Berry St Unit 305-204 Springdale, AR | 2.0 | 1.0 | 771 | $1,195 | $1.55 | 46d | 1 | 0.96mi |
| 305 Berry St Unit 305-203 Springdale, AR | 2.0 | 1.0 | 663 | $1,150 | $1.73 | 46d | 1 | 0.96mi |
| 1216 Highland Ave Unit B Springdale, AR | 2.0 | 1.0 | 1100 | $1,200 | $1.09 | 16d | 1 | 0.97mi |
| 100 Josie Pl Unit B Springdale, AR | 3.0 | 2.0 | 990 | $1,350 | $1.36 | 25d | 1 | 1.00mi |
| 208 Josie Pl Unit A Springdale, AR | 3.0 | 2.0 | 990 | $1,350 | $1.36 | 46d | 1 | 1.01mi |
| 702 E Johnson Ave Unit B Springdale, AR | 2.0 | 1.0 | 880 | $1,350 | $1.53 | 16d | 1 | 1.01mi |
| 702 E Johnson Ave Unit A Springdale, AR | 2.0 | 1.0 | 880 | $1,350 | $1.53 | 46d | 1 | 1.01mi |
| 700 E Johnson Ave Unit B Springdale, AR | 2.0 | 1.0 | 830 | $1,350 | $1.63 | 46d | 1 | 1.01mi |
| 704 E Johnson Ave Unit A Springdale, AR | 2.0 | 1.0 | 855 | $1,350 | $1.58 | 16d | 1 | 1.02mi |
| 704 E Johnson Ave Unit B Springdale, AR | 2.0 | 1.0 | 855 | $1,300 | $1.52 | 16d | 1 | 1.02mi |
| 706 E Johnson Ave Unit B Springdale, AR | 2.0 | 1.0 | 855 | $1,300 | $1.52 | 16d | 1 | 1.03mi |
| 111 Josie Pl Unit B Springdale, AR | 3.0 | 2.0 | 990 | $1,350 | $1.36 | 25d | 1 | 1.03mi |
| 708 E Johnson Ave Unit B Springdale, AR | 2.0 | 1.0 | 855 | $1,300 | $1.52 | 16d | 1 | 1.03mi |
| 205 Josie Pl Unit A Springdale, AR | 3.0 | 2.0 | 990 | $1,350 | $1.36 | 25d | 1 | 1.05mi |
| 309 Park St Springdale, AR | 1.0 | 1.0 | 535 | $1,050 | $1.96 | 23d | 2 | 1.10mi |
| 309 1/2 Park St Apt D Springdale, AR | 1.0 | 1.0 | 535 | $1,050 | $1.96 | 23d | 1 | 1.10mi |
| 2353 N Lowell Rd Springdale, AR | 2.0 | 2.0 | 925 | $1,162 | $1.26 | 16d | 8 | 1.11mi |
| 612 Allen Ave Apt A Springdale, AR | 1.0 | 1.0 | 535 | $1,025 | $1.92 | 25d | 1 | 1.13mi |
| 409 Park St Unit C Springdale, AR | 2.0 | 1.0 | 765 | $1,050 | $1.37 | 46d | 1 | 1.16mi |
| 407 Park St Apt C Springdale, AR | 2.0 | 1.0 | 765 | $1,050 | $1.37 | 46d | 1 | 1.17mi |
| 419 S Cleveland St Unit B Springdale, AR | 2.0 | 1.0 | 816 | $1,195 | $1.46 | 23d | 1 | 1.22mi |
| 380 Strawberry Meadows Pl Springdale, AR | 1.0 | 1.0 | 550 | $900 | $1.64 | 16d | 7 | 1.22mi |
| 580 E Randall Wobbe Ln Springdale, AR | 2.0 | 1.0 | 675 | $1,175 | $1.74 | 16d | 26 | 1.23mi |
| 257 Arborside Rd Springdale, AR | 1.0–2.0 | 1.0–2.5 | 1022 | $1,575 | $1.54 | 16d | 10 | 1.28mi |
Listing history 25 events
-
2026-06-22days on market $139,900 Active 59 DOM
-
2026-06-18days on market $139,900 Active 56 DOM
-
2026-06-17days on market $139,900 Active 55 DOM
-
2026-06-16days on market $139,900 Active 54 DOM
-
2026-06-15days on market $139,900 Active 53 DOM
-
2026-06-14days on market $139,900 Active 51 DOM
-
2026-06-10pricedays on market $139,900 Active 48 DOM
-
2026-06-09days on market $145,000 Active 47 DOM
-
2026-06-08days on market $145,000 Active 46 DOM
-
2026-06-07days on market $145,000 Active 45 DOM
-
2026-06-05days on market $145,000 Active 42 DOM
-
2026-06-03days on market $145,000 Active 41 DOM
-
2026-06-02days on market $145,000 Active 40 DOM
-
2026-06-01days on market $145,000 Active 39 DOM
-
2026-05-31days on market $145,000 Active 38 DOM
-
2026-05-31days on market $145,000 Active 37 DOM
-
2026-05-18status Active 526-char remark
Show marketing remark (526 chars)
Calling all investors, DIY enthusiasts, and visionary homeowners! Situated on a corner lot in Springdale, this 1944 single-family home offers a rare opportunity to create something special right in town. Whether you’re searching for your next flip, investment property, or a home to customize from the ground up, this property is full of potential and ready for your vision. A true blank canvas with endless possibilities, this is your chance to bring new life to a home in a convenient in-town location. //AGENT OWNED//
-
2026-05-12status Pending 526-char remark
Show marketing remark (526 chars)
Calling all investors, DIY enthusiasts, and visionary homeowners! Situated on a corner lot in Springdale, this 1944 single-family home offers a rare opportunity to create something special right in town. Whether you’re searching for your next flip, investment property, or a home to customize from the ground up, this property is full of potential and ready for your vision. A true blank canvas with endless possibilities, this is your chance to bring new life to a home in a convenient in-town location. //AGENT OWNED//
-
2026-04-16$145,000 Active 526-char remark
Show marketing remark (526 chars)
Calling all investors, DIY enthusiasts, and visionary homeowners! Situated on a corner lot in Springdale, this 1944 single-family home offers a rare opportunity to create something special right in town. Whether you’re searching for your next flip, investment property, or a home to customize from the ground up, this property is full of potential and ready for your vision. A true blank canvas with endless possibilities, this is your chance to bring new life to a home in a convenient in-town location. //AGENT OWNED//
-
2026-03-24soldstatus $110,000
-
2006-05-09soldstatus $85,000
-
1995-11-30soldstatus $52,000
-
1991-03-29soldstatus $44,000
-
1990-04-25soldstatus $21,500
-
1987-06-12soldstatus $30,000
ⓘ Source: listings_history table (triggers on properties + properties_extension) + one-shot
backfill from property_details.listing_events for pre-trigger history.
Tax reassessment forecast AR · Resets to sale price
- Current annual tax
- $770 · $64/mo
- Projected year-2 tax
- $895 · $75/mo
- Expected delta
- +$125/yr (+$10/mo · 16.2%)
ⓘ Screening estimate from a state-policy table — verify with the county assessor before closing.
Climate risk First Street
- Flood 1/10 Low FEMA zone X (unshaded) · 0% chance over 30 yrs
- Wildfire 4/10 Moderate
- Heat 5/10 Major 7 d/yr ≥105°F today · 20 d/yr by 30 yrs out
- Wind 2/10 Low 2% chance of damaging wind over 30 yrs
- Air quality 2/10 Low 1 unhealthy d/yr today · 1 by 30 yrs out
Nearby sold comps map
Loading sold comps map…
Walkable amenities ~0.75 mi
Loading nearby amenities…
Taxation est. · year 1
- Rental income
- $14,429
- − Mortgage interest
- −$7,837
- − Property taxes
- −$770
- − Insurance
- −$700
- − Repairs & maintenance
- −$1,154
- − Management
- −$1,154
- − Depreciation
- −$4,070
- Taxable loss
- −$1,256
- Est. tax savings @ 24.0%
- +$301
- After-tax cash flow
- $1,426/yr
For passive investors: Depreciation is non-cash, so a rental often shows a tax loss while cash-flowing — sheltering income. Rental losses are passive: they offset passive income freely, and up to $25,000/yr can offset ordinary (W-2) income if you actively participate and your MAGI is under $100k (phasing out to $0 by $150k); unused losses carry forward. On sale, claimed depreciation is recaptured at up to 25%, and gains may owe capital-gains tax (a 1031 exchange can defer both). Figures are a year-1 estimate at your 24.0% rate — not tax advice; consult a CPA.
Schools (NCES district)
- District
- Springdale School District
- NCES district ID
- 0512660
- Math proficiency
- 38% ▼ -11.00%
- Reading proficiency
- 35% ▼ -6.00%
- Median HH income
- $45,469
- Composite
- 31.18/100
- National rank
- #6046
- State rank
- #100 of 238 in AR
Livability — Springdale
- Score
- 70/100
- State rank
- #48
- US rank
- #7326
Category grades
Schools grade is shown separately in the Schools card above.
Census & demographics
- Census place
- Springdale, AR
- County
- Washington County · 252,056 people
- City population
- 104,811
- Metro
- Fayetteville-Springdale-Rogers, AR
- Population (ZIP)
- 58,719
- Household income
- $65,898
- Rent vs Own
- Severe rent burden
- 1352.0
Population outlook (Washington County) Hauer SSP2
- Today (2025)
- 271,748 people
- By 2030
- 296,414 · +9.1%
- By 2040
- 346,874 · +27.6%
- By 2050
- 398,552 · +46.7%
- By 2075
- 523,309 · +92.6%
- By 2100
- 615,280 · +126.4%
Race, ethnicity, and origin ACS 2023
- Neighborhood character
- Diverse neighborhood (Simpson 0.70)
- Race & ethnicity
- Hispanic / Latino 44% White 33% Two or more races 28% Pacific Islander 11% Black 3% Asian 2% Native American 2%
- Hispanic origin (detail)
- Mexican 32% Puerto Rican 1%
- Common ancestry
- Romanian 1% Slovak 1% Italian 1%
- Foreign-born
- 28% · Canada
- Languages at home
- 58% English-only · Spanish 32% Other Asian/Pacific 9% Russian/Polish/Slavic 1%
Political lean MEDSL · Washington
- 2024 margin
- Lean R (+6.7) · D 45.1% · R 51.7% · Other 3.2%
- 2008→2024 swing
- +6.4pp toward D · 2008: -13.1pp · 2024: -6.7pp
- All cycles
- 2024: R+6.7 2020: R+3.9 2016: R+10.4 2012: R+16.3 2008: R+13.1
Not yet ingested
- Civics
- —
Market trends
- HPI YoY
- ▼ -269.05%
- Current HPI
- 297.924
- Rent YoY
- ▲ 2.87%
- Metro
- Fayetteville-Springdale-Rogers, AR
- State GDP YoY
- ▲ 3.80%
- F500 in state
- 10
Industry mix (Fortune 500 HQ in AR)
| Industry | F500 HQs | Revenue |
|---|---|---|
| Retail | 1 | $681B |
|
||
| Food / Agriculture | 1 | $53B |
|
||
| Retail / Energy | 1 | $22B |
|
||
| Transportation / Logistics | 1 | $12B |
|
||
| Energy | 1 | $4B |
|
||
Price history
+383.3% since first listed9 events — show timeline
- 2026-05-18 Relisted — NWARMLS
- 2026-05-12 Pending — NWARMLS
- 2026-04-16 Listed $145,000 NWARMLS
- 2026-03-24 Sold (Public Records) $110,000 Public Records
- 2006-05-09 Sold (Public Records) $85,000 Public Records
- 1995-11-30 Sold (Public Records) $52,000 Public Records
- 1991-03-29 Sold (Public Records) $44,000 Public Records
- 1990-04-25 Sold (Public Records) $21,500 Public Records
- 1987-06-12 Sold (Public Records) $30,000 Public Records
Property tax history
+3.3%/yrLatest (2025): $770 · +8.5% YoY. Source: county tax records.
Cash-flow waterfall
monthlySold comps — $/sqft
last 12 mo · ≤1 miLoading sold comps…