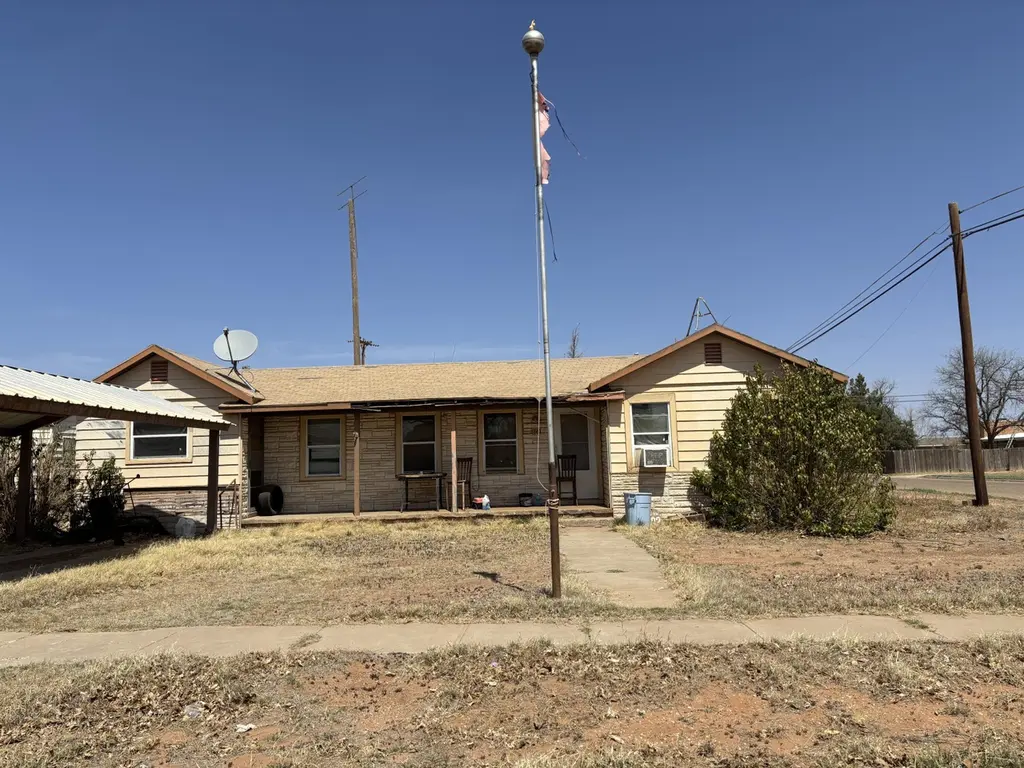
802 16th St · Seagraves, TX
Flood risk 1/10 · Minimal
- FEMA flood zone
- X
- Chance of flooding over 30 yrs
- 0.0%
- Est. flood insurance / yr
- $507 – $1,088
Fire risk 1/10 · Minimal
- Est. fire insurance / yr
- $1,222 – $2,270
Heat risk 5/10 · Moderate
- Hot days now (above 100°F)
- 6 days/yr
- Hot days in 30 yrs
- 18 days/yr
Wind risk 2/10 · Minimal
- Chance of severe wind over 30 yrs
- 1.0%
Air-quality risk 1/10 · Minimal
- Unhealthy air days now
- 0 days/yr
- Unhealthy air days in 30 yrs
- 0 days/yr
Risk factors via First Street. Map © Google.
Why this score? — see what drove the B grade
The composite is a weighted blend of 9 inputs, each scored 0–100. Each bar is that input's sub-score; the figure is the points it added to the 100-point composite (weight × sub-score).
- Cash flow +30.0/30.0
- 1% rule +10.0/10.0
- DSCR +10.0/10.0
- ARV discount +7.5/15.0
- Appreciation +5.2/10.0
- Livability +3.6/5.0
- Rent growth +2.5/5.0
- Schools +2.3/10.0
- Condition / age +2.2/5.0
$49,000
🖨 Deal sheet (PDF) 📄 Offer letter ✓ Due diligence
Listing remarks
Investor special with some serious potential! This 3 bed, 1 bath home offers 1,360 sq ft and hardwood floors throughout, sitting on a spacious lot in Seagraves. This home has solid bones along with the HVAC! Perfect for a flip, rental, or someone ready to build equity fast! Bring your offers before its gone!
Key facts
- 9,797 sq ft lot
- Parking
- Built 1992
Property features AI
Exterior
- Parking: Carport (detached) with 1 car space
- Utilities: Public water; Public sewer
- Home design: Single-family residence; One-story; Fixer condition
- Construction: Wood siding; Pillar/post/pier foundation; Built as single-family residential
- Exterior features: Front porch, rear porch and patio; Fenced front and back yard (chain link); Composition roof
Interior
- Bathrooms: 1 full bathroom
- Heating & cooling: Central heating (natural gas); Central electric air conditioning
- Interior features: See remarks; Gas water heater
Neighborhood map
What this means for you Summary
Snapshot
- This is a 3-bed/1.0-bath single-family listed at $49k. Condition is rated fair.
Deal economics
- At list price, monthly cash flow is $672 ($8k/yr) — positive.
- The deal already cash-flows at list — no discount required.
- Meets the 1% rule at list price ($1k rent vs $49k).
Location & tenants
- Location reads 71/100 on livability (#281 in TX) — a middle-class / working-renter tenant base. Strengths: cost of living A+, health & safety A+, housing A; Watch: amenities C-, employment D+, schools F.
- Seagraves ISD (rural): math 33% / reading 19% proficiency, ranked #693 of 826 in TX (top 84%) — low school quality limits family demand, transient renter base, plan for 1-2y turnover.
- Market conditions: 15 active listings in the ZIP; 19 units permitted in Gaines County in 2024 (0 in 5+ unit buildings).
Forward outlook
- In year one you build about $489 of equity ($339 loan paydown + $150 appreciation (0.3% local appreciation)).
- Gaines County population projected at +58% by 2050 — long-run rental-demand tailwind backs the buy-and-hold thesis.
- At projected returns (0.3% appreciation + 3.0% rent growth), your $14k cash investment doubles in ~2 years — after that, you're playing with house money.
Negotiation context
- Only 10 days on market — expect competitive offers; lowballing is unlikely to land.
Risks & watch-outs
- Climate carrying-cost: extreme-heat days projected 6→18/yr by 2055 (HVAC capex compounding) — expect insurance premiums to compound above CPI over the hold.
Questions for the listing agent
- Have any recent inspections been done? Can we get a copy of the seller's disclosures and any deferred-maintenance estimates?
- Is there a deadline driving the sale (1031 exchange, divorce, estate, relocation)? That informs how much negotiation room exists.
- Schools are F-rated, which usually means shorter tenancies and higher turnover. Who's the typical renter profile here, and what's been the actual vacancy rate?
- What's the average days-on-market for RENTAL listings here right now (not sales)? A rising rental-DOM trend means longer vacancies and softer asking-rent achievability than the comps imply.
- What's the recent tenant-quality profile in this submarket — average credit score on applications, eviction rate, late-payment / NSF rate, and stable-employment percentage? A property-management company in the area should have these aggregated.
- How much new for-sale + rental construction is in the pipeline within 1–3 miles? Heavy new supply typically softens prices + rents 12–24 months out; constrained supply supports both.
Investment metrics
- 1% rule
- 2.61% ✓
- Cap rate
- 22.75%
- Cash-on-cash
- 58.78%
- DSCR
- 3.62
- GRM
- 3.2
CMA / ARV
No comps found within radius.
Projected returns pro-forma
0.31% appreciation · 3.0% rent growth · sell at horizon
- IRR
- 60.9%
- Equity multiple
- 4.07×
- Total profit
- $42,095
- Equity at exit
- $14,981
- IRR
- 62.8%
- Equity multiple
- 8.22×
- Total profit
- $99,086
- Equity at exit
- $18,621
Cash invested: $13,720 (down + closing). Projections, not guarantees.
Landlord ↔ Tenant lean methodology
- Overall (STATE)
- 87 Strongly Landlord-Friendly
- State Texas
- 87 Strongly Landlord-Friendly · R+5
- County
- — inherits STATE
- City
- — inherits STATE
ZIP-level market 79359
- Home prices YoY
- 0.4%
- Active inventory
- 15
- Price-to-rent
- 3.2×
Monthly cashflow live
- Estimated rent
- $1,279 medium interval (Pro) →
- Mortgage (P&I)
- −$257
- Tax est. 1.5%
- −$61 /mo · $735/yr
- Insurance
- −$20
- HOA
- −$0
- Vacancy / Maint / Mgmt
- −$269
- Net cashflow
- $672
Break-even live
Sensitivity live
| Price | -10% $706 | -5% $689 | +0% $672 | +5% $655 | +10% $638 |
|---|---|---|---|---|---|
| Rent | -10% $571 | -5% $621 | +0% $672 | +5% $723 | +10% $773 |
| Rate | -1.0pp $697 | -0.5pp $684 | base $672 | +0.5pp $659 | +1.0pp $646 |
UW: 25.0% down · 7.5% · 30yr · 1.5% tax · 5.0% vac · 8.0% maint · 8.0% mgmt
Financing live
Cash to close
- Down payment
- $12,250
- Closing costs
- $1,470
- Reserves months
- —
- Total cash needed
- —
Loan-product check · same deal, 3 products live
Conventional
25% down · 7.5% · 30yr
- Down + closing
- —
- Monthly P&I
- —
- Monthly cashflow
- —
- DSCR
- —
- Eligible?
- —
Personal DTI + credit; lowest rate.
DSCR
20% down · 8.5% · 30yr
- Down + closing
- —
- Monthly P&I
- —
- Monthly cashflow
- —
- DSCR
- —
- Eligible?
- —
No personal income docs; deal must DSCR.
Hard money
10% down · 12.0% · 12mo
- Down + closing
- —
- Monthly P&I
- —
- Monthly cashflow
- —
- DSCR
- —
- Eligible?
- —
Short-term bridge; refi at stabilization.
Listing history 9 events
-
2026-06-21days on market $49,000 Active 10 DOM
-
2026-06-18days on market $49,000 Active 8 DOM
-
2026-06-17days on market $49,000 Active 7 DOM
-
2026-06-16days on market $49,000 Active 6 DOM
-
2026-06-15days on market $49,000 Active 5 DOM
-
2026-06-15days on market $49,000 Active 4 DOM
-
2026-06-13days on market $49,000 Active 3 DOM
-
2026-06-12pricedays on market $49,000 Active 2 DOM
-
2026-03-30$50,000 Active 309-char remark
ⓘ Source: listings_history table (triggers on properties + properties_extension) + one-shot
backfill from property_details.listing_events for pre-trigger history.
Climate risk First Street
- Flood 1/10 Low FEMA zone X · 0% chance over 30 yrs
- Wildfire 1/10 Low
- Heat 5/10 Major 6 d/yr ≥100°F today · 18 d/yr by 30 yrs out
- Wind 2/10 Low 100% chance of damaging wind over 30 yrs
- Air quality 1/10 Low 0 unhealthy d/yr today · 0 by 30 yrs out
Nearby sold comps map
Loading sold comps map…
Walkable amenities ~0.75 mi
Loading nearby amenities…
Taxation est. · year 1
- Rental income
- $15,352
- − Mortgage interest
- −$2,745
- − Property taxes
- −$735
- − Insurance
- −$245
- − Repairs & maintenance
- −$1,228
- − Management
- −$1,228
- − Depreciation
- −$1,425
- Taxable income
- $7,745
- Est. tax owed @ 24.0%
- −$1,859
- After-tax cash flow
- $6,205/yr
For passive investors: Depreciation is non-cash, so a rental often shows a tax loss while cash-flowing — sheltering income. Rental losses are passive: they offset passive income freely, and up to $25,000/yr can offset ordinary (W-2) income if you actively participate and your MAGI is under $100k (phasing out to $0 by $150k); unused losses carry forward. On sale, claimed depreciation is recaptured at up to 25%, and gains may owe capital-gains tax (a 1031 exchange can defer both). Figures are a year-1 estimate at your 24.0% rate — not tax advice; consult a CPA.
Condition & rehab AI · 2 photos
This 3-bedroom, 1-bath home in Seagraves, TX, requires significant repairs and maintenance, particularly to the roof, siding, and exterior. Improvements in these areas would significantly increase its resale and rental value.
Repairs flagged
- Major roof — Significant wear and tear, potential leaks.
- Major siding — Peeling and faded paint.
- Major exterior — Sparse and overgrown landscaping, missing fencing sections.
- Major exterior — Poor condition of the exterior walls and paint.
Value-add opportunities
- Both Landscaping and fencing repairs — Improving the curb appeal and safety of the property.
- Both Roof repair — Fixing the roof will prevent further damage and improve the home's overall condition.
- Both Siding repair and repainting — Updating the siding and repainting will improve the home's appearance and value.
- Both Landscaping and fencing repairs — Improving the curb appeal and safety of the property.
Renovation cost estimate screening
| Repair item | Severity | Est. cost |
|---|---|---|
| roof · Significant wear and tear, potential leaks. | Major | $15,000–50,000 |
| siding · Peeling and faded paint. | Major | $15,000–50,000 |
| exterior · Sparse and overgrown landscaping, missing fencing sections. | Major | $15,000–50,000 |
| exterior · Poor condition of the exterior walls and paint. | Major | $15,000–50,000 |
| Total estimated repair cost · 4 items | $60,000–200,000 |
Value-add ROI direction
- Both Landscaping and fencing repairs — Improving the curb appeal and safety of the property. ↑
- Both Roof repair — Fixing the roof will prevent further damage and improve the home's overall condition. ↑
- Both Siding repair and repainting — Updating the siding and repainting will improve the home's appearance and value. ↑
- Both Landscaping and fencing repairs — Improving the curb appeal and safety of the property. ↑
ⓘ Cost ranges are severity-bucket heuristics (US national rule-of-thumb). Get contractor quotes + a written scope before underwriting a rehab budget.
Schools (NCES district)
- District
- Seagraves ISD
- NCES district ID
- 4839600
- Math proficiency
- 33% ▼ -5.00%
- Reading proficiency
- 19% ▼ -10.00%
- Median HH income
- $46,938
- Composite
- 22.66/100
- National rank
- #8053
- State rank
- #693 of 826 in TX
Livability — Seagraves
- Score
- 71/100
- State rank
- #281
- US rank
- #6562
Category grades
Schools grade is shown separately in the Schools card above.
Census & demographics
- Census place
- Seagraves, TX
- Population (ZIP)
- 3,465
Population outlook (Gaines County) Hauer SSP2
- Today (2025)
- 25,287 people
- By 2030
- 27,989 · +10.7%
- By 2040
- 33,895 · +34.0%
- By 2050
- 40,001 · +58.2%
- By 2075
- 55,259 · +118.5%
- By 2100
- 65,681 · +159.7%
Race, ethnicity, and origin ACS 2023
- Neighborhood character
- Diverse neighborhood (Simpson 0.58)
- Race & ethnicity
- Hispanic / Latino 57% White 28% Two or more races 26% Black 12%
- Hispanic origin (detail)
- Mexican 55%
- Common ancestry
- Polish 4% European 1% Serbian 1%
- Foreign-born
- 9% · Canada
- Languages at home
- 53% English-only · Spanish 42% German/W. Germanic 4%
Political lean MEDSL · Gaines
- 2024 margin
- Solid R (+82.6) · D 8.4% · R 91.0%
- 2008→2024 swing
- -15.4pp toward R · 2008: -67.2pp · 2024: -82.6pp
- All cycles
- 2024: R+82.6 2020: R+79.7 2016: R+71.8 2012: R+72.5 2008: R+67.2
Not yet ingested
- Civics
- —
Market trends
- HPI YoY
- ▲ 0.31%
- Current HPI
- 82.9375
- Rent YoY
- —
- Metro
- —
- State GDP YoY
- ▲ 3.95%
- F500 in state
- 110
Industry mix (Fortune 500 HQ in TX)
| Industry | F500 HQs | Revenue |
|---|---|---|
| Energy | 16 | $1,198B |
|
||
| Technology | 5 | $198B |
|
||
| Engineering / Construction | 4 | $72B |
|
||
| Energy Services | 3 | $60B |
|
||
| Utilities | 3 | $41B |
|
||
| Healthcare | 2 | $330B |
|
||
Price history
1 event — show timeline
- 2026-06-11 Listed $49,000 LARMLS
Cash-flow waterfall
monthlySold comps — $/sqft
last 12 mo · ≤1 miLoading sold comps…