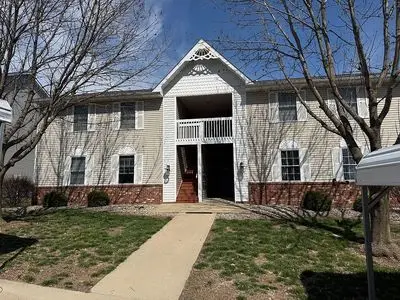
705 4th St · Highland, IL
Flood risk 1/10 · Minimal
- FEMA flood zone
- X
- Chance of flooding over 30 yrs
- 0.0%
- Est. flood insurance / yr
- $507 – $1,088
Fire risk 1/10 · Minimal
- Est. fire insurance / yr
- $804 – $1,492
Heat risk 5/10 · Moderate
- Hot days now (above 106°F)
- 7 days/yr
- Hot days in 30 yrs
- 21 days/yr
Wind risk 2/10 · Minimal
- Chance of severe wind over 30 yrs
- 1.0%
Air-quality risk 2/10 · Minimal
- Unhealthy air days now
- 1 days/yr
- Unhealthy air days in 30 yrs
- 1 days/yr
Risk factors via First Street. Map © Google.
Why this score? — see what drove the F grade
The composite is a weighted blend of 9 inputs, each scored 0–100. Each bar is that input's sub-score; the figure is the points it added to the 100-point composite (weight × sub-score).
- Cash flow +8.1/30.0
- ARV discount +7.5/15.0
- 1% rule +4.2/10.0
- Livability +3.8/5.0
- Schools +3.6/10.0
- Rent growth +2.5/5.0
- Condition / age +2.5/5.0
- DSCR +2.1/10.0
- Appreciation +0.0/10.0
$127,500
🖨 Deal sheet (PDF) 📄 Offer letter ✓ Due diligence
Listing remarks
First-floor 2-bedroom, 1-bath condo offering 1,017 square feet of living space. Handicap accessible with no-step entry. Features an open floor plan, a full-size laundry room, and recently installed laminate flooring throughout the main living area. Includes two parking spaces (one covered and one uncovered), with additional room to accommodate up to four vehicles total. Also comes with a private 20x20 storage area in the basement. HOA is just $125/month and covers all exterior maintenance. Ideal for downsizing, an investment property, or a first-time homebuyer.
Key facts
- Open floor plan
- Handicap accessible
- Private storage area
Tags
Neighborhood map
What this means for you Summary
Snapshot
- This is a 2-bed/1.0-bath condo listed at $128k.
Deal economics
- At list price, monthly cash flow is $-125 ($-2k/yr) — negative.
- To cash-flow at today's rent, offer at most $123k (3.5% below list).
- To meet the 1% rule (rent ≥ 1% of price), the offer needs to be $117k (8.2% below list).
- Recommended offer: $117k (8.2% below list) — sets the bar for 1% rule.
- Cap rate 5.1% vs local median 2.3% in Highland — top-decile yield for the area; either an underpriced asset or a hidden risk that comps aren't pricing in. Stress-test before assuming the spread holds.
Location & tenants
- Location reads 76/100 on livability (#185 in IL, #3,530 nationally) — a middle-class / working-renter tenant base. Strengths: crime A+, cost of living A+, housing A+; Watch: health & safety C-, amenities F, commute F.
- Highland CUSD 5 (town): math 39% / reading 41% proficiency, ranked #134 of 620 in IL (top 22%) — families likely to look elsewhere, expect single-tenant / working-renter base with shorter leases.
- Zoned schools: Highland Primary School (589 students, 0% FRL); Highland Middle School (math 40% / reading 41%, grade F, #136 of 665 statewide, top 21%, 607 students, 0% FRL); Highland High School (math 39% / reading 40%, grade F, #88 of 693 statewide, top 14%, 859 students, 0% FRL) — zoned schools average 0% FRL vs 24% district-wide (24 pts lower); this property's tenant base skews higher-income than the district average.
- Market conditions: 115 active listings in the ZIP; 14 comparable units currently listed for rent nearby; rentals leasing fast (median 4d on market — plan ~1-2 weeks tenant-placement turnaround); 336 units permitted in Madison County in 2024 (0 in 5+ unit buildings).
Forward outlook
- Local home prices are declining (-3.0%/yr); year-one equity from $882 of loan paydown is wiped out by about $4k of value loss. Plan a longer hold.
- Madison County population projected at -18% by 2050 — secular population decline; favor cash flow + early exit over multi-decade hold.
Negotiation context
- Only 1 days on market — expect competitive offers; lowballing is unlikely to land.
- Current owner paid $74k; list at $128k implies a 72% gain — meaningful room to come down on a strong offer.
Risks & watch-outs
- Climate carrying-cost: extreme-heat days projected 7→21/yr by 2055 (HVAC capex compounding) — expect insurance premiums to compound above CPI over the hold.
Questions for the listing agent
- What do current leases actually rent for vs. the listed asking? Can we see a recent rent roll and the last 12 months of T-12 income?
- What does the HOA fee cover, when was the last increase, and are there any pending special assessments or reserve-fund shortfalls?
- Any open or pending special assessments — roof, HVAC, plumbing, elevator, façade? What's the per-unit balance and payoff schedule, and is the seller paying it off at close or rolling it to the buyer?
- Is there a deadline driving the sale (1031 exchange, divorce, estate, relocation)? That informs how much negotiation room exists.
- The area grade is low — what's the realistic commute time and amenity access for the typical tenant pool here? Any planned neighborhood developments (good or bad) we should know about?
- What's the average days-on-market for RENTAL listings here right now (not sales)? A rising rental-DOM trend means longer vacancies and softer asking-rent achievability than the comps imply.
- What's the recent tenant-quality profile in this submarket — average credit score on applications, eviction rate, late-payment / NSF rate, and stable-employment percentage? A property-management company in the area should have these aggregated.
- How much new apartment / multifamily construction is in the pipeline within 1–3 miles? Heavy new supply (>2% of stock underway) typically softens rents 12–24 months out; light construction supports rent growth.
Investment metrics
- 1% rule
- 0.92% ✗
- Cap rate
- 5.12%
- Cash-on-cash
- -4.21%
- DSCR
- 0.81
- GRM
- 9.1
CMA / ARV
No comps found within radius.
Projected returns pro-forma
-3.0% appreciation · 3.0% rent growth · sell at horizon
- IRR
- -23.3%
- Equity multiple
- 0.20×
- Total profit
- $-28,509
- Equity at exit
- $19,011
- IRR
- -17.6%
- Equity multiple
- 0.03×
- Total profit
- $-34,595
- Equity at exit
- $11,024
Cash invested: $35,700 (down + closing). Projections, not guarantees.
Landlord ↔ Tenant lean methodology
- Overall (STATE)
- 43 Moderately Tenant-Leaning
- State Illinois
- 43 Moderately Tenant-Leaning · D+7
- County
- — inherits STATE
- City
- — inherits STATE
ZIP-level market 62249
- Home prices YoY
- -19.8%
- Active inventory
- 115
- Price-to-rent
- 9.1×
Monthly cashflow live
- Estimated rent
- $1,171 high interval (Pro) →
- Mortgage (P&I)
- −$669
- Tax from tax record
- −$228 /mo · $2,737/yr
- Insurance
- −$53
- HOA est. from 1 same-building comp
- −$100
- Vacancy / Maint / Mgmt
- −$246
- Net cashflow
- $-125
Break-even live
Sensitivity live
| Price | -10% $-53 | -5% $-89 | +0% $-125 | +5% $-161 | +10% $-197 |
|---|---|---|---|---|---|
| Rent | -10% $-218 | -5% $-171 | +0% $-125 | +5% $-79 | +10% $-33 |
| Rate | -1.0pp $-61 | -0.5pp $-93 | base $-125 | +0.5pp $-158 | +1.0pp $-192 |
UW: 25.0% down · 7.5% · 30yr · 1.5% tax · 5.0% vac · 8.0% maint · 8.0% mgmt
Financing live
Cash to close
- Down payment
- $31,875
- Closing costs
- $3,825
- Reserves months
- —
- Total cash needed
- —
Loan-product check · same deal, 3 products live
Conventional
25% down · 7.5% · 30yr
- Down + closing
- —
- Monthly P&I
- —
- Monthly cashflow
- —
- DSCR
- —
- Eligible?
- —
Personal DTI + credit; lowest rate.
DSCR
20% down · 8.5% · 30yr
- Down + closing
- —
- Monthly P&I
- —
- Monthly cashflow
- —
- DSCR
- —
- Eligible?
- —
No personal income docs; deal must DSCR.
Hard money
10% down · 12.0% · 12mo
- Down + closing
- —
- Monthly P&I
- —
- Monthly cashflow
- —
- DSCR
- —
- Eligible?
- —
Short-term bridge; refi at stabilization.
Rent comps 14 comps
| Address | Beds | Baths | Sqft | Rent | $/sqft | DOM | Units | Dist |
|---|---|---|---|---|---|---|---|---|
| 919 Mulberry St Highland, IL | 1.0 | 1.0 | 744 | $705 | $0.95 | 21d | 1 | 0.38mi |
| 919 Mulberry St Highland, IL | 2.0 | 1.0 | 905 | $995 | $1.10 | 0d | 1 | 0.38mi |
| 919 Mulberry St Highland, IL | 2.0 | 1.0 | 905 | $995 | $1.10 | 9d | 1 | 0.38mi |
| 1306 9th St #205 Highland, IL | 1.0 | 1.0 | 700 | $795 | $1.14 | 5d | 1 | 0.51mi |
| 2713 Illinois 160 Highland, IL | 3.0 | 2.0 | 1215 | $1,045 | $0.86 | 13d | 1 | 0.69mi |
| 209 Field Crossing Dr Highland, IL | 2.0–3.0 | 2.0 | 1325 | $1,430 | $1.08 | 0d | 1 | 0.80mi |
| 55 Crimson Ct Unit B Highland, IL | 2.0 | 2.0 | 1160 | $1,795 | $1.55 | 0d | 1 | 0.85mi |
| 55 Crimson Ct Unit B Highland, IL | 2.0 | 2.0 | 1160 | $1,795 | $1.55 | 3d | 1 | 0.85mi |
| 100 Crimson Ct Highland, IL | 2.0 | 2.0 | 1297 | $1,925 | $1.48 | 0d | 1 | 0.87mi |
| 100 Crimson Ct Highland, IL | 2.0 | 2.0 | 1297 | $1,925 | $1.48 | 3d | 1 | 0.87mi |
| 2009 Broadway Highland, IL | 2.0 | 1.0 | 1000 | $1,000 | $1.00 | 0d | 1 | 1.00mi |
| 2009 Broadway Apt 4 Highland, IL | 2.0 | 1.5 | 1000 | $1,000 | $1.00 | 0d | 1 | 1.00mi |
| 1811 Parkview Dr Unit 1813 Parkview Highland, IL | 2.0 | 1.5 | 950 | $995 | $1.05 | 0d | 1 | 1.25mi |
| 1301 27th St Highland, IL | 2.0–3.0 | 1.5–2.0 | 1250 | $1,095 | $0.88 | 13d | 1 | 1.46mi |
HOA detail condo
- Monthly dues
- $0 · $0/yr
- Likely covers
- exterior maint.
- Assessments
- None detected in remarks — confirm with the listing agent.
Listing history 3 events
-
2026-05-26$127,500 Active
-
2020-10-02soldstatus $74,000
-
2004-03-04soldstatus $80,000
ⓘ Source: listings_history table (triggers on properties + properties_extension) + one-shot
backfill from property_details.listing_events for pre-trigger history.
Tax reassessment forecast IL · Partial reset (capped growth)
- Current annual tax
- $2,737 · $228/mo
- Projected year-2 tax
- $2,816 · $235/mo
- Expected delta
- +$78/yr (+$7/mo · 2.9%)
ⓘ Screening estimate from a state-policy table — verify with the county assessor before closing.
Climate risk First Street
- Flood 1/10 Low FEMA zone X · 0% chance over 30 yrs
- Wildfire 1/10 Low
- Heat 5/10 Major 7 d/yr ≥106°F today · 21 d/yr by 30 yrs out
- Wind 2/10 Low 100% chance of damaging wind over 30 yrs
- Air quality 2/10 Low 1 unhealthy d/yr today · 1 by 30 yrs out
Nearby sold comps map
Loading sold comps map…
Walkable amenities ~0.75 mi
Loading nearby amenities…
Taxation est. · year 1
- Rental income
- $14,047
- − Mortgage interest
- −$7,142
- − Property taxes
- −$2,737
- − Insurance
- −$638
- − Repairs & maintenance
- −$1,124
- − Management
- −$1,124
- − HOA
- −$1,200
- − Depreciation
- −$3,709
- Taxable loss
- −$3,627
- Est. tax savings @ 24.0%
- +$870
- After-tax cash flow
- $-631/yr
For passive investors: Depreciation is non-cash, so a rental often shows a tax loss while cash-flowing — sheltering income. Rental losses are passive: they offset passive income freely, and up to $25,000/yr can offset ordinary (W-2) income if you actively participate and your MAGI is under $100k (phasing out to $0 by $150k); unused losses carry forward. On sale, claimed depreciation is recaptured at up to 25%, and gains may owe capital-gains tax (a 1031 exchange can defer both). Figures are a year-1 estimate at your 24.0% rate — not tax advice; consult a CPA.
Schools (NCES district)
- District
- Highland CUSD 5
- NCES district ID
- 1718990
- Math proficiency
- 39% ▼ -2.00%
- Reading proficiency
- 41% ▼ -2.00%
- Median HH income
- $64,403
- Composite
- 35.87/100
- National rank
- #4816
- State rank
- #134 of 620 in IL
Livability — Highland
- Score
- 76/100
- State rank
- #185
- US rank
- #3530
Category grades
Schools grade is shown separately in the Schools card above.
Census & demographics
- Census place
- Highland, IL
- City population
- 16,550
- Population (ZIP)
- 16,550
Population outlook (Madison County) Hauer SSP2
- Today (2025)
- 258,371 people
- By 2030
- 251,523 · -2.7%
- By 2040
- 233,640 · -9.6%
- By 2050
- 213,042 · -17.5%
- By 2075
- 165,255 · -36.0%
- By 2100
- 123,953 · -52.0%
Race, ethnicity, and origin ACS 2023
- Neighborhood character
- Predominantly White (90%)
- Race & ethnicity
- White 90% Two or more races 5% Hispanic / Latino 3% Asian 3%
- Common ancestry
- Romanian 3% Lithuanian 2% Slovak 1%
- Foreign-born
- 4% · South Korea, Canada, Vietnam
- Languages at home
- 95% English-only · Vietnamese 1% Spanish 1% Russian/Polish/Slavic 1%
Political lean MEDSL · Madison
- 2024 margin
- R (+13.3) · D 42.5% · R 55.8% · Other 1.8%
- 2008→2024 swing
- -22.5pp toward R · 2008: 9.2pp · 2024: -13.3pp
- All cycles
- 2024: R+13.3 2020: R+13.2 2016: R+15.6 2012: R+1.4 2008: D+9.2
Not yet ingested
- Civics
- —
Market trends
- HPI YoY
- ▼ -56.91%
- Current HPI
- 230.9451
- Rent YoY
- —
- Metro
- —
- State GDP YoY
- ▲ 1.59%
- F500 in state
- 60
Industry mix (Fortune 500 HQ in IL)
| Industry | F500 HQs | Revenue |
|---|---|---|
| Insurance | 4 | $201B |
|
||
| Consumer Goods | 4 | $87B |
|
||
| Industrial Machinery | 3 | $64B |
|
||
| Healthcare | 2 | $55B |
|
||
| Retail / Pharmacy | 1 | $148B |
|
||
| Agriculture / Food | 1 | $86B |
|
||
Price history
+59.4% since first listed3 events — show timeline
- 2026-05-26 Listed $127,500 FSBO.com
- 2020-10-02 Sold (Public Records) $74,000 Public Records
- 2004-03-04 Sold (Public Records) $80,000 Public Records
Property tax history
+4.8%/yrLatest (2024): $2,737 · +8.1% YoY. Source: county tax records.
Cash-flow waterfall
monthlySold comps — $/sqft
last 12 mo · ≤1 miLoading sold comps…