115-117 W Water St · Lewistown, PA
Flood risk 6/10 · Moderate
- FEMA flood zone
- X (unshaded)
- Chance of flooding over 30 yrs
- 0.63%
- Est. flood insurance / yr
- $507 – $1,088
Fire risk 3/10 · Minor
- Est. fire insurance / yr
- $511 – $949
Heat risk 5/10 · Moderate
- Hot days now (above 96°F)
- 7 days/yr
- Hot days in 30 yrs
- 17 days/yr
Wind risk 2/10 · Minimal
- Chance of severe wind over 30 yrs
- —
Air-quality risk 2/10 · Minimal
- Unhealthy air days now
- 0 days/yr
- Unhealthy air days in 30 yrs
- 1 days/yr
Risk factors via First Street. Map © Google.
Why this score? — see what drove the B- grade
The composite is a weighted blend of 9 inputs, each scored 0–100. Each bar is that input's sub-score; the figure is the points it added to the 100-point composite (weight × sub-score).
- Cash flow +30.0/30.0
- 1% rule +10.0/10.0
- DSCR +10.0/10.0
- ARV discount +7.5/15.0
- Livability +3.3/5.0
- Schools +3.2/10.0
- Rent growth +2.5/5.0
- Condition / age +2.2/5.0
- Appreciation +0.0/10.0
$74,000
🖨 Deal sheet 📄 Offer letter ✓ Due diligence
Listing remarks
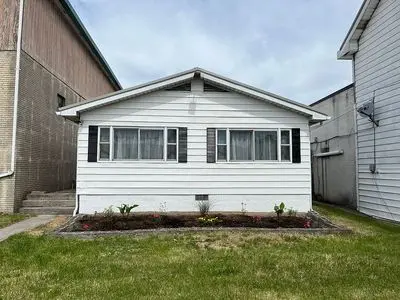
Charming and affordable 1974 double wide home with full foundation in a convenient Lewistown location. This 3 bedroom, 1 bathroom home offers comfortable living on a roomy lot with plenty of off street parking. No immediate residential neighbors for added privacy. Located in the commercial district so options for business ventures or office space are possible. Recent updates include a new metal roof and gutters installed in April 2026 giving peace of mind for years to come. Enjoy efficient natural gas heat, a storage shed for extra space and a family friendly setting close to Victory Park perfect for walking and outdoor recreation as well as the Juniata river where you can enjoy fishing and
Key facts
- New metal roof
- Full foundation
- Storage shed
Tags
Neighborhood map
What this means for you Summary
Snapshot
- This is a 6-bed/2.0-bath other listed at $74k. Condition is rated fair.
Deal economics
- At list price, monthly cash flow is $475 ($6k/yr) — positive.
- The deal already cash-flows at list — no discount required.
- Meets the 1% rule at list price ($1k rent vs $74k).
- Recommended offer: $72k (3.0% below list) — sets the bar for market timing.
- Cap rate 14.0% vs local median 5.0% in Lewistown — top-decile yield for the area; either an underpriced asset or a hidden risk that comps aren't pricing in. Stress-test before assuming the spread holds.
Location & tenants
- Location reads 66/100 on livability (#1,057 in PA) — a middle-class / working-renter tenant base. Strengths: cost of living A+, housing A+, health & safety A+; Watch: schools C-, amenities D+, commute F.
- Mifflin County SD (town): math 28% / reading 49% proficiency, ranked #380 of 539 in PA (top 70%) — families likely to look elsewhere, expect single-tenant / working-renter base with shorter leases.
- Market conditions: 73 active listings in the ZIP; 58 units permitted in Mifflin County in 2024 (0 in 5+ unit buildings).
Forward outlook
- Local home prices are declining (-3.0%/yr); year-one equity from $512 of loan paydown is wiped out by about $2k of value loss. Plan a longer hold.
- Mifflin County population projected at -18% by 2050 — secular population decline; favor cash flow + early exit over multi-decade hold.
- At projected returns (-3.0% appreciation + 3.0% rent growth), your $21k cash investment doubles in ~5 years — after that, you're playing with house money.
Negotiation context
- It's been on market 37 days — a 3% lower offer ($72k) is reasonable based on typical stale-listing flexibility.
Risks & watch-outs
- Climate carrying-cost: major flood risk; extreme-heat days projected 7→17/yr by 2055 (HVAC capex compounding) — expect insurance premiums to compound above CPI over the hold.
Questions for the listing agent
- It's been on market 37 days. Have you received any prior offers? Is the seller open to a 3% concession, seller financing, or rate buy-down credit?
- Have any recent inspections been done? Can we get a copy of the seller's disclosures and any deferred-maintenance estimates?
- Built in 1974 — when were the roof, HVAC, electrical panel, plumbing, and water heater last replaced?
- Is there a deadline driving the sale (1031 exchange, divorce, estate, relocation)? That informs how much negotiation room exists.
- What's the average days-on-market for RENTAL listings here right now (not sales)? A rising rental-DOM trend means longer vacancies and softer asking-rent achievability than the comps imply.
- What's the recent tenant-quality profile in this submarket — average credit score on applications, eviction rate, late-payment / NSF rate, and stable-employment percentage? A property-management company in the area should have these aggregated.
- How much new for-sale + rental construction is in the pipeline within 1–3 miles? Heavy new supply typically softens prices + rents 12–24 months out; constrained supply supports both.
Investment metrics
- 1% rule
- 1.69% ✓
- Cap rate
- 14.00%
- Cash-on-cash
- 27.53%
- DSCR
- 2.23
- GRM
- 4.9
CMA / ARV
No comps found within radius.
Projected returns pro-forma
-3.0% appreciation · 3.0% rent growth · sell at horizon
- IRR
- 21.6%
- Equity multiple
- 1.88×
- Total profit
- $18,306
- Equity at exit
- $11,034
- IRR
- 29.7%
- Equity multiple
- 3.65×
- Total profit
- $55,004
- Equity at exit
- $6,398
Cash invested: $20,720 (down + closing). Projections, not guarantees.
Landlord ↔ Tenant lean methodology
- Overall (STATE)
- 62 Landlord-Friendly
- State Pennsylvania
- 62 Landlord-Friendly · EVEN
- County
- — inherits STATE
- City
- — inherits STATE
ZIP-level market 17044
- Home prices YoY
- -6.7%
- Active inventory
- 73
- Price-to-rent
- 4.9×
Monthly cashflow live
- Estimated rent
- $1,249 medium interval (Pro) →
- Mortgage (P&I)
- −$388
- Tax est. 1.5%
- −$92 /mo · $1,110/yr
- Insurance
- −$31
- HOA
- −$0
- Vacancy / Maint / Mgmt
- −$262
- Net cashflow
- $475
Break-even live
UW: 25.0% down · 7.5% · 30yr · 1.5% tax · 5.0% vac · 8.0% maint · 8.0% mgmt
Financing live
Cash to close
- Down payment
- $18,500
- Closing costs
- $2,220
- Reserves months
- —
- Total cash needed
- —
Loan-product check · same deal, 3 products live
Conventional
25% down · 7.5% · 30yr
- Down + closing
- —
- Monthly P&I
- —
- Monthly cashflow
- —
- DSCR
- —
- Eligible?
- —
Personal DTI + credit; lowest rate.
DSCR
20% down · 8.5% · 30yr
- Down + closing
- —
- Monthly P&I
- —
- Monthly cashflow
- —
- DSCR
- —
- Eligible?
- —
No personal income docs; deal must DSCR.
Hard money
10% down · 12.0% · 12mo
- Down + closing
- —
- Monthly P&I
- —
- Monthly cashflow
- —
- DSCR
- —
- Eligible?
- —
Short-term bridge; refi at stabilization.
Listing history 15 events
-
2026-06-18days on market $74,000 Active 37 DOM
-
2026-06-17days on market $74,000 Active 36 DOM
-
2026-06-16days on market $74,000 Active 35 DOM
-
2026-06-15days on market $74,000 Active 34 DOM
-
2026-06-13days on market $74,000 Active 32 DOM
-
2026-06-12days on market $74,000 Active 31 DOM
-
2026-06-09days on market $74,000 Active 28 DOM
-
2026-06-08days on market $74,000 Active 27 DOM
-
2026-06-08days on market $74,000 Active 26 DOM
-
2026-06-07days on market $74,000 Active 25 DOM
-
2026-06-04days on market $74,000 Active 22 DOM
-
2026-06-02days on market $74,000 Active 21 DOM
-
2026-06-01days on market $74,000 Active 20 DOM
-
2026-05-31days on market $74,000 Active 19 DOM
-
2026-05-13$74,000 Active 1106-char remark
ⓘ Source: listings_history table (triggers on properties + properties_extension) + one-shot
backfill from property_details.listing_events for pre-trigger history.
Climate risk First Street
- Flood 6/10 Major FEMA zone X (unshaded) · 63% chance over 30 yrs
- Wildfire 3/10 Moderate
- Heat 5/10 Major 7 d/yr ≥96°F today · 17 d/yr by 30 yrs out
- Wind 2/10 Low
- Air quality 2/10 Low 0 unhealthy d/yr today · 1 by 30 yrs out
Nearby sold comps map
Loading sold comps map…
Walkable amenities ~0.75 mi
Loading nearby amenities…
Taxation est. · year 1
- Rental income
- $14,989
- − Mortgage interest
- −$4,145
- − Property taxes
- −$1,110
- − Insurance
- −$370
- − Repairs & maintenance
- −$1,199
- − Management
- −$1,199
- − Depreciation
- −$2,153
- Taxable income
- $4,813
- Est. tax owed @ 24.0%
- −$1,155
- After-tax cash flow
- $4,550/yr
For passive investors: Depreciation is non-cash, so a rental often shows a tax loss while cash-flowing — sheltering income. Rental losses are passive: they offset passive income freely, and up to $25,000/yr can offset ordinary (W-2) income if you actively participate and your MAGI is under $100k (phasing out to $0 by $150k); unused losses carry forward. On sale, claimed depreciation is recaptured at up to 25%, and gains may owe capital-gains tax (a 1031 exchange can defer both). Figures are a year-1 estimate at your 24.0% rate — not tax advice; consult a CPA.
Condition & rehab AI · 2 photos
This 1974 double-wide home requires significant repairs, particularly to the roof and exterior siding, to improve its condition and value.
Repairs flagged
- Major roof — The satellite image suggests potential roof issues.
- Moderate exterior siding — The siding shows signs of wear and discoloration.
Value-add opportunities
- Both repair roof — Fixing the roof would improve the home's appearance and functionality.
- Both paint exterior — Painting the exterior would enhance curb appeal and protect the siding from further damage.
Renovation cost estimate screening
| Repair item | Severity | Est. cost |
|---|---|---|
| roof · The satellite image suggests potential roof issues. | Major | $15,000–50,000 |
| exterior siding · The siding shows signs of wear and discoloration. | Moderate | $3,000–15,000 |
| Total estimated repair cost · 2 items | $18,000–65,000 |
Value-add ROI direction
- Both repair roof — Fixing the roof would improve the home's appearance and functionality. ↑
- Both paint exterior — Painting the exterior would enhance curb appeal and protect the siding from further damage. ↑
ⓘ Cost ranges are severity-bucket heuristics (US national rule-of-thumb). Get contractor quotes + a written scope before underwriting a rehab budget.
Schools (NCES district)
- District
- Mifflin County SD
- NCES district ID
- 4215290
- Math proficiency
- 28% ▼ -7.00%
- Reading proficiency
- 49% ▼ -9.00%
- Median HH income
- $40,718
- Composite
- 32.28/100
- National rank
- #5755
- State rank
- #380 of 539 in PA
Livability — Lewistown
- Score
- 66/100
- State rank
- #1057
- US rank
- #11920
Category grades
Schools grade is shown separately in the Schools card above.
Census & demographics
- Census place
- Lewistown, PA
- Population (ZIP)
- 20,526
Population outlook (Mifflin County) Hauer SSP2
- Today (2025)
- 44,611 people
- By 2030
- 43,212 · -3.1%
- By 2040
- 40,197 · -9.9%
- By 2050
- 36,813 · -17.5%
- By 2075
- 28,833 · -35.4%
- By 2100
- 20,296 · -54.5%
Race, ethnicity, and origin ACS 2023
- Neighborhood character
- Predominantly White (92%)
- Race & ethnicity
- White 92% Two or more races 6% Hispanic / Latino 3%
- Common ancestry
- Romanian 2% Polish 2% Serbian 1%
- Foreign-born
- 1%
- Languages at home
- 97% English-only · Spanish 1% German/W. Germanic 1%
Political lean MEDSL · Mifflin
- 2024 margin
- Solid R (+56.4) · D 21.4% · R 77.9%
- 2008→2024 swing
- -22.8pp toward R · 2008: -33.7pp · 2024: -56.4pp
- All cycles
- 2024: R+56.4 2020: R+56.1 2016: R+57.5 2012: R+46.8 2008: R+33.7
Not yet ingested
- Civics
- —
Market trends
- HPI YoY
- ▼ -15.27%
- Current HPI
- 214.2729
- Rent YoY
- —
- Metro
- —
- State GDP YoY
- ▲ 1.68%
- F500 in state
- 34
Industry mix (Fortune 500 HQ in PA)
| Industry | F500 HQs | Revenue |
|---|---|---|
| Healthcare | 2 | $309B |
|
||
| Insurance | 2 | $27B |
|
||
| Telecommunications / Media | 1 | $124B |
|
||
| Industrial Distribution | 1 | $22B |
|
||
| Financial Services | 1 | $20B |
|
||
| Chemicals / Materials | 1 | $18B |
|
||
Price history
1 event — show timeline
- 2026-05-13 Listed $74,000 FSBO.com
Cash-flow waterfall
monthlySold comps — $/sqft
last 12 mo · ≤1 miLoading sold comps…