 Triplex
205 George Teston Rd - 4 Units Rd #4 · Nicholls, GA
Flood risk 1/10 · Minimal
- FEMA flood zone
- X (unshaded)
- Chance of flooding over 30 yrs
- 0.0%
- Est. flood insurance / yr
- $507 – $1,088
Fire risk 7/10 · Major
- Est. fire insurance / yr
- $963 – $1,789
Heat risk 8/10 · Major
- Hot days now (above 108°F)
- 7 days/yr
- Hot days in 30 yrs
- 19 days/yr
Wind risk 8/10 · Major
- Chance of severe wind over 30 yrs
- 98.0%
Air-quality risk 4/10 · Minor
- Unhealthy air days now
- 4 days/yr
- Unhealthy air days in 30 yrs
- 4 days/yr
Risk factors via First Street. Map © Google.
Why this score? — see what drove the B- grade
The composite is a weighted blend of 9 inputs, each scored 0–100. Each bar is that input's sub-score; the figure is the points it added to the 100-point composite (weight × sub-score).
- Cash flow +26.1/30.0
- DSCR +8.8/10.0
- ARV discount +7.5/15.0
- 1% rule +6.9/10.0
- Appreciation +6.3/10.0
- Livability +3.0/5.0
- Rent growth +2.5/5.0
- Schools +2.4/10.0
- Condition / age +2.2/5.0
$360,000
🖨 Deal sheet 📄 Offer letter ✓ Due diligence
Multi-family units
County records classify this as Multi-Family (2-4 Unit). Listing-text estimate: 3 units. confirmed
Listing remarks
This 4-unit mobile home portfolio offers investors immediate cash flow and strong upside potential in the Douglas rental market. Located on George Teston Road and Tommy Meeks Road, the portfolio consists of one 4BR/2BA home and three 3BR/2BA homes, providing a desirable mix of larger floor plans that remain in high demand. Currently, three units are occupied and one unit is vacant and rent-ready, allowing a new owner to increase income immediately. Existing rents are $1,000, $1,000, and $600 per month, while market rents support approximately $1,000 per month per unit, creating substantial upside through lease-up of the vacant unit and rent optimization of the under-market tenancy. Recent c
Key facts
- Below-market rents
- Two new metal roofs
- Immediate occupancy
Tags
Property features AI
Exterior
- Utilities: Private well water; Septic tank sewer
- Home design: Single-story building; Residential income property (multi-family / multi-unit); Zoned R
- Construction: Metal siding construction
- Exterior features: Metal roof
Interior
- Heating & cooling: Wall/Window air conditioning units
- Interior features: Has cooling; Wall/Window air conditioning units
Neighborhood map
What this means for you Summary
Snapshot
- This is a 3 × 4-bed/?-bath units multifamily listed at $360k. Condition is rated fair.
Deal economics
- At list price, monthly cash flow is $904 ($11k/yr) — positive. Per door: $301/mo.
- The deal already cash-flows at list — no discount required.
- Meets the 1% rule at list price ($4k rent vs $360k).
- Recommended offer: $355k (1.5% below list) — sets the bar for market timing.
Location & tenants
- Location reads 59/100 on livability (#415 in GA) — a working-class tenant base; expect higher turnover. Strengths: cost of living A+, housing A-, crime B; Watch: health & safety C-, schools F, amenities F.
- Coffee County (rural): math 28% / reading 31% proficiency, ranked #99 of 174 in GA (top 57%) — low school quality limits family demand, transient renter base, plan for 1-2y turnover; 66% free/reduced lunch — lower-income household profile, screen leases tightly.
- Market conditions: 9 active listings in the ZIP; 110 units permitted in Coffee County in 2024 (6 in 5+ unit buildings).
Forward outlook
- In year one you build about $12k of equity ($2k loan paydown + $9k appreciation (2.6% local appreciation)).
- Coffee County population projected to shrink 4% by 2050 — rents likely to lag national; underwrite the cash flow, not the appreciation.
- At projected returns (2.6% appreciation + 3.0% rent growth), your $101k cash investment doubles in ~5 years — after that, you're playing with house money.
- By year 4, paydown + projected appreciation supports a ~$41k cash-out refi (75% LTV) — recoverable capital for the next deal without selling this one.
Negotiation context
- It's been on market 15 days — a 2% lower offer ($355k) is reasonable based on typical stale-listing flexibility.
Risks & watch-outs
- Climate carrying-cost: severe wind risk, 98% chance of damaging wind over 30y; major wildfire risk; extreme-heat days projected 7→19/yr by 2055 (HVAC capex compounding) — expect insurance premiums to compound above CPI over the hold.
Questions for the listing agent
- Can we see the unit-by-unit rent roll, current vacancy, and any below-market leases? What's the average tenancy length?
- What capital expenditures (roof, boiler, parking lot, exteriors) have been made in the last 5 years, and what's planned in the next 2?
- Have any recent inspections been done? Can we get a copy of the seller's disclosures and any deferred-maintenance estimates?
- Is there a deadline driving the sale (1031 exchange, divorce, estate, relocation)? That informs how much negotiation room exists.
- Schools are F-rated, which usually means shorter tenancies and higher turnover. Who's the typical renter profile here, and what's been the actual vacancy rate?
- What's the average days-on-market for RENTAL listings here right now (not sales)? A rising rental-DOM trend means longer vacancies and softer asking-rent achievability than the comps imply.
- What's the recent tenant-quality profile in this submarket — average credit score on applications, eviction rate, late-payment / NSF rate, and stable-employment percentage? A property-management company in the area should have these aggregated.
- How much new apartment / multifamily construction is in the pipeline within 1–3 miles? Heavy new supply (>2% of stock underway) typically softens rents 12–24 months out; light construction supports rent growth.
Investment metrics
- 1% rule
- 1.19% ✓
- Cap rate
- 9.30%
- Cash-on-cash
- 10.76%
- DSCR
- 1.48
- GRM
- 7.0
CMA / ARV
No comps found within radius.
Projected returns pro-forma
2.62% appreciation · 3.0% rent growth · sell at horizon
- IRR
- 16.7%
- Equity multiple
- 1.93×
- Total profit
- $93,756
- Equity at exit
- $154,184
- IRR
- 18.5%
- Equity multiple
- 3.60×
- Total profit
- $262,377
- Equity at exit
- $231,803
Cash invested: $100,800 (down + closing). Projections, not guarantees.
Landlord ↔ Tenant lean methodology
- Overall (STATE)
- 90 Strongly Landlord-Friendly
- State Georgia
- 90 Strongly Landlord-Friendly · R+3
- County
- — inherits STATE
- City
- — inherits STATE
ZIP-level market 31554
- Home prices YoY
- 1.2%
- Active inventory
- 9
- Price-to-rent
- 21.0×
Monthly cashflow live
- Estimated rent
- $4,293 medium interval (Pro) →
- Mortgage (P&I)
- −$1,888
- Tax est. 1.5%
- −$450 /mo · $5,400/yr
- Insurance
- −$150
- HOA
- −$0
- Vacancy / Maint / Mgmt
- −$902
- Net cashflow
- $904
Break-even live
3-unit breakdown (identical units grouped — click to expand)
| Units | Beds | Baths | Est. rent |
|---|---|---|---|
| 3× units | 4 | — | $4,293 |
| #1 | 4 | — | $1,431 |
| #2 | 4 | — | $1,431 |
| #3 | 4 | — | $1,431 |
| Total (3 units) | $4,293 | ||
UW: 25.0% down · 7.5% · 30yr · 1.5% tax · 5.0% vac · 8.0% maint · 8.0% mgmt
Financing live
Cash to close
- Down payment
- $90,000
- Closing costs
- $10,800
- Reserves months
- —
- Total cash needed
- —
Loan-product check · same deal, 3 products live
Conventional
25% down · 7.5% · 30yr
- Down + closing
- —
- Monthly P&I
- —
- Monthly cashflow
- —
- DSCR
- —
- Eligible?
- —
Personal DTI + credit; lowest rate.
DSCR
20% down · 8.5% · 30yr
- Down + closing
- —
- Monthly P&I
- —
- Monthly cashflow
- —
- DSCR
- —
- Eligible?
- —
No personal income docs; deal must DSCR.
Hard money
10% down · 12.0% · 12mo
- Down + closing
- —
- Monthly P&I
- —
- Monthly cashflow
- —
- DSCR
- —
- Eligible?
- —
Short-term bridge; refi at stabilization.
Listing history 12 events
-
2026-06-18days on market $360,000 Active 15 DOM
-
2026-06-17days on market $360,000 Active 14 DOM
-
2026-06-16days on market $360,000 Active 13 DOM
-
2026-06-15days on market $360,000 Active 12 DOM
-
2026-06-13days on market $360,000 Active 10 DOM
-
2026-06-12days on market $360,000 Active 9 DOM
-
2026-06-09days on market $360,000 Active 6 DOM
-
2026-06-08days on market $360,000 Active 5 DOM
-
2026-06-07days on market $360,000 Active 4 DOM
-
2026-06-07days on market $360,000 Active 3 DOM
-
2026-06-04remarks 699-char remark
-
2026-06-04$360,000 Active 1 DOM
ⓘ Source: listings_history table (triggers on properties + properties_extension) + one-shot
backfill from property_details.listing_events for pre-trigger history.
Climate risk First Street
- Flood 1/10 Low FEMA zone X (unshaded) · 0% chance over 30 yrs
- Wildfire 7/10 Severe
- Heat 8/10 Severe 7 d/yr ≥108°F today · 19 d/yr by 30 yrs out
- Wind 8/10 Severe 98% chance of damaging wind over 30 yrs
- Air quality 4/10 Moderate 4 unhealthy d/yr today · 4 by 30 yrs out
Nearby sold comps map
Loading sold comps map…
Walkable amenities ~0.75 mi
Loading nearby amenities…
Taxation est. · year 1
- Rental income
- $51,516
- − Mortgage interest
- −$20,166
- − Property taxes
- −$5,400
- − Insurance
- −$1,800
- − Repairs & maintenance
- −$4,121
- − Management
- −$4,121
- − Depreciation
- −$10,473
- Taxable income
- $5,435
- Est. tax owed @ 24.0%
- −$1,304
- After-tax cash flow
- $9,539/yr
For passive investors: Depreciation is non-cash, so a rental often shows a tax loss while cash-flowing — sheltering income. Rental losses are passive: they offset passive income freely, and up to $25,000/yr can offset ordinary (W-2) income if you actively participate and your MAGI is under $100k (phasing out to $0 by $150k); unused losses carry forward. On sale, claimed depreciation is recaptured at up to 25%, and gains may owe capital-gains tax (a 1031 exchange can defer both). Figures are a year-1 estimate at your 24.0% rate — not tax advice; consult a CPA.
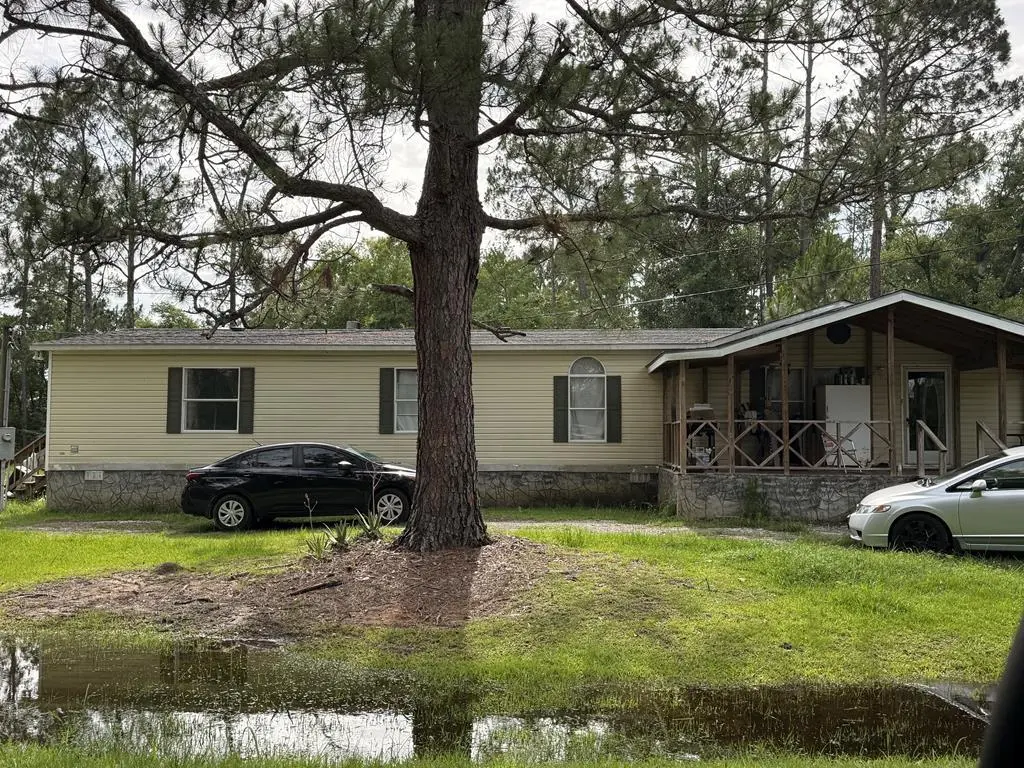
Condition & rehab AI · 2 photos
This multi-family property requires significant repairs and maintenance, including roof replacement, exterior painting, landscaping, HVAC system upgrade, and foundation repair. These improvements would significantly increase its resale and rental value.
Repairs flagged
- Major roof — The satellite image suggests potential roof leakage and damage.
- Major exterior siding — The siding is peeling and the paint is faded, indicating significant wear and tear.
- Major landscaping — The landscaping is overgrown and unkempt, requiring significant maintenance and improvement.
- Major foundation — The satellite image shows signs of uneven ground and potential structural issues, which may require foundation repair or stabilization.
- Major HVAC/mechanicals — No photos of the HVAC or mechanical systems are available to assess their condition, but the overall condition of the exterior suggests they may be in poor condition as well.
Value-add opportunities
- Both roof replacement — Replacing the roof would improve the home's appearance and functionality, attracting more renters and buyers.
- Both exterior painting and landscaping — Painting the exterior and landscaping would enhance the home's curb appeal and attract more renters and buyers.
- Both HVAC system upgrade — Upgrading the HVAC system would improve comfort and energy efficiency, making the home more attractive to renters and buyers.
- Both foundation repair — Repairing the foundation would address potential structural issues and improve the home's overall condition, attracting more renters and buyers.
Renovation cost estimate screening
| Repair item | Severity | Est. cost |
|---|---|---|
| roof · The satellite image suggests potential roof leakage and damage. | Major | $15,000–50,000 |
| exterior siding · The siding is peeling and the paint is faded, indicating significant wear and tear. | Major | $15,000–50,000 |
| landscaping · The landscaping is overgrown and unkempt, requiring significant maintenance and improvement. | Major | $15,000–50,000 |
| foundation · The satellite image shows signs of uneven ground and potential structural issues, which may require foundation repair or stabilization. | Major | $15,000–50,000 |
| HVAC/mechanicals · No photos of the HVAC or mechanical systems are available to assess their condition, but the overall condition of the exterior suggests they may be in poor condition as well. | Major | $15,000–50,000 |
| Total estimated repair cost · 5 items | $75,000–250,000 |
Value-add ROI direction
- Both roof replacement — Replacing the roof would improve the home's appearance and functionality, attracting more renters and buyers. ↑
- Both exterior painting and landscaping — Painting the exterior and landscaping would enhance the home's curb appeal and attract more renters and buyers. ↑
- Both HVAC system upgrade — Upgrading the HVAC system would improve comfort and energy efficiency, making the home more attractive to renters and buyers. ↑
- Both foundation repair — Repairing the foundation would address potential structural issues and improve the home's overall condition, attracting more renters and buyers. ↑
ⓘ Cost ranges are severity-bucket heuristics (US national rule-of-thumb). Get contractor quotes + a written scope before underwriting a rehab budget.
Schools (NCES district)
- District
- Coffee County
- NCES district ID
- 1301350
- Math proficiency
- 28% ▼ -12.00%
- Reading proficiency
- 31% ▼ -8.00%
- Median HH income
- $35,068
- Composite
- 24.36/100
- National rank
- #7693
- State rank
- #99 of 174 in GA
Livability — Nicholls
- Score
- 59/100
- State rank
- #415
- US rank
- #20531
Category grades
Schools grade is shown separately in the Schools card above.
Census & demographics
- Population (ZIP)
- 7,343
Population outlook (Coffee County) Hauer SSP2
- Today (2025)
- 43,255 people
- By 2030
- 43,007 · -0.6%
- By 2040
- 42,337 · -2.1%
- By 2050
- 41,505 · -4.0%
- By 2075
- 39,695 · -8.2%
- By 2100
- 36,090 · -16.6%
Race, ethnicity, and origin ACS 2023
- Neighborhood character
- Majority White (61%)
- Race & ethnicity
- White 61% Black 31% Two or more races 5% Hispanic / Latino 4%
- Common ancestry
- Slovak 2% Lithuanian 1% Italian 1%
- Foreign-born
- 2% · Canada
- Languages at home
- 96% English-only · Spanish 3%
Political lean MEDSL · Coffee
- 2024 margin
- Solid R (+45.1) · D 27.3% · R 72.5%
- 2008→2024 swing
- -15.6pp toward R · 2008: -29.5pp · 2024: -45.1pp
- All cycles
- 2024: R+45.1 2020: R+39.9 2016: R+39.5 2012: R+29.1 2008: R+29.5
Not yet ingested
- Civics
- —
Market trends
- HPI YoY
- ▲ 2.62%
- Current HPI
- 220.4768
- Rent YoY
- —
- Metro
- —
- State GDP YoY
- ▲ 2.66%
- F500 in state
- 28
Industry mix (Fortune 500 HQ in GA)
| Industry | F500 HQs | Revenue |
|---|---|---|
| Paper / Packaging | 2 | $29B |
|
||
| Retail | 1 | $160B |
|
||
| Transportation / Logistics | 1 | $91B |
|
||
| Airlines | 1 | $62B |
|
||
| Consumer Goods | 1 | $47B |
|
||
| Utilities | 1 | $25B |
|
||
Price history
1 event — show timeline
- 2026-06-03 Listed $360,000 SGMLS
Cash-flow waterfall
monthlySold comps — $/sqft
last 12 mo · ≤1 miLoading sold comps…