5421 Lake View Dr · Oak Trail Shores, TX
Flood risk 7/10 · Major
- FEMA flood zone
- X (shaded)
- Chance of flooding over 30 yrs
- 0.77%
- Est. flood insurance / yr
- $507 – $1,088
Fire risk 5/10 · Moderate
- Est. fire insurance / yr
- $1,222 – $2,270
Heat risk 7/10 · Major
- Hot days now (above 108°F)
- 7 days/yr
- Hot days in 30 yrs
- 23 days/yr
Wind risk 6/10 · Moderate
- Chance of severe wind over 30 yrs
- 27.0%
Air-quality risk 2/10 · Minimal
- Unhealthy air days now
- 1 days/yr
- Unhealthy air days in 30 yrs
- 2 days/yr
Risk factors via First Street. Map © Google.
Why this score? — see what drove the B+ grade
The composite is a weighted blend of 9 inputs, each scored 0–100. Each bar is that input's sub-score; the figure is the points it added to the 100-point composite (weight × sub-score).
- Cash flow +29.9/30.0
- ARV discount +15.0/15.0
- DSCR +10.0/10.0
- 1% rule +8.0/10.0
- Schools +4.0/10.0
- Livability +2.9/5.0
- Rent growth +2.8/5.0
- Condition / age +2.5/5.0
- Appreciation +0.0/10.0
$129,900
🖨 Deal sheet 📄 Offer letter ✓ Due diligence
Listing remarks MLS
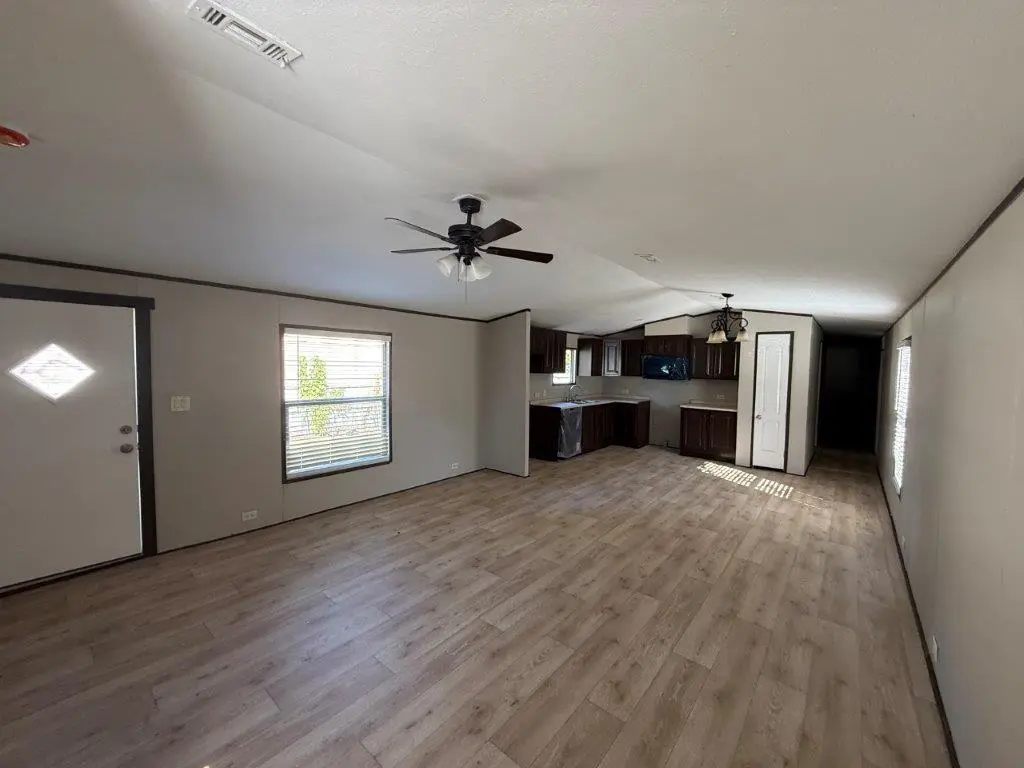
Beautifully refurbished home in a quiet Granbury neighborhood just moments from the Brazos River. This newly remodeled property features updated flooring, modern finishes, fresh paint, and comfortable living spaces throughout. The kitchen offers clean, stylish updates and great functionality, while the bedrooms provide a relaxing retreat. Enjoy a spacious yard with room for outdoor activities and easy access to nearby recreation, dining, and shopping. This move-in-ready home offers an excellent opportunity for anyone looking for a refreshed property in a desirable location. Owner financing is available, making this an accessible option for qualified buyers.
Key facts
- Refurbished home
- Brazos river
- 4,225 sq ft lot
Tags
Neighborhood map
What this means for you Summary
Snapshot
- This is a 4-bed/2.0-bath manufactured listed at $130k.
Deal economics
- At list price, monthly cash flow is $414 ($5k/yr) — positive.
- The deal already cash-flows at list — no discount required.
- Meets the 1% rule at list price ($2k rent vs $130k).
- Recommended offer: $114k (12.0% below list) — sets the bar for market timing.
- Cap rate 10.7% vs local median 5.9% in Oak Trail Shores — top-decile yield for the area; either an underpriced asset or a hidden risk that comps aren't pricing in. Stress-test before assuming the spread holds.
Location & tenants
- Location reads 58/100 on livability (#1,187 in TX) — a working-class tenant base; expect higher turnover. Strengths: cost of living A+, housing A+, crime B+; Watch: health & safety D+, schools F, amenities F.
- Granbury ISD (town): math 46% / reading 46% proficiency, ranked #237 of 826 in TX (top 29%) — families likely to look elsewhere, expect single-tenant / working-renter base with shorter leases.
- Market conditions: Rents rising (+1.1%/yr); 929 active listings in the ZIP; 4 comparable units currently listed for rent nearby; rentals lingering (median 44d on market — plan ~5-8 weeks vacancy on turnover, expect pricing pressure); 50% of comp listings sitting > 30 days — soft ceiling on asking rent; 125 units permitted in Hood County in 2024 (0 in 5+ unit buildings).
Forward outlook
- Local home prices are declining (-3.0%/yr); year-one equity from $898 of loan paydown is wiped out by about $4k of value loss. Plan a longer hold.
- Hood County population projected at +29% by 2050 — long-run rental-demand tailwind backs the buy-and-hold thesis.
Negotiation context
- It's been on market 219 days — a 12% lower offer ($114k) is reasonable based on typical stale-listing flexibility.
- 2 sale attempts with the ask held roughly flat each time — persistent listings suggest the price (not the market) is what's stuck; bring a comps-based counter.
Risks & watch-outs
- Watch-outs: flood insurance adds $66/mo.
- Climate carrying-cost: major flood risk; major wind risk, 27% chance of damaging wind over 30y; moderate wildfire risk; extreme-heat days projected 7→23/yr by 2055 (HVAC capex compounding) — expect insurance premiums to compound above CPI over the hold.
Questions for the listing agent
- It's been on market 219 days. Have you received any prior offers? Is the seller open to a 12% concession, seller financing, or rate buy-down credit?
- What's the actual annual flood-insurance premium (NFIP or private), and is the property in a SFHA with mandatory coverage?
- Why hasn't it sold? Are there any deal-killer items the seller is aware of (foundation, flood, title, zoning, code violations)?
- Is there a deadline driving the sale (1031 exchange, divorce, estate, relocation)? That informs how much negotiation room exists.
- Schools are F-rated, which usually means shorter tenancies and higher turnover. Who's the typical renter profile here, and what's been the actual vacancy rate?
- What's the average days-on-market for RENTAL listings here right now (not sales)? A rising rental-DOM trend means longer vacancies and softer asking-rent achievability than the comps imply.
- What's the recent tenant-quality profile in this submarket — average credit score on applications, eviction rate, late-payment / NSF rate, and stable-employment percentage? A property-management company in the area should have these aggregated.
- How much new for-sale + rental construction is in the pipeline within 1–3 miles? Heavy new supply typically softens prices + rents 12–24 months out; constrained supply supports both.
Investment metrics
- 1% rule
- 1.30% ✓
- Cap rate
- 10.73%
- Cash-on-cash
- 15.84%
- DSCR
- 1.70
- GRM
- 6.4
CMA / ARV
- ARV (median comp)
- $194,447
- List price
- $129,900
- Delta
- -33.20%
- Verdict
- UNDERPRICED
- Comps
- 20 within 1.0 mi
Show comp detail 6 sales within ~0.75 mi
| Address | Dist | Beds/Ba | Sqft | Sold | Price | $/sf | Match |
|---|---|---|---|---|---|---|---|
| 5428 Water View Dr | 0.04mi | 3/2.0 (-1) | 1,152 (-4%) | 8mo | $119,500 | $104 | 80 |
| 5528 Lake View Dr | 0.20mi | 3/2.0 (-1) | 1,310 (+9%) | 2mo | $154,900 | $118 | 69 |
| 3284 Flint Ct | 0.64mi | 3/2.0 (-1) | 1,216 (+1%) | 22mo | $130,000 | $107 | 45 |
| 5831 Arrowhead Dr | 0.66mi | 3/2.0 (-1) | 1,216 (+1%) | 22mo | $139,500 | $115 | 44 |
| 5803 Georgia Trl | 0.59mi | 3/2.0 (-1) | 1,116 (-7%) | 22mo | $165,000 | $148 | 37 |
| 5823 Arrowhead Dr | 0.61mi | 3/2.0 (-1) | 1,278 (+6%) | 22mo | $139,500 | $109 | 37 |
Match score weights: distance 35% · size 25% · config 20% · recency 20%. Top-matched comps best support the ARV.
Projected returns pro-forma
-3.0% appreciation · 1.1% rent growth · sell at horizon
- IRR
- 1.6%
- Equity multiple
- 1.06×
- Total profit
- $2,171
- Equity at exit
- $19,369
- IRR
- 9.2%
- Equity multiple
- 1.65×
- Total profit
- $23,478
- Equity at exit
- $11,231
Cash invested: $36,372 (down + closing). Projections, not guarantees.
Landlord ↔ Tenant lean methodology
- Overall (STATE)
- 87 Strongly Landlord-Friendly
- State Texas
- 87 Strongly Landlord-Friendly · R+5
- County
- — inherits STATE
- City
- — inherits STATE
ZIP-level market 76048
- Home prices YoY
- -23.4%
- Rents YoY
- 1.1%
- Active inventory
- 929
- Price-to-rent
- 6.4×
Monthly cashflow live
- Estimated rent
- $1,685 medium interval (Pro) →
- Mortgage (P&I)
- −$681
- Tax from tax record
- −$116 /mo · $1,388/yr
- Insurance
- −$54
- Flood insurance flood zone
- −$66 /mo · $798/yr
- HOA
- −$0
- Vacancy / Maint / Mgmt
- −$354
- Net cashflow
- $414
Break-even live
UW: 25.0% down · 7.5% · 30yr · 1.5% tax · 5.0% vac · 8.0% maint · 8.0% mgmt
Financing live
Cash to close
- Down payment
- $32,475
- Closing costs
- $3,897
- Reserves months
- —
- Total cash needed
- —
Loan-product check · same deal, 3 products live
Conventional
25% down · 7.5% · 30yr
- Down + closing
- —
- Monthly P&I
- —
- Monthly cashflow
- —
- DSCR
- —
- Eligible?
- —
Personal DTI + credit; lowest rate.
DSCR
20% down · 8.5% · 30yr
- Down + closing
- —
- Monthly P&I
- —
- Monthly cashflow
- —
- DSCR
- —
- Eligible?
- —
No personal income docs; deal must DSCR.
Hard money
10% down · 12.0% · 12mo
- Down + closing
- —
- Monthly P&I
- —
- Monthly cashflow
- —
- DSCR
- —
- Eligible?
- —
Short-term bridge; refi at stabilization.
Rent comps 4 comps
| Address | Beds | Baths | Sqft | Rent | $/sqft | DOM | Units | Dist |
|---|---|---|---|---|---|---|---|---|
| 5418 Lake View Dr Granbury, TX | 3.0 | 2.0 | 1284 | $1,300 | $1.01 | 43d | 1 | 0.01mi |
| 3225 Evergreen Dr Granbury, TX | 3.0 | 1.0 | 916 | $1,425 | $1.56 | 1d | 1 | 1.03mi |
| 4321 Terri Lee Ln Granbury, TX | 4.0 | 2.0 | 1387 | $2,075 | $1.50 | 1d | 1 | 1.32mi |
| 4214 W Virginia Dr Granbury, TX | 3.0 | 2.0 | 1064 | $1,595 | $1.50 | 43d | 1 | 1.44mi |
Listing history 18 events
-
2026-06-18days on market $129,900 Active 219 DOM
-
2026-06-17days on market $129,900 Active 218 DOM
-
2026-06-16days on market $129,900 Active 217 DOM
-
2026-06-15days on market $129,900 Active 216 DOM
-
2026-06-13days on market $129,900 Active 214 DOM
-
2026-06-09days on market $129,900 Active 210 DOM
-
2026-06-08days on market $129,900 Active 209 DOM
-
2026-06-07days on market $129,900 Active 208 DOM
-
2026-06-04days on market $129,900 Active 205 DOM
-
2026-06-03days on market $129,900 Active 204 DOM
-
2026-06-02days on market $129,900 Active 203 DOM
-
2026-06-02days on market $129,900 Active 202 DOM
-
2026-05-31days on market $129,900 Active 201 DOM
-
2025-11-10historical
Show marketing remark (665 chars)
Beautifully refurbished home in a quiet Granbury neighborhood just moments from the Brazos River. This newly remodeled property features updated flooring, modern finishes, fresh paint, and comfortable living spaces throughout. The kitchen offers clean, stylish updates and great functionality, while the bedrooms provide a relaxing retreat. Enjoy a spacious yard with room for outdoor activities and easy access to nearby recreation, dining, and shopping. This move-in-ready home offers an excellent opportunity for anyone looking for a refreshed property in a desirable location. Owner financing is available, making this an accessible option for qualified buyers.
-
2025-11-10$129,900 Active 665-char remark
Show marketing remark (665 chars)
Beautifully refurbished home in a quiet Granbury neighborhood just moments from the Brazos River. This newly remodeled property features updated flooring, modern finishes, fresh paint, and comfortable living spaces throughout. The kitchen offers clean, stylish updates and great functionality, while the bedrooms provide a relaxing retreat. Enjoy a spacious yard with room for outdoor activities and easy access to nearby recreation, dining, and shopping. This move-in-ready home offers an excellent opportunity for anyone looking for a refreshed property in a desirable location. Owner financing is available, making this an accessible option for qualified buyers.
-
2025-07-26$107,500 Active
-
2009-03-05soldstatus
-
1984-02-01soldstatus
ⓘ Source: listings_history table (triggers on properties + properties_extension) + one-shot
backfill from property_details.listing_events for pre-trigger history.
Tax reassessment forecast TX · Resets to sale price
- Current annual tax
- $1,388 · $116/mo
- Projected year-2 tax
- $2,377 · $198/mo
- Expected delta
- +$989/yr (+$82/mo · 71.3%)
ⓘ Screening estimate from a state-policy table — verify with the county assessor before closing.
Climate risk First Street
- Flood 7/10 Severe FEMA zone X (shaded) · 77% chance over 30 yrs
- Wildfire 5/10 Major
- Heat 7/10 Severe 7 d/yr ≥108°F today · 23 d/yr by 30 yrs out
- Wind 6/10 Major 27% chance of damaging wind over 30 yrs
- Air quality 2/10 Low 1 unhealthy d/yr today · 2 by 30 yrs out
Nearby sold comps map
Loading sold comps map…
Walkable amenities ~0.75 mi
Loading nearby amenities…
Taxation est. · year 1
- Rental income
- $20,219
- − Mortgage interest
- −$7,276
- − Property taxes
- −$1,388
- − Insurance
- −$1,447
- − Repairs & maintenance
- −$1,618
- − Management
- −$1,618
- − Depreciation
- −$3,779
- Taxable income
- $3,094
- Est. tax owed @ 24.0%
- −$742
- After-tax cash flow
- $4,221/yr
For passive investors: Depreciation is non-cash, so a rental often shows a tax loss while cash-flowing — sheltering income. Rental losses are passive: they offset passive income freely, and up to $25,000/yr can offset ordinary (W-2) income if you actively participate and your MAGI is under $100k (phasing out to $0 by $150k); unused losses carry forward. On sale, claimed depreciation is recaptured at up to 25%, and gains may owe capital-gains tax (a 1031 exchange can defer both). Figures are a year-1 estimate at your 24.0% rate — not tax advice; consult a CPA.
Schools (NCES district)
- District
- Granbury ISD
- NCES district ID
- 4821390
- Math proficiency
- 46% ▬ 0.00%
- Reading proficiency
- 46% ▲ 4.00%
- Median HH income
- $55,856
- Composite
- 40.04/100
- National rank
- #3820
- State rank
- #237 of 826 in TX
Livability — Oak Trail Shores
- Score
- 58/100
- State rank
- #1187
- US rank
- #20758
Category grades
Schools grade is shown separately in the Schools card above.
Census & demographics
- County
- Hood County · 58,506 people
- Metro
- Granbury, TX
- Population (ZIP)
- 27,000
- Household income
- $70,346
- Rent vs Own
- Severe rent burden
- 612.0
Population outlook (Hood County) Hauer SSP2
- Today (2025)
- 63,502 people
- By 2030
- 67,459 · +6.2%
- By 2040
- 74,958 · +18.0%
- By 2050
- 81,922 · +29.0%
- By 2075
- 98,872 · +55.7%
- By 2100
- 107,796 · +69.8%
Race, ethnicity, and origin ACS 2023
- Neighborhood character
- Predominantly White (80%)
- Race & ethnicity
- White 80% Hispanic / Latino 14% Two or more races 11% Black 1%
- Hispanic origin (detail)
- Mexican 13%
- Common ancestry
- Italian 2% Slovak 2% Portuguese 1%
- Foreign-born
- 4% · Canada
- Languages at home
- 89% English-only · Spanish 10%
Political lean MEDSL · Hood
- 2024 margin
- Solid R (+66.0) · D 16.6% · R 82.6%
- 2008→2024 swing
- -11.9pp toward R · 2008: -54.0pp · 2024: -66.0pp
- All cycles
- 2024: R+66.0 2020: R+64.1 2016: R+66.5 2012: R+64.7 2008: R+54.0
Not yet ingested
- Civics
- —
Market trends
- HPI YoY
- ▼ -83.25%
- Current HPI
- 272.2126
- Rent YoY
- ▲ 1.10%
- Metro
- Granbury, TX
- State GDP YoY
- ▲ 3.95%
- F500 in state
- 110
Industry mix (Fortune 500 HQ in TX)
| Industry | F500 HQs | Revenue |
|---|---|---|
| Energy | 16 | $1,198B |
|
||
| Technology | 5 | $198B |
|
||
| Engineering / Construction | 4 | $72B |
|
||
| Energy Services | 3 | $60B |
|
||
| Utilities | 3 | $41B |
|
||
| Healthcare | 2 | $330B |
|
||
Price history
+20.8% since first listed5 events — show timeline
- 2025-11-10 Listed $129,900 NTREIS
- 2025-11-10 Listing Removed — NTREIS
- 2025-07-26 Listed $107,500 NTREIS
- 2009-03-05 Sold (Public Records) — Public Records
- 1984-02-01 Sold (Public Records) — Public Records
Property tax history
+11.2%/yrLatest (2025): $1,388 · -1.2% YoY. Source: county tax records.
Cash-flow waterfall
monthlySold comps — $/sqft
last 12 mo · ≤1 miLoading sold comps…