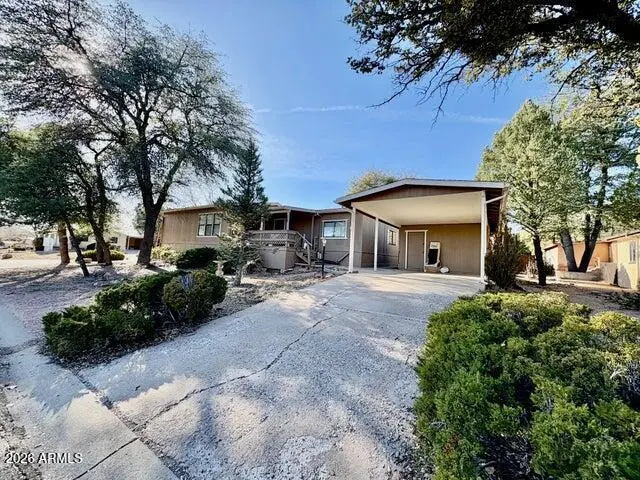
1100 W Driftwood Dr · Payson, AZ
Flood risk 1/10 · Minimal
- FEMA flood zone
- X (unshaded)
- Chance of flooding over 30 yrs
- 0.0%
- Est. flood insurance / yr
- $507 – $1,088
Fire risk 9/10 · Severe
- Est. fire insurance / yr
- $610 – $1,132
Heat risk 4/10 · Minor
- Hot days now (above 96°F)
- 7 days/yr
- Hot days in 30 yrs
- 20 days/yr
Wind risk 1/10 · Minimal
- Chance of severe wind over 30 yrs
- —
Air-quality risk 1/10 · Minimal
- Unhealthy air days now
- 0 days/yr
- Unhealthy air days in 30 yrs
- 0 days/yr
Risk factors via First Street. Map © Google.
Why this score? — see what drove the B grade
The composite is a weighted blend of 9 inputs, each scored 0–100. Each bar is that input's sub-score; the figure is the points it added to the 100-point composite (weight × sub-score).
- Cash flow +28.8/30.0
- ARV discount +15.0/15.0
- DSCR +10.0/10.0
- 1% rule +7.0/10.0
- Livability +3.5/5.0
- Rent growth +2.5/5.0
- Condition / age +2.5/5.0
- Schools +2.2/10.0
- Appreciation +0.0/10.0
$227,000
🖨 Deal sheet 📄 Offer letter ✓ Due diligence
Listing remarks MLS
3 bedroom 2 bath, split floor plan, beautiful fireplace, large living room,1983 CAVCO manufactured home in the lovely Woodland Meadows. Great corner lot. NO HOA. 2 car carport and a workshop. Has tie downs. Home is in need of TLC.
Key facts
- Beautiful fireplace
- Split floor plan
- Large living room
Tags
Neighborhood map
What this means for you Summary
Snapshot
- This is a 3-bed/2.0-bath manufactured listed at $227k.
Deal economics
- At list price, monthly cash flow is $766 ($9k/yr) — positive.
- The deal already cash-flows at list — no discount required.
- Meets the 1% rule at list price ($3k rent vs $227k).
- Recommended offer: $200k (12.0% below list) — sets the bar for market timing.
- Cap rate 10.3% vs local median 3.3% in Payson — top-decile yield for the area; either an underpriced asset or a hidden risk that comps aren't pricing in. Stress-test before assuming the spread holds.
Location & tenants
- Location reads 69/100 on livability (#44 in AZ) — a middle-class / working-renter tenant base. Strengths: housing A, crime B, cost of living B; Watch: schools C-, amenities D-, commute F.
- Payson Unified District (4209) (town): math 20% / reading 32% proficiency, ranked #138 of 249 in AZ (top 55%) — low school quality limits family demand, transient renter base, plan for 1-2y turnover.
- Market conditions: 695 active listings in the ZIP; 5 comparable units currently listed for rent nearby; rentals lingering (median 44d on market — plan ~5-8 weeks vacancy on turnover, expect pricing pressure); 80% of comp listings sitting > 30 days — soft ceiling on asking rent; 217 units permitted in Gila County in 2024 (0 in 5+ unit buildings).
- At $2,715/mo this rent would consume 49% of the median local household income ($66k/yr) (locally 523% of renters already pay >50% of income on rent) — very limited rent-growth headroom before tenants either downsize or default.
Forward outlook
- Local home prices are declining (-3.0%/yr); year-one equity from $2k of loan paydown is wiped out by about $7k of value loss. Plan a longer hold.
- Gila County population projected at -18% by 2050 — secular population decline; favor cash flow + early exit over multi-decade hold.
- At projected returns (-3.0% appreciation + 3.0% rent growth), your $64k cash investment doubles in ~9 years — after that, you're playing with house money.
Negotiation context
- It's been on market 161 days — a 12% lower offer ($200k) is reasonable based on typical stale-listing flexibility.
- 6 sale attempts since 4y ago; this cycle's ask has dropped $48k (17%) from the opening price — seller is motivated, your offer sets the floor, not the list.
Risks & watch-outs
- Climate carrying-cost: severe wildfire risk — expect insurance premiums to compound above CPI over the hold.
Questions for the listing agent
- It's been on market 161 days. Have you received any prior offers? Is the seller open to a 12% concession, seller financing, or rate buy-down credit?
- Why hasn't it sold? Are there any deal-killer items the seller is aware of (foundation, flood, title, zoning, code violations)?
- Is there a deadline driving the sale (1031 exchange, divorce, estate, relocation)? That informs how much negotiation room exists.
- What's the average days-on-market for RENTAL listings here right now (not sales)? A rising rental-DOM trend means longer vacancies and softer asking-rent achievability than the comps imply.
- What's the recent tenant-quality profile in this submarket — average credit score on applications, eviction rate, late-payment / NSF rate, and stable-employment percentage? A property-management company in the area should have these aggregated.
- How much new for-sale + rental construction is in the pipeline within 1–3 miles? Heavy new supply typically softens prices + rents 12–24 months out; constrained supply supports both.
Investment metrics
- 1% rule
- 1.20% ✓
- Cap rate
- 10.34%
- Cash-on-cash
- 14.46%
- DSCR
- 1.64
- GRM
- 7.0
CMA / ARV
- ARV (median comp)
- $331,757
- List price
- $227,000
- Delta
- -31.58%
- Verdict
- UNDERPRICED
- Comps
- 13 within 1.0 mi
Show comp detail 8 sales within ~0.75 mi
| Address | Dist | Beds/Ba | Sqft | Sold | Price | $/sf | Match |
|---|---|---|---|---|---|---|---|
| 1119 W Driftwood Dr | 0.11mi | 2/2.0 (-1) | 2,176 (+8%) | 2mo | $367,500 | $169 | 75 |
| 110 S Pinecrest Rd | 0.05mi | 3/2.0 | 1,824 (-10%) | 12mo | $299,990 | $164 | 72 |
| 905 W Driftwood Dr | 0.16mi | 2/2.0 (-1) | 1,792 (-11%) | 2mo | $336,600 | $188 | 67 |
| 101 N Lakeshore Rd | 0.06mi | 3/3.0 | 1,792 (-11%) | 13mo | $325,000 | $181 | 64 |
| 114 N Foothill Dr | 0.10mi | 3/2.0 | 1,724 (-14%) | 9mo | $346,500 | $201 | 64 |
| 103 N Bryce Cir | 0.34mi | 3/2.5 | 1,810 (-10%) | 10mo | $390,000 | $215 | 57 |
| 307 S Stone Creek Cir | 0.59mi | 3/2.0 | 1,768 (-12%) | 4mo | $340,000 | $192 | 49 |
| 208 N Whiting Dr | 0.32mi | 2/2.0 (-1) | 1,778 (-12%) | 15mo | $315,000 | $177 | 48 |
Match score weights: distance 35% · size 25% · config 20% · recency 20%. Top-matched comps best support the ARV.
Projected returns pro-forma
-3.0% appreciation · 3.0% rent growth · sell at horizon
- IRR
- 4.8%
- Equity multiple
- 1.19×
- Total profit
- $11,914
- Equity at exit
- $33,846
- IRR
- 14.3%
- Equity multiple
- 2.15×
- Total profit
- $72,871
- Equity at exit
- $19,627
Cash invested: $63,560 (down + closing). Projections, not guarantees.
Landlord ↔ Tenant lean methodology
- Overall (STATE)
- 87 Strongly Landlord-Friendly
- State Arizona
- 87 Strongly Landlord-Friendly · R+3
- County
- — inherits STATE
- City
- — inherits STATE
ZIP-level market 85541
- Home prices YoY
- -6.6%
- Active inventory
- 695
- Price-to-rent
- 7.0×
Monthly cashflow live
- Estimated rent
- $2,715 high interval (Pro) →
- Mortgage (P&I)
- −$1,190
- Tax from tax record
- −$94 /mo · $1,125/yr
- Insurance
- −$95
- HOA
- −$0
- Vacancy / Maint / Mgmt
- −$570
- Net cashflow
- $766
Break-even live
UW: 25.0% down · 7.5% · 30yr · 1.5% tax · 5.0% vac · 8.0% maint · 8.0% mgmt
Financing live
Cash to close
- Down payment
- $56,750
- Closing costs
- $6,810
- Reserves months
- —
- Total cash needed
- —
Loan-product check · same deal, 3 products live
Conventional
25% down · 7.5% · 30yr
- Down + closing
- —
- Monthly P&I
- —
- Monthly cashflow
- —
- DSCR
- —
- Eligible?
- —
Personal DTI + credit; lowest rate.
DSCR
20% down · 8.5% · 30yr
- Down + closing
- —
- Monthly P&I
- —
- Monthly cashflow
- —
- DSCR
- —
- Eligible?
- —
No personal income docs; deal must DSCR.
Hard money
10% down · 12.0% · 12mo
- Down + closing
- —
- Monthly P&I
- —
- Monthly cashflow
- —
- DSCR
- —
- Eligible?
- —
Short-term bridge; refi at stabilization.
Rent comps 5 comps
| Address | Beds | Baths | Sqft | Rent | $/sqft | DOM | Units | Dist |
|---|---|---|---|---|---|---|---|---|
| 400 S Canpar Way Payson, AZ | 3.0 | 2.0 | 1804 | $2,400 | $1.33 | 43d | 1 | 0.62mi |
| 816 N Blue Spruce Cir Payson, AZ | 4.0 | 3.0 | 3000 | $3,300 | $1.10 | 43d | 1 | 0.68mi |
| 955 W Ensenada Ln Payson, AZ | 2.0 | 2.5 | 1562 | $3,500 | $2.24 | 21d | 1 | 0.91mi |
| 605 N Spur Dr Unit B Payson, AZ | 2.0 | 2.0 | 1800 | $2,400 | $1.33 | 43d | 1 | 1.14mi |
| 605 N Spur Dr Payson, AZ | 2.0 | 2.0 | 1800 | $2,400 | $1.33 | 43d | 1 | 1.14mi |
Listing history 36 events
-
2026-06-19days on market $227,000 Active 161 DOM
-
2026-06-18days on market $227,000 Active 160 DOM
-
2026-06-17days on market $227,000 Active 159 DOM
-
2026-06-16days on market $227,000 Active 158 DOM
-
2026-06-15days on market $227,000 Active 157 DOM
-
2026-06-14days on market $227,000 Active 155 DOM
-
2026-06-12days on market $227,000 Active 154 DOM
-
2026-06-09days on market $227,000 Active 151 DOM
-
2026-06-08days on market $227,000 Active 150 DOM
-
2026-06-07remarks 695-char remark
-
2026-06-07days on market $227,000 Active 149 DOM
-
2026-06-03days on market $227,000 Active 145 DOM
-
2026-06-02days on market $227,000 Active 144 DOM
-
2026-06-01days on market $227,000 Active 143 DOM
-
2026-05-31days on market $227,000 Active 142 DOM
-
2026-05-31days on market $227,000 Active 141 DOM
-
2026-04-28status Active 230-char remark
Show marketing remark (230 chars)
3 bedroom 2 bath, split floor plan, beautiful fireplace, large living room,1983 CAVCO manufactured home in the lovely Woodland Meadows. Great corner lot. NO HOA. 2 car carport and a workshop. Has tie downs. Home is in need of TLC.
-
2026-04-27status Active 258-char remark
Show marketing remark (258 chars)
3 bedroom 2 bath, split floor plan, beautiful fireplace, large living room, 1983 CAVCO manufactured home in the lovely Woodland Meadows. Great corner lot. NO HOA. 2 car carport and a workshop. Has tie downs. Home is in need of TLC. This home is a short sale.
-
2026-04-04historical Under Contract Accepting Backups 230-char remark
Show marketing remark (230 chars)
3 bedroom 2 bath, split floor plan, beautiful fireplace, large living room,1983 CAVCO manufactured home in the lovely Woodland Meadows. Great corner lot. NO HOA. 2 car carport and a workshop. Has tie downs. Home is in need of TLC.
-
2026-04-02historical Active Under Contract 258-char remark
Show marketing remark (258 chars)
3 bedroom 2 bath, split floor plan, beautiful fireplace, large living room, 1983 CAVCO manufactured home in the lovely Woodland Meadows. Great corner lot. NO HOA. 2 car carport and a workshop. Has tie downs. Home is in need of TLC. This home is a short sale.
-
2026-04-01price $227,000 230-char remark
Show marketing remark (258 chars)
3 bedroom 2 bath, split floor plan, beautiful fireplace, large living room, 1983 CAVCO manufactured home in the lovely Woodland Meadows. Great corner lot. NO HOA. 2 car carport and a workshop. Has tie downs. Home is in need of TLC. This home is a short sale.
-
2026-04-01price $227,000 258-char remark
Show marketing remark (258 chars)
3 bedroom 2 bath, split floor plan, beautiful fireplace, large living room, 1983 CAVCO manufactured home in the lovely Woodland Meadows. Great corner lot. NO HOA. 2 car carport and a workshop. Has tie downs. Home is in need of TLC. This home is a short sale.
-
2026-01-09$275,000 Active 230-char remark
Show marketing remark (230 chars)
3 bedroom 2 bath, split floor plan, beautiful fireplace, large living room,1983 CAVCO manufactured home in the lovely Woodland Meadows. Great corner lot. NO HOA. 2 car carport and a workshop. Has tie downs. Home is in need of TLC.
-
2026-01-08$275,000 Active 258-char remark
Show marketing remark (258 chars)
3 bedroom 2 bath, split floor plan, beautiful fireplace, large living room, 1983 CAVCO manufactured home in the lovely Woodland Meadows. Great corner lot. NO HOA. 2 car carport and a workshop. Has tie downs. Home is in need of TLC. This home is a short sale.
-
2022-11-21soldstatus $257,500
-
2022-11-21soldstatus $257,500
-
2022-11-18soldstatus $257,500 Closed
-
2022-10-30status Pending
-
2022-10-03historical Under Contract Accepting Backups
-
2022-09-30price $250,000
-
2022-09-20price $265,000
-
2022-09-14price $285,000
-
2022-09-02$250,000
-
2022-09-02$295,000 Active
-
2002-04-16soldstatus $114,900
-
1994-01-10soldstatus $89,500
ⓘ Source: listings_history table (triggers on properties + properties_extension) + one-shot
backfill from property_details.listing_events for pre-trigger history.
Tax reassessment forecast AZ · Resets to sale price
- Current annual tax
- $1,125 · $94/mo
- Projected year-2 tax
- $1,498 · $125/mo
- Expected delta
- +$373/yr (+$31/mo · 33.2%)
ⓘ Screening estimate from a state-policy table — verify with the county assessor before closing.
Climate risk First Street
- Flood 1/10 Low FEMA zone X (unshaded) · 0% chance over 30 yrs
- Wildfire 9/10 Extreme
- Heat 4/10 Moderate 7 d/yr ≥96°F today · 20 d/yr by 30 yrs out
- Wind 1/10 Low
- Air quality 1/10 Low 0 unhealthy d/yr today · 0 by 30 yrs out
Nearby sold comps map
Loading sold comps map…
Walkable amenities ~0.75 mi
Loading nearby amenities…
Taxation est. · year 1
- Rental income
- $32,575
- − Mortgage interest
- −$12,716
- − Property taxes
- −$1,125
- − Insurance
- −$1,135
- − Repairs & maintenance
- −$2,606
- − Management
- −$2,606
- − Depreciation
- −$6,604
- Taxable income
- $5,784
- Est. tax owed @ 24.0%
- −$1,388
- After-tax cash flow
- $7,801/yr
For passive investors: Depreciation is non-cash, so a rental often shows a tax loss while cash-flowing — sheltering income. Rental losses are passive: they offset passive income freely, and up to $25,000/yr can offset ordinary (W-2) income if you actively participate and your MAGI is under $100k (phasing out to $0 by $150k); unused losses carry forward. On sale, claimed depreciation is recaptured at up to 25%, and gains may owe capital-gains tax (a 1031 exchange can defer both). Figures are a year-1 estimate at your 24.0% rate — not tax advice; consult a CPA.
Schools (NCES district)
- District
- Payson Unified District (4209)
- NCES district ID
- 0406070
- Math proficiency
- 20% ▼ -21.00%
- Reading proficiency
- 32% ▼ -16.00%
- Median HH income
- $41,440
- Composite
- 22.03/100
- National rank
- #8200
- State rank
- #138 of 249 in AZ
Livability — Payson
- Score
- 69/100
- State rank
- #44
- US rank
- #8740
Category grades
Schools grade is shown separately in the Schools card above.
Census & demographics
- Census place
- Payson, AZ
- County
- Gila County · 23,382 people
- City population
- 23,382
- Metro
- Payson, AZ
- Population (ZIP)
- 23,382
- Household income
- $66,383
- Rent vs Own
- Severe rent burden
- 523.0
Population outlook (Gila County) Hauer SSP2
- Today (2025)
- 50,229 people
- By 2030
- 48,202 · -4.0%
- By 2040
- 44,101 · -12.2%
- By 2050
- 41,041 · -18.3%
- By 2075
- 37,536 · -25.3%
- By 2100
- 32,485 · -35.3%
Race, ethnicity, and origin ACS 2023
- Neighborhood character
- Predominantly White (84%)
- Race & ethnicity
- White 84% Hispanic / Latino 11% Two or more races 8% Native American 1%
- Hispanic origin (detail)
- Mexican 9%
- Common ancestry
- Portuguese 3% Lithuanian 2% Iranian 2%
- Foreign-born
- 3% · Canada
- Languages at home
- 93% English-only · Spanish 5% German/W. Germanic 1%
Political lean MEDSL · Gila
- 2024 margin
- Solid R (+37.6) · D 30.8% · R 68.4%
- 2008→2024 swing
- -9.8pp toward R · 2008: -27.8pp · 2024: -37.6pp
- All cycles
- 2024: R+37.6 2020: R+34.1 2016: R+32.4 2012: R+26.4 2008: R+27.8
Not yet ingested
- Civics
- —
Market trends
- HPI YoY
- ▼ -29.47%
- Current HPI
- 416.4005
- Rent YoY
- —
- Metro
- Payson, AZ
- State GDP YoY
- ▲ 4.54%
- F500 in state
- 20
Industry mix (Fortune 500 HQ in AZ)
| Industry | F500 HQs | Revenue |
|---|---|---|
| Technology | 2 | $13B |
|
||
| Mining / Metals | 1 | $23B |
|
||
| Environmental Services | 1 | $16B |
|
||
| Metals / Steel | 1 | $14B |
|
||
| Technology Distribution | 1 | $9B |
|
||
| Homebuilding | 1 | $8B |
|
||
Price history
+153.6% since first listed20 events — show timeline
- 2026-04-28 Relisted — ARMLS
- 2026-04-27 Relisted — CAAR
- 2026-04-04 Contingent — ARMLS
- 2026-04-02 Contingent — CAAR
- 2026-04-01 Price Changed $227,000 ARMLS
- 2026-04-01 Price Changed $227,000 CAAR
- 2026-01-09 Listed $275,000 ARMLS
- 2026-01-08 Listed $275,000 CAAR
- 2022-11-21 Sold (Public Records) $257,500 Public Records
- 2022-11-21 Sold (MLS) $257,500 CAAR
- 2022-11-18 Sold (MLS) $257,500 ARMLS
- 2022-10-30 Pending — ARMLS
- 2022-10-03 Contingent — ARMLS
- 2022-09-30 Price Changed $250,000 ARMLS
- 2022-09-20 Price Changed $265,000 ARMLS
- 2022-09-14 Price Changed $285,000 ARMLS
- 2022-09-02 Listed $295,000 ARMLS
- 2022-09-02 Listed $250,000 CAAR
- 2002-04-16 Sold (Public Records) $114,900 Public Records
- 1994-01-10 Sold (Public Records) $89,500 Public Records
Property tax history
+0.2%/yrLatest (2025): $1,125 · -2.0% YoY. Source: county tax records.
Cash-flow waterfall
monthlySold comps — $/sqft
last 12 mo · ≤1 miLoading sold comps…