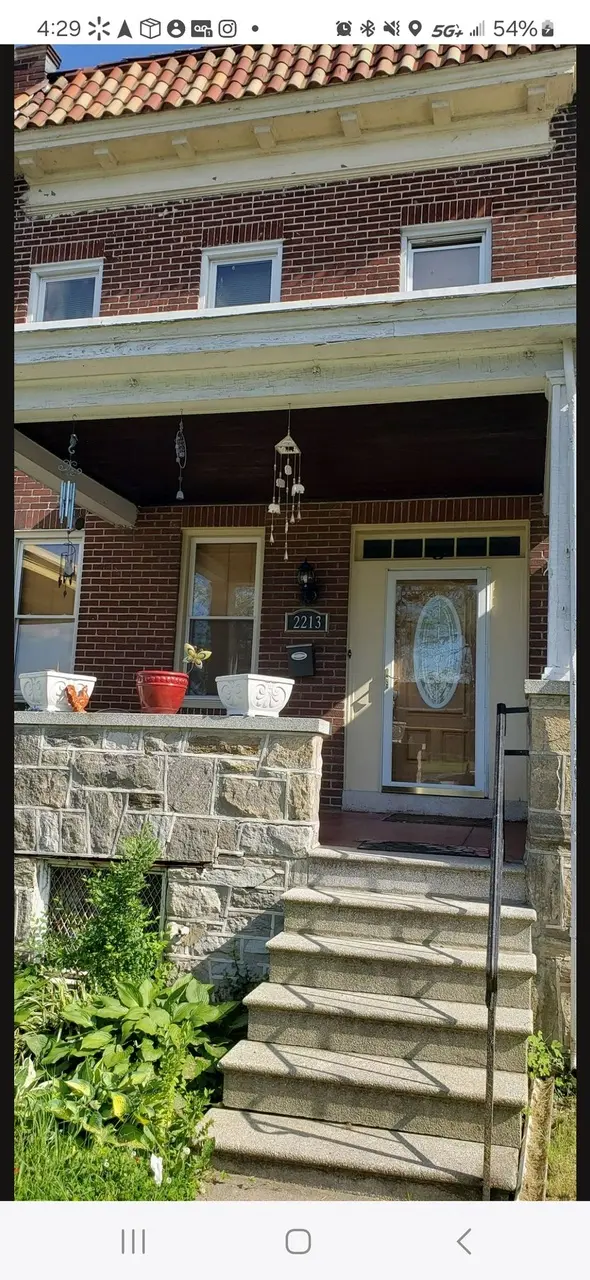
2213 Windsor Ave · Baltimore, MD
Flood risk 1/10 · Minimal
- FEMA flood zone
- X (unshaded)
- Chance of flooding over 30 yrs
- 0.0%
- Est. flood insurance / yr
- $473 – $860
Fire risk 1/10 · Minimal
- Est. fire insurance / yr
- $755 – $1,403
Heat risk 7/10 · Major
- Hot days now (above 103°F)
- 7 days/yr
- Hot days in 30 yrs
- 15 days/yr
Wind risk 6/10 · Moderate
- Chance of severe wind over 30 yrs
- 27.0%
Air-quality risk 3/10 · Minor
- Unhealthy air days now
- 3 days/yr
- Unhealthy air days in 30 yrs
- 4 days/yr
Risk factors via First Street. Map © Google.
Why this score? — see what drove the C- grade
The composite is a weighted blend of 9 inputs, each scored 0–100. Each bar is that input's sub-score; the figure is the points it added to the 100-point composite (weight × sub-score).
- Cash flow +26.8/30.0
- DSCR +9.2/10.0
- 1% rule +6.6/10.0
- Rent growth +4.0/5.0
- Livability +3.8/5.0
- Condition / age +2.5/5.0
- Schools +1.0/10.0
- ARV discount +0.0/15.0
- Appreciation +0.0/10.0
$144,000
🖨 Deal sheet 📄 Offer letter ✓ Due diligence
Listing remarks MLS
Wow!!! 3Bedrooms, full finished basement, 2 car garage, 1.5 baths, new appliances all for under $130,000.
Key facts
- Near druid hill park
- Near mondawmin mall
- Near metro stations
Tags
Neighborhood map
What this means for you Summary
Snapshot
- This is a 3-bed/1.5-bath townhouse listed at $144k.
Deal economics
- At list price, monthly cash flow is $393 ($5k/yr) — positive.
- The deal already cash-flows at list — no discount required.
- Meets the 1% rule at list price ($2k rent vs $144k).
- Cap rate 9.6% vs local median 6.0% in Baltimore — top-decile yield for the area; either an underpriced asset or a hidden risk that comps aren't pricing in. Stress-test before assuming the spread holds.
Location & tenants
- Location reads 76/100 on livability (#90 in MD, #3,396 nationally) — a middle-class / working-renter tenant base. Strengths: amenities A+, commute A+, housing A+; Watch: schools D, crime F.
- Baltimore City Public Schools (urban): math 7% / reading 16% proficiency, ranked #24 of 24 in MD (top 100%) — low school quality limits family demand, transient renter base, plan for 1-2y turnover; 79% free/reduced lunch — lower-income household profile, screen leases tightly.
- Market conditions: Rents rising fast (+6.1%/yr); 252 active listings in the ZIP; 40 comparable units currently listed for rent nearby; rentals at typical pace (median 24d on market — plan ~3-4 weeks tenant-placement turnaround); lower-income renter base — watch delinquency; 1,273 units permitted in Baltimore city in 2024 (1,104 in 5+ unit buildings).
- At $1,667/mo this rent would consume 48% of the median local household income ($42k/yr) (locally 2264% of renters already pay >50% of income on rent) — very limited rent-growth headroom before tenants either downsize or default.
Forward outlook
- Local home prices are declining (-3.0%/yr); year-one equity from $996 of loan paydown is wiped out by about $4k of value loss. Plan a longer hold.
- Baltimore County population projected to shrink 4% by 2050 — rents likely to lag national; underwrite the cash flow, not the appreciation.
- At projected returns (-3.0% appreciation + 6.1% rent growth), your $40k cash investment doubles in ~8 years — after that, you're playing with house money.
Negotiation context
- Only 14 days on market — expect competitive offers; lowballing is unlikely to land.
- 3 sale attempts since 31y ago; this cycle's ask has dropped $15k (9%) from the opening price — seller is motivated, your offer sets the floor, not the list.
- Current owner paid $125k; 15% above their basis — modest negotiation headroom, anchor on the comps not their cost.
Risks & watch-outs
- Watch-outs: built in 1940 — expect roof / HVAC / electrical / plumbing capex.
- Climate carrying-cost: major wind risk, 27% chance of damaging wind over 30y; extreme-heat days projected 7→15/yr by 2055 (HVAC capex compounding) — expect insurance premiums to compound above CPI over the hold.
Questions for the listing agent
- Built in 1940 — when were the roof, HVAC, electrical panel, plumbing, and water heater last replaced?
- Is there a deadline driving the sale (1031 exchange, divorce, estate, relocation)? That informs how much negotiation room exists.
- Schools are D-rated, which usually means shorter tenancies and higher turnover. Who's the typical renter profile here, and what's been the actual vacancy rate?
- Crime grade is F in this area — have there been break-ins, vandalism, or insurance claims at this property in the last 3 years? What carrier currently insures it and at what premium?
- What's the average days-on-market for RENTAL listings here right now (not sales)? A rising rental-DOM trend means longer vacancies and softer asking-rent achievability than the comps imply.
- What's the recent tenant-quality profile in this submarket — average credit score on applications, eviction rate, late-payment / NSF rate, and stable-employment percentage? A property-management company in the area should have these aggregated.
- How much new for-sale + rental construction is in the pipeline within 1–3 miles? Heavy new supply typically softens prices + rents 12–24 months out; constrained supply supports both.
Investment metrics
- 1% rule
- 1.16% ✓
- Cap rate
- 9.57%
- Cash-on-cash
- 11.71%
- DSCR
- 1.52
- GRM
- 7.2
CMA / ARV
- ARV (on-the-fly)
- $109,200
- Comps found
- 12
Show comp detail 12 sales within ~0.75 mi
| Address | Dist | Beds/Ba | Sqft | Sold | Price | $/sf | Match |
|---|---|---|---|---|---|---|---|
| 2311 Orem Ave | 0.47mi | 3/1.0 | 1,284 (-1%) | 4mo | $35,000 | $27 | 70 |
| 2820 Woodbrook Ave | 0.43mi | 3/1.5 | 1,232 (-5%) | 2mo | $85,000 | $69 | 70 |
| 3014 Tioga Pkwy | 0.41mi | 3/1.0 | 1,360 (+5%) | 4mo | $180,000 | $132 | 68 |
| 2818 Woodbrook Ave | 0.43mi | 3/1.0 | 1,232 (-5%) | 3mo | $45,500 | $37 | 66 |
| 1537 N Smallwood St | 0.45mi | 3/1.5 | 1,200 (-8%) | 3mo | $56,000 | $47 | 64 |
| 700 Cumberland St | 0.65mi | 4/2.0 (+1) | 1,280 (-2%) | 3mo | $107,800 | $84 | 58 |
| 1722 N Bentalou St | 0.30mi | 4/2.0 (+1) | 1,450 (+12%) | 3mo | $245,000 | $169 | 57 |
| 2305 Poplar Grove St | 0.65mi | 3/2.0 | 1,200 (-8%) | 1mo | $118,000 | $98 | 54 |
| 2801 Presbury St | 0.66mi | 3/1.0 | 1,200 (-8%) | 4mo | $60,000 | $50 | 51 |
| 1719 Baker St | 0.61mi | 2/1.0 (-1) | 1,400 (+8%) | 2mo | $19,250 | $14 | 50 |
| 1552 N Fulton Ave | 0.58mi | 3/1.0 | 1,113 (-14%) | 4mo | $125,000 | $112 | 44 |
| 2727 Baker St | 0.62mi | 3/1.0 | 1,116 (-14%) | 3mo | $125,000 | $112 | 43 |
Match score weights: distance 35% · size 25% · config 20% · recency 20%. Top-matched comps best support the ARV.
Projected returns pro-forma
-3.0% appreciation · 6.1% rent growth · sell at horizon
- IRR
- 4.4%
- Equity multiple
- 1.18×
- Total profit
- $7,068
- Equity at exit
- $21,471
- IRR
- 16.4%
- Equity multiple
- 2.53×
- Total profit
- $61,788
- Equity at exit
- $12,450
Cash invested: $40,320 (down + closing). Projections, not guarantees.
Landlord ↔ Tenant lean methodology
- Overall (CITY)
- 12 Strongly Tenant-Friendly
- State Maryland
- 27 Tenant-Leaning · D+14
- County
- — inherits STATE
- City Baltimore
- 12 Strongly Tenant-Friendly · D+58
ZIP-level market 21216
- Rents YoY
- 6.1%
- Active inventory
- 252
- Price-to-rent
- 7.2×
Monthly cashflow live
- Estimated rent
- $1,667 high interval (Pro) →
- Mortgage (P&I)
- −$755
- Tax from tax record
- −$108 /mo · $1,297/yr
- Insurance
- −$60
- HOA
- −$0
- Vacancy / Maint / Mgmt
- −$350
- Net cashflow
- $393
Break-even live
UW: 25.0% down · 7.5% · 30yr · 1.5% tax · 5.0% vac · 8.0% maint · 8.0% mgmt
Financing live
Cash to close
- Down payment
- $36,000
- Closing costs
- $4,320
- Reserves months
- —
- Total cash needed
- —
Loan-product check · same deal, 3 products live
Conventional
25% down · 7.5% · 30yr
- Down + closing
- —
- Monthly P&I
- —
- Monthly cashflow
- —
- DSCR
- —
- Eligible?
- —
Personal DTI + credit; lowest rate.
DSCR
20% down · 8.5% · 30yr
- Down + closing
- —
- Monthly P&I
- —
- Monthly cashflow
- —
- DSCR
- —
- Eligible?
- —
No personal income docs; deal must DSCR.
Hard money
10% down · 12.0% · 12mo
- Down + closing
- —
- Monthly P&I
- —
- Monthly cashflow
- —
- DSCR
- —
- Eligible?
- —
Short-term bridge; refi at stabilization.
Rent comps 40 comps
| Address | Beds | Baths | Sqft | Rent | $/sqft | DOM | Units | Dist |
|---|---|---|---|---|---|---|---|---|
| 2204 Clifton Ave Baltimore, MD | 3.0 | 1.0 | 1400 | $1,450 | $1.04 | 4d | 1 | 0.08mi |
| 1930 N Payson St Baltimore, MD | 2.0 | 2.0 | 980 | $1,500 | $1.53 | 23d | 1 | 0.26mi |
| 1816 N Bentalou St Baltimore, MD | 3.0 | 2.0 | 1350 | $1,700 | $1.26 | 23d | 1 | 0.28mi |
| 1816 N Bentalou St Baltimore, MD | 3.0 | 2.0 | 1350 | $1,700 | $1.26 | 10d | 1 | 0.28mi |
| 2405 W North Ave Baltimore, MD | 4.0 | 3.0 | 1826 | $1,900 | $1.04 | 4d | 1 | 0.28mi |
| 2201 Whittier Ave Baltimore, MD | 4.0 | 2.0 | 1750 | $1,700 | $0.97 | 17d | 1 | 0.35mi |
| 2201 Whittier Ave Baltimore, MD | 4.0 | 2.0 | 1750 | $1,700 | $0.97 | 43d | 1 | 0.35mi |
| 1617-A Moreland Ave Unit 2nd Flr Baltimore, MD | 2.0 | 1.0 | 1500 | $1,400 | $0.93 | 43d | 1 | 0.39mi |
| 2231 Orem Ave Baltimore, MD | 3.0 | 1.5 | 1140 | $1,750 | $1.54 | 17d | 1 | 0.39mi |
| 3401 Woodbrook Ave Unit 1 Baltimore, MD | 3.0 | 1.0 | 900 | $1,199 | $1.33 | 23d | 1 | 0.40mi |
| 2301 Whittier Ave Unit 2 Baltimore, MD | 2.0 | 2.0 | 1104 | $1,400 | $1.27 | 43d | 1 | 0.40mi |
| 2301 Whittier Ave Unit 1 Baltimore, MD | 2.0 | 1.0 | 1104 | $1,400 | $1.27 | 43d | 1 | 0.40mi |
| 2301 Whittier Ave Unit 3 Baltimore, MD | 2.0 | 2.0 | 1104 | $1,650 | $1.49 | 43d | 1 | 0.40mi |
| 2636 W North Ave Baltimore, MD | 2.0–3.0 | 1.0–2.0 | 975 | $1,475 | $1.51 | 4d | 1 | 0.42mi |
| 3104 Tioga Pkwy Baltimore, MD | 3.0 | 2.0 | 1640 | $2,050 | $1.25 | 21d | 1 | 0.43mi |
| 1617 Moreland Ave Baltimore, MD | 2.0 | 1.0 | 900 | $1,450 | $1.61 | 23d | 1 | 0.43mi |
| 1722 N Monroe St Baltimore, MD | 3.0 | 1.5 | 1000 | $1,350 | $1.35 | 23d | 1 | 0.44mi |
| 2330 Bryant Ave Unit 4 Baltimore, MD | 2.0 | 1.0 | 950 | $1,500 | $1.58 | 20d | 1 | 0.45mi |
| 2636 Pennsylvania Ave Baltimore, MD | 1.0–2.0 | 1.0 | 846 | $956 | $1.13 | 23d | 4 | 0.49mi |
| 2614 Pennsylvania Ave Baltimore, MD | 1.0–3.0 | 1.0–2.0 | 982 | $1,141 | $1.16 | 4d | 4 | 0.52mi |
| 1729 N Fulton Ave Baltimore, MD | 3.0 | 2.0 | 1081 | $1,795 | $1.66 | 43d | 1 | 0.52mi |
| 1806 N Mount St Baltimore, MD | 3.0 | 3.0 | 1200 | $1,700 | $1.42 | 19d | 1 | 0.54mi |
| 1616 N Fulton Ave Baltimore, MD | 3.0 | 2.0 | 1620 | $1,795 | $1.11 | 4d | 1 | 0.57mi |
| 2505 Woodbrook Ave Baltimore, MD | 4.0 | 2.0 | 1256 | $1,745 | $1.39 | 1d | 1 | 0.58mi |
| 1624 Westwood Ave Baltimore, MD | 3.0 | 2.0 | 1000 | $1,900 | $1.90 | 43d | 1 | 0.58mi |
| 2812 Clifton Ave Baltimore, MD | 3.0 | 1.5 | 1650 | $1,850 | $1.12 | 43d | 1 | 0.58mi |
| 1501 N Payson St Baltimore, MD | 3.0 | 1.0 | 1400 | $1,550 | $1.11 | 43d | 1 | 0.59mi |
| 2910 Reisterstown Rd Baltimore, MD | 1.0–3.0 | 1.0 | 950 | $1,414 | $1.49 | 14d | 4 | 0.59mi |
| 1515 Retreat St Baltimore, MD | 3.0 | 2.0 | 1098 | $1,800 | $1.64 | 23d | 1 | 0.62mi |
| 1507 Retreat St Unit 1 Baltimore, MD | 3.0 | 3.0 | 1098 | $2,500 | $2.28 | 43d | 1 | 0.64mi |
| 2917 Clifton Ave Baltimore, MD | 4.0 | 4.0 | 1700 | $2,150 | $1.26 | 23d | 1 | 0.68mi |
| 1516 N Mount St Baltimore, MD | 3.0 | 1.5 | 1830 | $1,750 | $0.96 | 14d | 1 | 0.69mi |
| 1433 N Fulton Ave Baltimore, MD | 2.0 | 1.0 | 1200 | $1,500 | $1.25 | 43d | 1 | 0.71mi |
| 1614 N Calhoun St Baltimore, MD | 2.0 | 1.0 | 950 | $1,300 | $1.37 | 43d | 1 | 0.72mi |
| 2409 Francis St Baltimore, MD | 3.0 | 1.0 | 1298 | $1,500 | $1.16 | 43d | 1 | 0.73mi |
| 2449 Druid Hill Ave Baltimore, MD | 2.0 | 1.0 | 1100 | $1,800 | $1.64 | 43d | 1 | 0.75mi |
| 2433 Druid Hill Ave Baltimore, MD | 2.0 | 2.5 | 1092 | $1,999 | $1.83 | 43d | 1 | 0.76mi |
| 2800 Presstman St Baltimore, MD | 3.0 | 2.5 | 1460 | $1,799 | $1.23 | 23d | 1 | 0.77mi |
| 519 Sanford Pl Baltimore, MD | 3.0 | 1.0 | 1300 | $1,650 | $1.27 | 16d | 1 | 0.78mi |
| 1534 N Stricker St Baltimore, MD | 2.0 | 1.5 | 900 | $1,475 | $1.64 | 14d | 1 | 0.78mi |
Listing history 11 events
-
2026-06-18price $144,000 Active 14 DOM
-
2026-06-18days on market $159,000 Active 14 DOM
-
2026-06-17days on market $159,000 Active 13 DOM
-
2026-06-16days on market $159,000 Active 12 DOM
-
2026-06-15days on market $159,000 Active 11 DOM
-
2026-06-13days on market $159,000 Active 9 DOM
-
2026-06-09days on market $159,000 Active 5 DOM
-
2026-06-08days on market $159,000 Active 4 DOM
-
2026-06-07days on market $159,000 Active 3 DOM
-
2026-06-04remarks 699-char remark
-
2026-06-04$159,000 Active 1 DOM
ⓘ Source: listings_history table (triggers on properties + properties_extension) + one-shot
backfill from property_details.listing_events for pre-trigger history.
Tax reassessment forecast MD · Partial reset (capped growth)
- Current annual tax
- $1,297 · $108/mo
- Projected year-2 tax
- $1,433 · $119/mo
- Expected delta
- +$137/yr (+$11/mo · 10.5%)
ⓘ Screening estimate from a state-policy table — verify with the county assessor before closing.
Climate risk First Street
- Flood 1/10 Low FEMA zone X (unshaded) · 0% chance over 30 yrs
- Wildfire 1/10 Low
- Heat 7/10 Severe 7 d/yr ≥103°F today · 15 d/yr by 30 yrs out
- Wind 6/10 Major 27% chance of damaging wind over 30 yrs
- Air quality 3/10 Moderate 3 unhealthy d/yr today · 4 by 30 yrs out
Nearby sold comps map
Loading sold comps map…
Walkable amenities ~0.75 mi
Loading nearby amenities…
Taxation est. · year 1
- Rental income
- $20,000
- − Mortgage interest
- −$8,066
- − Property taxes
- −$1,297
- − Insurance
- −$720
- − Repairs & maintenance
- −$1,600
- − Management
- −$1,600
- − Depreciation
- −$4,189
- Taxable income
- $2,528
- Est. tax owed @ 24.0%
- −$607
- After-tax cash flow
- $4,115/yr
For passive investors: Depreciation is non-cash, so a rental often shows a tax loss while cash-flowing — sheltering income. Rental losses are passive: they offset passive income freely, and up to $25,000/yr can offset ordinary (W-2) income if you actively participate and your MAGI is under $100k (phasing out to $0 by $150k); unused losses carry forward. On sale, claimed depreciation is recaptured at up to 25%, and gains may owe capital-gains tax (a 1031 exchange can defer both). Figures are a year-1 estimate at your 24.0% rate — not tax advice; consult a CPA.
Schools (NCES district)
- District
- Baltimore City Public Schools
- NCES district ID
- 2400090
- Math proficiency
- 7% ▼ -9.00%
- Reading proficiency
- 16% ▼ -5.00%
- Median HH income
- $42,108
- Composite
- 10.08/100
- National rank
- #9805
- State rank
- #24 of 24 in MD
Livability — Baltimore
- Score
- 76/100
- State rank
- #90
- US rank
- #3396
Category grades
Schools grade is shown separately in the Schools card above.
Census & demographics
- Census place
- Baltimore, MD
- County
- Baltimore City · 558,601 people
- City population
- 588,727
- Metro
- Baltimore-Columbia-Towson, MD
- Population (ZIP)
- 29,426
- Household income
- $42,031
- Rent vs Own
- Severe rent burden
- 2264.0
Population outlook (Baltimore County) Hauer SSP2
- Today (2025)
- 624,249 people
- By 2030
- 621,541 · -0.4%
- By 2040
- 609,756 · -2.3%
- By 2050
- 597,249 · -4.3%
- By 2075
- 552,236 · -11.5%
- By 2100
- 513,934 · -17.7%
Race, ethnicity, and origin ACS 2023
- Neighborhood character
- Predominantly Black (91%)
- Race & ethnicity
- Black 91% Hispanic / Latino 4% Two or more races 3% White 2%
- Foreign-born
- 3% · Canada
- Languages at home
- 96% English-only · Spanish 3% French/Haitian/Cajun 1%
Political lean MEDSL · Baltimore
- 2024 margin
- Solid D (+73.0) · D 85.2% · R 12.2% · Other 2.6%
- 2008→2024 swing
- -2.5pp toward R · 2008: 75.5pp · 2024: 73.0pp
- All cycles
- 2024: D+73.0 2020: D+76.6 2016: D+74.6 2012: D+76.4 2008: D+75.5
Not yet ingested
- Civics
- —
Market trends
- HPI YoY
- ▼ -107.42%
- Current HPI
- 164.3933
- Rent YoY
- ▲ 6.10%
- Metro
- Baltimore-Columbia-Towson, MD
- State GDP YoY
- ▲ 2.97%
- F500 in state
- 12
Industry mix (Fortune 500 HQ in MD)
| Industry | F500 HQs | Revenue |
|---|---|---|
| Aerospace / Defense | 1 | $71B |
|
||
| Utilities | 1 | $25B |
|
||
| Hotels | 1 | $24B |
|
||
| Consumer Goods | 1 | $7B |
|
||
| Real Estate | 1 | $6B |
|
||
| Chemicals | 1 | $2B |
|
||
Price history
+169.5% since first listed9 events — show timeline
- 2026-06-04 Listed $159,000 ForSaleByOwner.com
- 2008-03-24 Sold (Public Records) $125,000 Public Records
- 2008-02-22 Sold (MLS) $125,000 MRIS
- 2008-02-03 Delisted — MRIS
- 2008-02-03 Listed $125,000 MRIS
- 1995-08-14 Sold (Public Records) $59,000 Public Records
- 1995-08-03 Sold (MLS) $59,000 MRIS
- 1995-06-19 Delisted — MRIS
- 1995-04-27 Listed $59,000 MRIS
Property tax history
+1.1%/yrLatest (2025): $1,297 · +10.1% YoY. Source: county tax records.
Cash-flow waterfall
monthlySold comps — $/sqft
last 12 mo · ≤1 miLoading sold comps…