 Fourplex
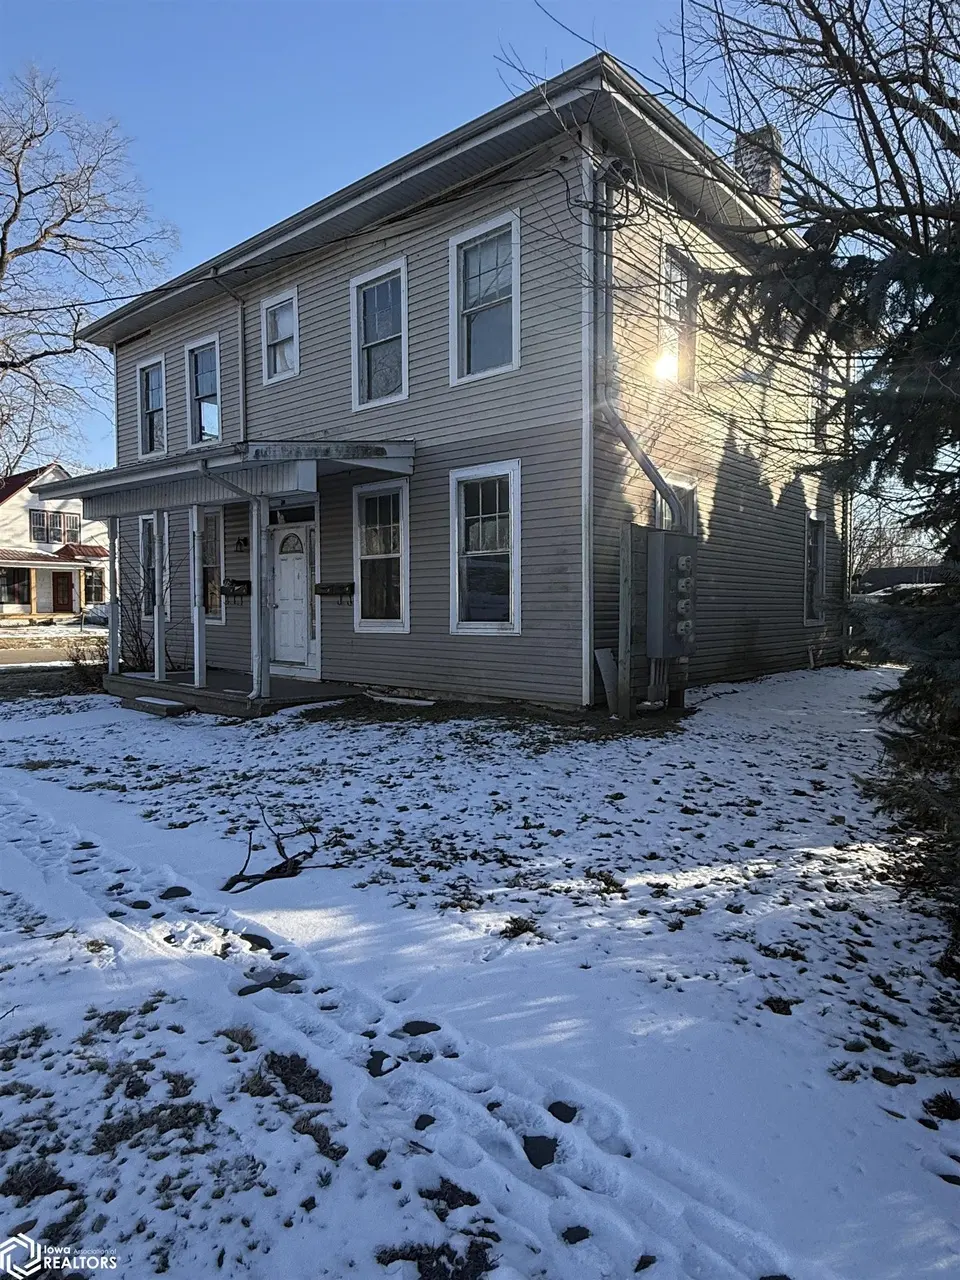
350 Van Buren St · Warsaw, IL
Flood risk 1/10 · Minimal
- FEMA flood zone
- X (unshaded)
- Chance of flooding over 30 yrs
- 0.0%
- Est. flood insurance / yr
- $473 – $860
Fire risk 3/10 · Minor
- Est. fire insurance / yr
- $804 – $1,492
Heat risk 3/10 · Minor
- Hot days now (above 107°F)
- 7 days/yr
- Hot days in 30 yrs
- 16 days/yr
Wind risk 2/10 · Minimal
- Chance of severe wind over 30 yrs
- —
Air-quality risk 2/10 · Minimal
- Unhealthy air days now
- 0 days/yr
- Unhealthy air days in 30 yrs
- 1 days/yr
Risk factors via First Street. Map © Google.
Why this score? — see what drove the B+ grade
The composite is a weighted blend of 9 inputs, each scored 0–100. Each bar is that input's sub-score; the figure is the points it added to the 100-point composite (weight × sub-score).
- Cash flow +30.0/30.0
- 1% rule +10.0/10.0
- DSCR +10.0/10.0
- Appreciation +9.0/10.0
- ARV discount +7.5/15.0
- Livability +3.4/5.0
- Schools +2.9/10.0
- Rent growth +2.5/5.0
- Condition / age +1.0/5.0
$100,000
🖨 Deal sheet 📄 Offer letter ✓ Due diligence
Multi-family units
County records classify this as Multi-Family (2-4 Unit). Listing-text estimate: 4 units. confirmed
Listing remarks MLS
Fourplex offering a compelling opportunity for investors seeking value-add potential. This all–one-bedroom, one-bath property is vacant and ready for repositioning. Conveniently located directly across from a park, the setting supports long-term rental appeal. Units have historically rented at approximately $400 per month, providing a clear baseline for income planning. With all units currently unoccupied, buyers have a clean slate to implement updates, establish market rents, and optimize operations. Ideal for investors looking to renovate, stabilize, and build equity in a small multifamily asset.
Key facts
- Currently unoccupied
- Clean slate
- Across from a park
Tags
Neighborhood map
What this means for you Summary
Snapshot
- This is a 4 × 1-bed/1-bath units multifamily listed at $100k. Condition is rated poor.
Deal economics
- At list price, monthly cash flow is $2k ($22k/yr) — positive. Per door: $462/mo.
- The deal already cash-flows at list — no discount required.
- Meets the 1% rule at list price ($3k rent vs $100k).
- Recommended offer: $88k (12.0% below list) — sets the bar for market timing.
Location & tenants
- Location reads 68/100 on livability (#459 in IL) — a middle-class / working-renter tenant base. Strengths: crime A+, cost of living A+, housing A+; Watch: health & safety C-, schools D, employment D.
- Warsaw CUSD 316 (rural): math 25% / reading 35% proficiency, ranked #489 of 919 in IL (top 53%) — families likely to look elsewhere, expect single-tenant / working-renter base with shorter leases.
- Market conditions: 20 active listings in the ZIP.
Forward outlook
- In year one you build about $9k of equity ($691 loan paydown + $8k appreciation (8.0% local appreciation)).
- Hancock County population projected at -30% by 2050 — secular population decline; favor cash flow + early exit over multi-decade hold.
- At projected returns (8.0% appreciation + 3.0% rent growth), your $28k cash investment doubles in ~1 year — after that, you're playing with house money.
- By year 4, paydown + projected appreciation supports a ~$30k cash-out refi (75% LTV) — recoverable capital for the next deal without selling this one.
Negotiation context
- It's been on market 129 days — a 12% lower offer ($88k) is reasonable based on typical stale-listing flexibility.
Risks & watch-outs
- Watch-outs: built in 1890 — expect roof / HVAC / electrical / plumbing capex.
Questions for the listing agent
- It's been on market 129 days. Have you received any prior offers? Is the seller open to a 12% concession, seller financing, or rate buy-down credit?
- Can we see the unit-by-unit rent roll, current vacancy, and any below-market leases? What's the average tenancy length?
- What capital expenditures (roof, boiler, parking lot, exteriors) have been made in the last 5 years, and what's planned in the next 2?
- Have any recent inspections been done? Can we get a copy of the seller's disclosures and any deferred-maintenance estimates?
- Built in 1890 — when were the roof, HVAC, electrical panel, plumbing, and water heater last replaced?
- Why hasn't it sold? Are there any deal-killer items the seller is aware of (foundation, flood, title, zoning, code violations)?
- Is there a deadline driving the sale (1031 exchange, divorce, estate, relocation)? That informs how much negotiation room exists.
- Schools are D-rated, which usually means shorter tenancies and higher turnover. Who's the typical renter profile here, and what's been the actual vacancy rate?
- What's the average days-on-market for RENTAL listings here right now (not sales)? A rising rental-DOM trend means longer vacancies and softer asking-rent achievability than the comps imply.
- What's the recent tenant-quality profile in this submarket — average credit score on applications, eviction rate, late-payment / NSF rate, and stable-employment percentage? A property-management company in the area should have these aggregated.
- How much new apartment / multifamily construction is in the pipeline within 1–3 miles? Heavy new supply (>2% of stock underway) typically softens rents 12–24 months out; light construction supports rent growth.
Investment metrics
- 1% rule
- 3.21% ✓
- Cap rate
- 28.45%
- Cash-on-cash
- 79.13%
- DSCR
- 4.52
- GRM
- 2.6
CMA / ARV
No comps found within radius.
Projected returns pro-forma
7.99% appreciation · 3.0% rent growth · sell at horizon
- IRR
- 87.5%
- Equity multiple
- 6.67×
- Total profit
- $158,785
- Equity at exit
- $75,913
- IRR
- 83.6%
- Equity multiple
- 14.34×
- Total profit
- $373,421
- Equity at exit
- $150,628
Cash invested: $28,000 (down + closing). Projections, not guarantees.
Landlord ↔ Tenant lean methodology
- Overall (STATE)
- 43 Moderately Tenant-Leaning
- State Illinois
- 43 Moderately Tenant-Leaning · D+7
- County
- — inherits STATE
- City
- — inherits STATE
ZIP-level market 62379
- Home prices YoY
- 5.6%
- Active inventory
- 20
- Price-to-rent
- 10.4×
Monthly cashflow live
- Estimated rent
- $3,212 medium interval (Pro) →
- Mortgage (P&I)
- −$524
- Tax est. 1.5%
- −$125 /mo · $1,500/yr
- Insurance
- −$42
- HOA
- −$0
- Vacancy / Maint / Mgmt
- −$675
- Net cashflow
- $1,846
Break-even live
4-unit breakdown (identical units grouped — click to expand)
| Units | Beds | Baths | Est. rent |
|---|---|---|---|
| 4× units | 1 | 1 | $3,212 |
| #1 | 1 | 1 | $803 |
| #2 | 1 | 1 | $803 |
| #3 | 1 | 1 | $803 |
| #4 | 1 | 1 | $803 |
| Total (4 units) | $3,212 | ||
UW: 25.0% down · 7.5% · 30yr · 1.5% tax · 5.0% vac · 8.0% maint · 8.0% mgmt
Financing live
Cash to close
- Down payment
- $25,000
- Closing costs
- $3,000
- Reserves months
- —
- Total cash needed
- —
Loan-product check · same deal, 3 products live
Conventional
25% down · 7.5% · 30yr
- Down + closing
- —
- Monthly P&I
- —
- Monthly cashflow
- —
- DSCR
- —
- Eligible?
- —
Personal DTI + credit; lowest rate.
DSCR
20% down · 8.5% · 30yr
- Down + closing
- —
- Monthly P&I
- —
- Monthly cashflow
- —
- DSCR
- —
- Eligible?
- —
No personal income docs; deal must DSCR.
Hard money
10% down · 12.0% · 12mo
- Down + closing
- —
- Monthly P&I
- —
- Monthly cashflow
- —
- DSCR
- —
- Eligible?
- —
Short-term bridge; refi at stabilization.
Listing history 15 events
-
2026-06-18days on market $100,000 Active 129 DOM
-
2026-06-17days on market $100,000 Active 128 DOM
-
2026-06-16days on market $100,000 Active 127 DOM
-
2026-06-15days on market $100,000 Active 126 DOM
-
2026-06-13days on market $100,000 Active 124 DOM
-
2026-06-12days on market $100,000 Active 123 DOM
-
2026-06-09days on market $100,000 Active 120 DOM
-
2026-06-08days on market $100,000 Active 119 DOM
-
2026-06-07days on market $100,000 Active 118 DOM
-
2026-06-04days on market $100,000 Active 114 DOM
-
2026-06-02days on market $100,000 Active 113 DOM
-
2026-06-01days on market $100,000 Active 112 DOM
-
2026-05-31days on market $100,000 Active 111 DOM
-
2026-05-31days on market $100,000 Active 110 DOM
-
2026-02-10$100,000 Active 611-char remark
Show marketing remark (611 chars)
Fourplex offering a compelling opportunity for investors seeking value-add potential. This all–one-bedroom, one-bath property is vacant and ready for repositioning. Conveniently located directly across from a park, the setting supports long-term rental appeal. Units have historically rented at approximately $400 per month, providing a clear baseline for income planning. With all units currently unoccupied, buyers have a clean slate to implement updates, establish market rents, and optimize operations. Ideal for investors looking to renovate, stabilize, and build equity in a small multifamily asset.
ⓘ Source: listings_history table (triggers on properties + properties_extension) + one-shot
backfill from property_details.listing_events for pre-trigger history.
Climate risk First Street
- Flood 1/10 Low FEMA zone X (unshaded) · 0% chance over 30 yrs
- Wildfire 3/10 Moderate
- Heat 3/10 Moderate 7 d/yr ≥107°F today · 16 d/yr by 30 yrs out
- Wind 2/10 Low
- Air quality 2/10 Low 0 unhealthy d/yr today · 1 by 30 yrs out
Nearby sold comps map
Loading sold comps map…
Walkable amenities ~0.75 mi
Loading nearby amenities…
Taxation est. · year 1
- Rental income
- $38,544
- − Mortgage interest
- −$5,602
- − Property taxes
- −$1,500
- − Insurance
- −$500
- − Repairs & maintenance
- −$3,084
- − Management
- −$3,084
- − Depreciation
- −$2,909
- Taxable income
- $21,866
- Est. tax owed @ 24.0%
- −$5,248
- After-tax cash flow
- $16,909/yr
For passive investors: Depreciation is non-cash, so a rental often shows a tax loss while cash-flowing — sheltering income. Rental losses are passive: they offset passive income freely, and up to $25,000/yr can offset ordinary (W-2) income if you actively participate and your MAGI is under $100k (phasing out to $0 by $150k); unused losses carry forward. On sale, claimed depreciation is recaptured at up to 25%, and gains may owe capital-gains tax (a 1031 exchange can defer both). Figures are a year-1 estimate at your 24.0% rate — not tax advice; consult a CPA.
Condition & rehab AI · 12 photos
This fourplex requires extensive repairs and updates to bring it up to a livable condition. Immediate focus should be on the kitchen and bathroom flooring, painting, and window replacements to improve both resale and rental value.
Repairs flagged
- Major Kitchen flooring — Severe damage and unevenness
- Major Bathroom flooring — Severe damage and unevenness
- Major Exterior siding — General disrepair
- Major Interior walls/paint — Peeling paint and general disrepair
- Major Windows — Exposed windows and general disrepair
Value-add opportunities
- Both New flooring in kitchen and bathrooms — Improves both resale and rental value
- Both Painting interior walls and repainting exterior siding — Enhances curb appeal and interior aesthetics
- Both New windows — Improves natural light and energy efficiency
- Both HVAC system upgrade — Enhances comfort and energy efficiency
- Both Landscaping and curb appeal improvements — Enhances curb appeal and property value
Renovation cost estimate screening
| Repair item | Severity | Est. cost |
|---|---|---|
| Kitchen flooring · Severe damage and unevenness | Major | $15,000–50,000 |
| Bathroom flooring · Severe damage and unevenness | Major | $15,000–50,000 |
| Exterior siding · General disrepair | Major | $15,000–50,000 |
| Interior walls/paint · Peeling paint and general disrepair | Major | $15,000–50,000 |
| Windows · Exposed windows and general disrepair | Major | $15,000–50,000 |
| Total estimated repair cost · 5 items | $75,000–250,000 |
Value-add ROI direction
- Both New flooring in kitchen and bathrooms — Improves both resale and rental value ↑
- Both Painting interior walls and repainting exterior siding — Enhances curb appeal and interior aesthetics ↑
- Both New windows — Improves natural light and energy efficiency ↑
- Both HVAC system upgrade — Enhances comfort and energy efficiency ↑
- Both Landscaping and curb appeal improvements — Enhances curb appeal and property value ↑
ⓘ Cost ranges are severity-bucket heuristics (US national rule-of-thumb). Get contractor quotes + a written scope before underwriting a rehab budget.
Schools (NCES district)
- District
- Warsaw CUSD 316
- NCES district ID
- 1740890
- Math proficiency
- 25% ▲ 5.00%
- Reading proficiency
- 35% ▬ 0.00%
- Median HH income
- $48,724
- Composite
- 28.9/100
- National rank
- #11950
- State rank
- #489 of 919 in IL
Livability — Warsaw
- Score
- 68/100
- State rank
- #459
- US rank
- #9523
Category grades
Schools grade is shown separately in the Schools card above.
Census & demographics
- Census place
- Warsaw, IL
- Population (ZIP)
- 1,828
Population outlook (Hancock County) Hauer SSP2
- Today (2025)
- 17,042 people
- By 2030
- 16,056 · -5.8%
- By 2040
- 13,912 · -18.4%
- By 2050
- 11,879 · -30.3%
- By 2075
- 8,302 · -51.3%
- By 2100
- 5,846 · -65.7%
Race, ethnicity, and origin ACS 2023
- Neighborhood character
- Predominantly White (97%)
- Race & ethnicity
- White 97% Two or more races 2%
- Common ancestry
- Slovak 5% Lithuanian 2% Iranian 1%
- Foreign-born
- 1%
- Languages at home
- 98% English-only · Other Indo-European 2%
Political lean MEDSL · Hancock
- 2024 margin
- Solid R (+50.0) · D 24.1% · R 74.1% · Other 1.8%
- 2008→2024 swing
- -39.2pp toward R · 2008: -10.8pp · 2024: -50.0pp
- All cycles
- 2024: R+50.0 2020: R+48.9 2016: R+50.8 2012: R+19.0 2008: R+10.8
Not yet ingested
- Civics
- —
Market trends
- HPI YoY
- ▲ 7.99%
- Current HPI
- 150.9375
- Rent YoY
- —
- Metro
- —
- State GDP YoY
- ▲ 1.59%
- F500 in state
- 60
Industry mix (Fortune 500 HQ in IL)
| Industry | F500 HQs | Revenue |
|---|---|---|
| Insurance | 4 | $201B |
|
||
| Consumer Goods | 4 | $87B |
|
||
| Industrial Machinery | 3 | $64B |
|
||
| Healthcare | 2 | $55B |
|
||
| Retail / Pharmacy | 1 | $148B |
|
||
| Agriculture / Food | 1 | $86B |
|
||
Price history
1 event — show timeline
- 2026-02-10 Listed $100,000 IAR
Cash-flow waterfall
monthlySold comps — $/sqft
last 12 mo · ≤1 miLoading sold comps…