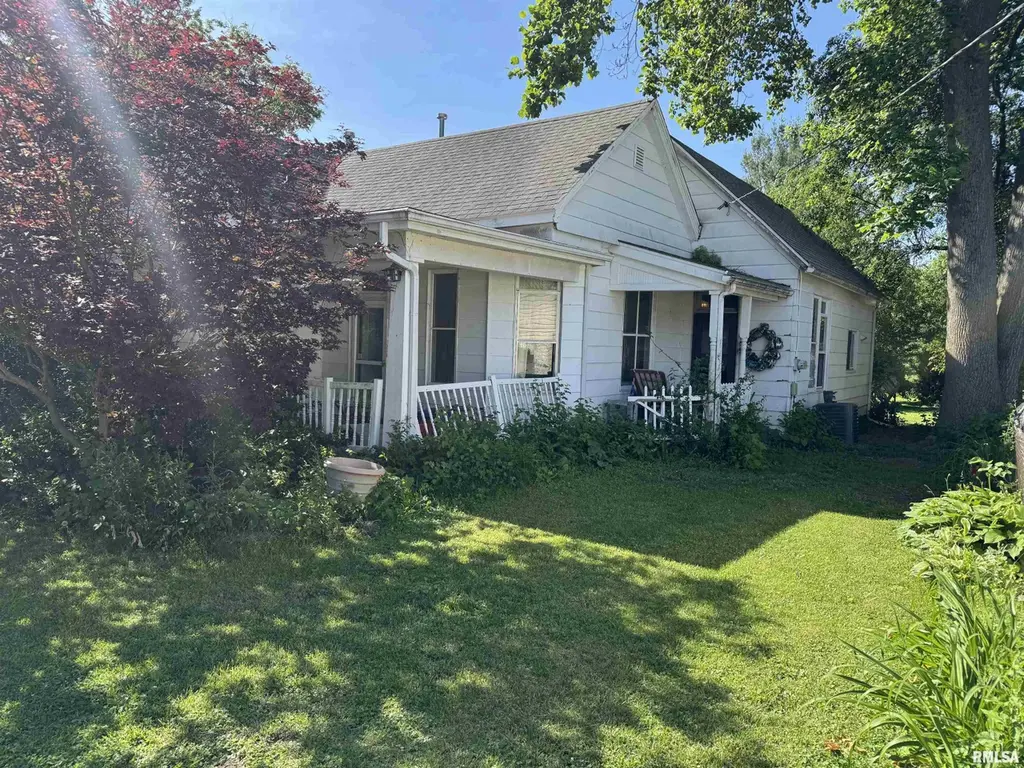
810 E Franklin St · Taylorville, IL
Flood risk 1/10 · Minimal
- FEMA flood zone
- X (unshaded)
- Chance of flooding over 30 yrs
- 0.0%
- Est. flood insurance / yr
- $473 – $860
Fire risk 2/10 · Minimal
- Est. fire insurance / yr
- $804 – $1,492
Heat risk 4/10 · Minor
- Hot days now (above 105°F)
- 7 days/yr
- Hot days in 30 yrs
- 20 days/yr
Wind risk 2/10 · Minimal
- Chance of severe wind over 30 yrs
- 2.0%
Air-quality risk 2/10 · Minimal
- Unhealthy air days now
- 1 days/yr
- Unhealthy air days in 30 yrs
- 1 days/yr
Risk factors via First Street. Map © Google.
Why this score? — see what drove the B- grade
The composite is a weighted blend of 9 inputs, each scored 0–100. Each bar is that input's sub-score; the figure is the points it added to the 100-point composite (weight × sub-score).
- Cash flow +30.0/30.0
- 1% rule +10.0/10.0
- DSCR +10.0/10.0
- ARV discount +7.5/15.0
- Livability +3.4/5.0
- Rent growth +2.5/5.0
- Condition / age +2.5/5.0
- Schools +2.0/10.0
- Appreciation +0.0/10.0
$50,000
🖨 Deal sheet 📄 Offer letter ✓ Due diligence
Listing remarks MLS
2 bedroom home on large lot with 2 car detached garage. Home needs repairs. Sold "As Is". Pre-approval letter or documentation of cash funds MUST accompany ALL offers. Sq Ft believed accurate but not warranted.
Key facts
- 0.35 acre lot
- 2 garage spots
- Built 1930
Property features AI
Finance
- Other: Lot dimensions approximately 106' x 142'
- Financial info: No financial details provided
- HOA & community: No HOA information provided
Exterior
- Parking: Detached carport; 2-car garage
- Security: No specific security features provided
- Utilities: Public water; Public sewer
- Home design: Single family residence; Built in 1930; Shingle roof
- Construction: Partial basement
- Exterior features: Level lot; Paved road access
Interior
- Kitchen: Kitchen on main level; Refrigerator included
- Bedrooms: 2 bedrooms (both on the main level; each approximately 10' x 10')
- Flooring: Carpet in bedrooms; Hardwood in living and dining rooms; Vinyl in kitchen
- Bathrooms: 2 full bathrooms
- Heating & cooling: Forced air heating; Central air conditioning
- Interior features: Partial basement; One fireplace; Refrigerator included; Other kitchen appliance(s) included
- Laundry & utility: No specific laundry details provided
Neighborhood map
What this means for you Summary
Snapshot
- This is a 2-bed/2.0-bath single-family listed at $50k.
Deal economics
- At list price, monthly cash flow is $304 ($4k/yr) — positive.
- The deal already cash-flows at list — no discount required.
- Meets the 1% rule at list price ($820 rent vs $50k).
- Cap rate 13.6% vs local median 4.1% in Taylorville — top-decile yield for the area; either an underpriced asset or a hidden risk that comps aren't pricing in. Stress-test before assuming the spread holds.
Location & tenants
- Location reads 68/100 on livability (#478 in IL) — a middle-class / working-renter tenant base. Strengths: cost of living A+, housing A+, crime B+; Watch: employment D, amenities F, commute F.
- Taylorville CUSD 3 (town): math 14% / reading 31% proficiency, ranked #383 of 620 in IL (top 62%) — low school quality limits family demand, transient renter base, plan for 1-2y turnover.
- Zoned schools: Taylorville Sr High School (math 12% / reading 17%, grade F, #479 of 693 statewide, top 71%, 781 students, 0% FRL) — zoned schools average 0% FRL vs 46% district-wide (46 pts lower); this property's tenant base skews higher-income than the district average.
- Market conditions: 85 active listings in the ZIP; 1 comparable units currently listed for rent nearby; 26 units permitted in Christian County in 2024 (0 in 5+ unit buildings).
Forward outlook
- Local home prices are declining (-3.0%/yr); year-one equity from $346 of loan paydown is wiped out by about $2k of value loss. Plan a longer hold.
- Christian County population projected at -24% by 2050 — secular population decline; favor cash flow + early exit over multi-decade hold.
- At projected returns (-3.0% appreciation + 3.0% rent growth), your $14k cash investment doubles in ~5 years — after that, you're playing with house money.
Negotiation context
- Only 14 days on market — expect competitive offers; lowballing is unlikely to land.
- 2 sale attempts since 18y ago with the ask held roughly flat each time — persistent listings suggest the price (not the market) is what's stuck; bring a comps-based counter.
- Current owner paid $25k; list at $50k implies a 101% gain — meaningful room to come down on a strong offer.
Risks & watch-outs
- Watch-outs: built in 1930 — expect roof / HVAC / electrical / plumbing capex.
Questions for the listing agent
- Built in 1930 — when were the roof, HVAC, electrical panel, plumbing, and water heater last replaced?
- Is there a deadline driving the sale (1031 exchange, divorce, estate, relocation)? That informs how much negotiation room exists.
- Schools are F-rated, which usually means shorter tenancies and higher turnover. Who's the typical renter profile here, and what's been the actual vacancy rate?
- What's the average days-on-market for RENTAL listings here right now (not sales)? A rising rental-DOM trend means longer vacancies and softer asking-rent achievability than the comps imply.
- What's the recent tenant-quality profile in this submarket — average credit score on applications, eviction rate, late-payment / NSF rate, and stable-employment percentage? A property-management company in the area should have these aggregated.
- How much new for-sale + rental construction is in the pipeline within 1–3 miles? Heavy new supply typically softens prices + rents 12–24 months out; constrained supply supports both.
Investment metrics
- 1% rule
- 1.64% ✓
- Cap rate
- 13.58%
- Cash-on-cash
- 26.04%
- DSCR
- 2.16
- GRM
- 5.1
CMA / ARV
- ARV (on-the-fly)
- $135,408
- Comps found
- 12
Show comp detail 12 sales within ~0.75 mi
| Address | Dist | Beds/Ba | Sqft | Sold | Price | $/sf | Match |
|---|---|---|---|---|---|---|---|
| 1013 E Franklin St | 0.15mi | 3/2.0 (+1) | 1,560 (+7%) | 4mo | $160,000 | $103 | 73 |
| 907 E Park St | 0.37mi | 3/1.0 (+1) | 1,468 (+1%) | 1mo | $58,800 | $40 | 72 |
| 203 W Poplar St | 0.62mi | 2/1.0 | 1,400 (-4%) | 3mo | $115,500 | $83 | 58 |
| 810 N Snodgrass St | 0.69mi | 3/2.0 (+1) | 1,468 (+1%) | 6mo | $139,900 | $95 | 56 |
| 807 E Oak St | 0.49mi | 2/1.0 | 1,368 (-6%) | 8mo | $80,000 | $58 | 56 |
| 311 W Adams St | 0.64mi | 3/1.0 (+1) | 1,421 (-2%) | 2mo | $120,000 | $84 | 56 |
| 609 S Cherokee St | 0.31mi | 3/1.0 (+1) | 1,630 (+12%) | 2mo | $164,500 | $101 | 55 |
| 1029 E Franklin St | 0.19mi | 3/2.0 (+1) | 1,248 (-14%) | 11mo | $70,000 | $56 | 53 |
| 1120 E Park St | 0.39mi | 3/1.0 (+1) | 1,274 (-12%) | 2mo | $99,500 | $78 | 51 |
| 322 N Clay St | 0.74mi | 3/2.0 (+1) | 1,337 (-8%) | 0mo | $154,000 | $115 | 47 |
| 901 E Oak St | 0.49mi | 3/2.0 (+1) | 1,300 (-11%) | 11mo | $154,900 | $119 | 44 |
| 413 E Esther St | 0.67mi | 3/1.5 (+1) | 1,605 (+10%) | 1mo | $149,900 | $93 | 44 |
Match score weights: distance 35% · size 25% · config 20% · recency 20%. Top-matched comps best support the ARV.
Projected returns pro-forma
-3.0% appreciation · 3.0% rent growth · sell at horizon
- IRR
- 19.8%
- Equity multiple
- 1.80×
- Total profit
- $11,261
- Equity at exit
- $7,455
- IRR
- 28.0%
- Equity multiple
- 3.48×
- Total profit
- $34,770
- Equity at exit
- $4,323
Cash invested: $14,000 (down + closing). Projections, not guarantees.
Landlord ↔ Tenant lean methodology
- Overall (STATE)
- 43 Moderately Tenant-Leaning
- State Illinois
- 43 Moderately Tenant-Leaning · D+7
- County
- — inherits STATE
- City
- — inherits STATE
ZIP-level market 62568
- Active inventory
- 85
- Price-to-rent
- 5.1×
Monthly cashflow live
- Estimated rent
- $820 medium interval (Pro) →
- Mortgage (P&I)
- −$262
- Tax from tax record
- −$61 /mo · $731/yr
- Insurance
- −$21
- HOA
- −$0
- Vacancy / Maint / Mgmt
- −$172
- Net cashflow
- $304
Break-even live
UW: 25.0% down · 7.5% · 30yr · 1.5% tax · 5.0% vac · 8.0% maint · 8.0% mgmt
Financing live
Cash to close
- Down payment
- $12,500
- Closing costs
- $1,500
- Reserves months
- —
- Total cash needed
- —
Loan-product check · same deal, 3 products live
Conventional
25% down · 7.5% · 30yr
- Down + closing
- —
- Monthly P&I
- —
- Monthly cashflow
- —
- DSCR
- —
- Eligible?
- —
Personal DTI + credit; lowest rate.
DSCR
20% down · 8.5% · 30yr
- Down + closing
- —
- Monthly P&I
- —
- Monthly cashflow
- —
- DSCR
- —
- Eligible?
- —
No personal income docs; deal must DSCR.
Hard money
10% down · 12.0% · 12mo
- Down + closing
- —
- Monthly P&I
- —
- Monthly cashflow
- —
- DSCR
- —
- Eligible?
- —
Short-term bridge; refi at stabilization.
Rent comps 1 comps
| Address | Beds | Baths | Sqft | Rent | $/sqft | DOM | Units | Dist |
|---|---|---|---|---|---|---|---|---|
| 913 N Taylorville Blvd Taylorville, IL | 2.0 | 2.0 | 896 | $820 | $0.92 | 21d | 1 | 1.48mi |
Listing history 11 events
-
2026-06-18days on market $50,000 Under Contract 14 DOM
-
2026-06-17days on market $50,000 Under Contract 13 DOM
-
2026-06-16days on market $50,000 Under Contract 12 DOM
-
2026-06-15days on market $50,000 Under Contract 11 DOM
-
2026-06-13days on market $50,000 Under Contract 9 DOM
-
2026-06-12statusdays on market $50,000 Under Contract 8 DOM
-
2026-06-09days on market $50,000 Active 5 DOM
-
2026-06-08days on market $50,000 Active 4 DOM
-
2026-06-07days on market $50,000 Active 3 DOM
-
2026-06-07remarks 278-char remark
-
2026-06-07$50,000 Active 2 DOM
ⓘ Source: listings_history table (triggers on properties + properties_extension) + one-shot
backfill from property_details.listing_events for pre-trigger history.
Tax reassessment forecast IL · Partial reset (capped growth)
- Current annual tax
- $731 · $61/mo
- Projected year-2 tax
- $933 · $78/mo
- Expected delta
- +$202/yr (+$17/mo · 27.6%)
ⓘ Screening estimate from a state-policy table — verify with the county assessor before closing.
Climate risk First Street
- Flood 1/10 Low FEMA zone X (unshaded) · 0% chance over 30 yrs
- Wildfire 2/10 Low
- Heat 4/10 Moderate 7 d/yr ≥105°F today · 20 d/yr by 30 yrs out
- Wind 2/10 Low 2% chance of damaging wind over 30 yrs
- Air quality 2/10 Low 1 unhealthy d/yr today · 1 by 30 yrs out
Nearby sold comps map
Loading sold comps map…
Walkable amenities ~0.75 mi
Loading nearby amenities…
Taxation est. · year 1
- Rental income
- $9,840
- − Mortgage interest
- −$2,801
- − Property taxes
- −$731
- − Insurance
- −$250
- − Repairs & maintenance
- −$787
- − Management
- −$787
- − Depreciation
- −$1,455
- Taxable income
- $3,029
- Est. tax owed @ 24.0%
- −$727
- After-tax cash flow
- $2,919/yr
For passive investors: Depreciation is non-cash, so a rental often shows a tax loss while cash-flowing — sheltering income. Rental losses are passive: they offset passive income freely, and up to $25,000/yr can offset ordinary (W-2) income if you actively participate and your MAGI is under $100k (phasing out to $0 by $150k); unused losses carry forward. On sale, claimed depreciation is recaptured at up to 25%, and gains may owe capital-gains tax (a 1031 exchange can defer both). Figures are a year-1 estimate at your 24.0% rate — not tax advice; consult a CPA.
Schools (NCES district)
- District
- Taylorville CUSD 3
- NCES district ID
- 1738700
- Math proficiency
- 14% ▼ -17.00%
- Reading proficiency
- 31% ▼ -10.00%
- Median HH income
- $45,940
- Composite
- 19.53/100
- National rank
- #8764
- State rank
- #383 of 620 in IL
Livability — Taylorville
- Score
- 68/100
- State rank
- #478
- US rank
- #9895
Category grades
Schools grade is shown separately in the Schools card above.
Census & demographics
- Census place
- Taylorville, IL
- City population
- 16,035
- Population (ZIP)
- 16,035
Population outlook (Christian County) Hauer SSP2
- Today (2025)
- 31,182 people
- By 2030
- 29,787 · -4.5%
- By 2040
- 26,793 · -14.1%
- By 2050
- 23,757 · -23.8%
- By 2075
- 17,333 · -44.4%
- By 2100
- 11,573 · -62.9%
Race, ethnicity, and origin ACS 2023
- Neighborhood character
- Predominantly White (91%)
- Race & ethnicity
- White 91% Black 4% Two or more races 2% Hispanic / Latino 2% Asian 1%
- Common ancestry
- Lithuanian 2% Slovak 2% Romanian 1%
- Foreign-born
- 2% · Canada
- Languages at home
- 97% English-only · Spanish 2% Other Indo-European 1%
Political lean MEDSL · Christian
- 2024 margin
- Solid R (+46.7) · D 25.9% · R 72.6% · Other 1.5%
- 2008→2024 swing
- -40.4pp toward R · 2008: -6.3pp · 2024: -46.7pp
- All cycles
- 2024: R+46.7 2020: R+44.6 2016: R+42.7 2012: R+23.1 2008: R+6.3
Not yet ingested
- Civics
- —
Market trends
- HPI YoY
- ▼ -171.77%
- Current HPI
- 159.2588
- Rent YoY
- —
- Metro
- —
- State GDP YoY
- ▲ 1.59%
- F500 in state
- 60
Industry mix (Fortune 500 HQ in IL)
| Industry | F500 HQs | Revenue |
|---|---|---|
| Insurance | 4 | $201B |
|
||
| Consumer Goods | 4 | $87B |
|
||
| Industrial Machinery | 3 | $64B |
|
||
| Healthcare | 2 | $55B |
|
||
| Retail / Pharmacy | 1 | $148B |
|
||
| Agriculture / Food | 1 | $86B |
|
||
Price history
+53.8% since first listed5 events — show timeline
- 2026-06-04 Listed $50,000 RMLSA as Distributed by MLS Grid
- 2008-12-08 Sold (Public Records) $24,900 Public Records
- 2008-12-05 Sold (MLS) $24,900 RMLSA as Distributed by MLS Grid
- 2008-10-15 Listed $24,900 RMLSA as Distributed by MLS Grid
- 1999-06-01 Sold (Public Records) $32,500 Public Records
Property tax history
+0.3%/yrLatest (2024): $731 · +72.9% YoY. Source: county tax records.
Cash-flow waterfall
monthlySold comps — $/sqft
last 12 mo · ≤1 miLoading sold comps…