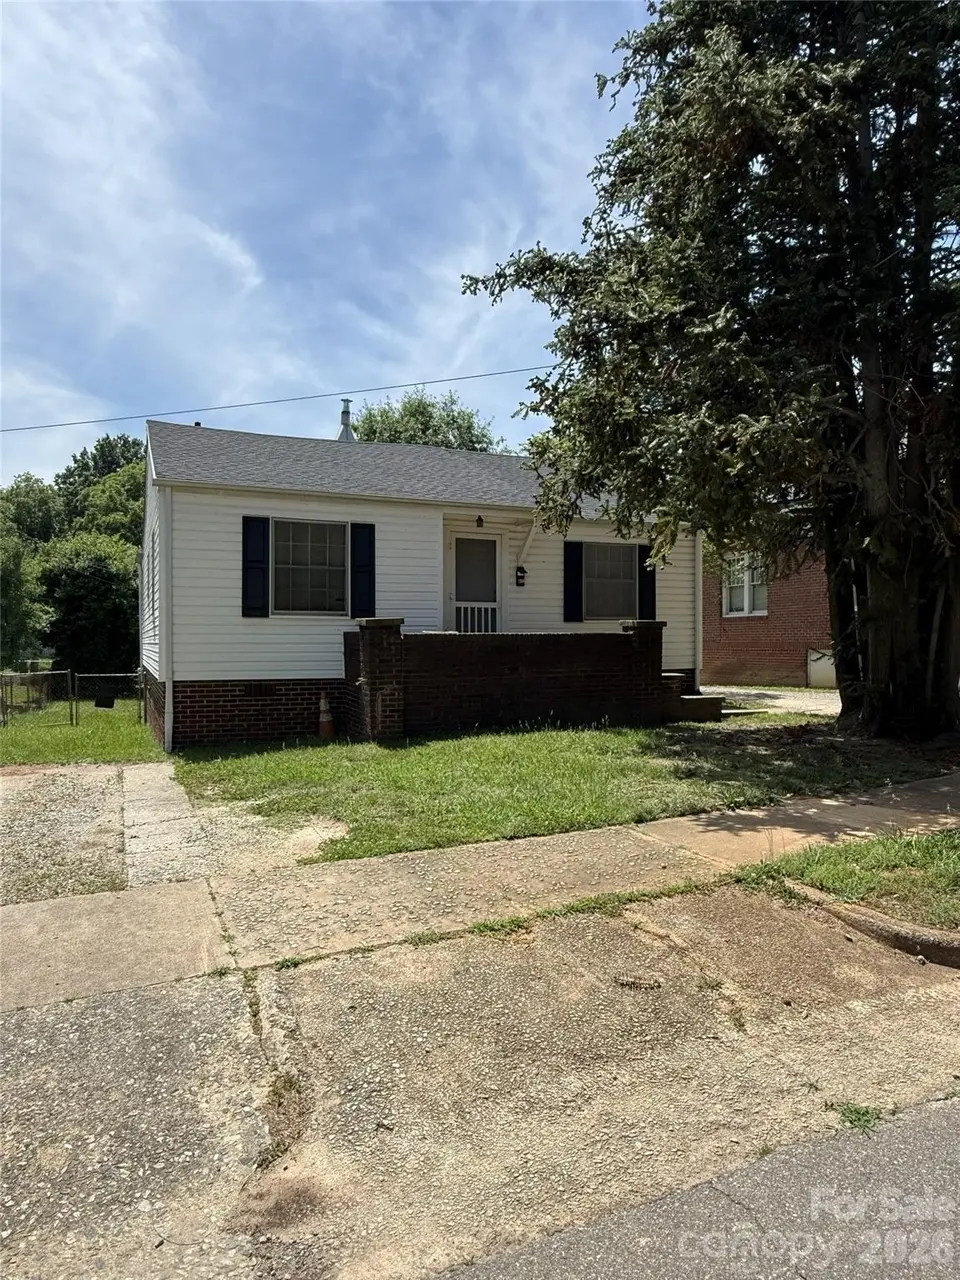
312 S Race St · Statesville, NC
Flood risk 1/10 · Minimal
- FEMA flood zone
- X (unshaded)
- Chance of flooding over 30 yrs
- 0.0%
- Est. flood insurance / yr
- $507 – $1,088
Fire risk 1/10 · Minimal
- Est. fire insurance / yr
- $906 – $1,684
Heat risk 5/10 · Moderate
- Hot days now (above 103°F)
- 7 days/yr
- Hot days in 30 yrs
- 17 days/yr
Wind risk 3/10 · Minor
- Chance of severe wind over 30 yrs
- 5.0%
Air-quality risk 3/10 · Minor
- Unhealthy air days now
- 2 days/yr
- Unhealthy air days in 30 yrs
- 3 days/yr
Risk factors via First Street. Map © Google.
Why this score? — see what drove the C+ grade
The composite is a weighted blend of 9 inputs, each scored 0–100. Each bar is that input's sub-score; the figure is the points it added to the 100-point composite (weight × sub-score).
- Cash flow +24.1/30.0
- ARV discount +15.0/15.0
- DSCR +7.8/10.0
- 1% rule +5.2/10.0
- Schools +4.5/10.0
- Livability +3.0/5.0
- Rent growth +2.6/5.0
- Condition / age +2.5/5.0
- Appreciation +0.0/10.0
$130,000
🖨 Deal sheet 📄 Offer letter ✓ Due diligence
Listing remarks
Great investment home for rental property or fix and flip! 2 bedroom 1 bath with hardwood floors throughout. Kitchen, dining room and living room with a fireplace in a walkable downtown location. Large flat backyard is great!
Key facts
- 6,534 sq ft lot
- Built 1948
- Listed 14 days
Property features AI
Finance
- HOA & community: Not subject to HOA dues
Exterior
- Parking: Driveway
- Utilities: City water; Public sewer; Cable available
- Home design: Single family residence; Residential property; One level
- Construction: Site-built construction; Vinyl exterior; Basement present (dirt floor, exterior and interior entry, unfinished)
- Exterior features: Front porch; Level lot; Road surface: dirt and paved; Publicly maintained road
Interior
- Kitchen: Refrigerator included
- Bedrooms: 2 bedrooms on the main level
- Flooring: Wood flooring
- Bathrooms: 1 full bathroom on the main level
- Heating & cooling: Forced air heating; Natural gas heating; No cooling system listed
- Interior features: 5 total rooms; Living room fireplace
- Laundry & utility: No laundry room features listed
Neighborhood map
What this means for you Summary
Snapshot
- This is a 2-bed/1.0-bath single-family listed at $130k.
Deal economics
- At list price, monthly cash flow is $258 ($3k/yr) — positive.
- The deal already cash-flows at list — no discount required.
- Meets the 1% rule at list price ($1k rent vs $130k).
- Recommended offer: $128k (1.5% below list) — sets the bar for market timing.
- Cap rate 8.7% vs local median 3.5% in Statesville — top-decile yield for the area; either an underpriced asset or a hidden risk that comps aren't pricing in. Stress-test before assuming the spread holds.
Location & tenants
- Location reads 59/100 on livability (#557 in NC) — a working-class tenant base; expect higher turnover. Strengths: cost of living A+, housing A+; Watch: crime D, amenities F, commute F.
- Iredell-Statesville Schools (rural): math 53% / reading 52% proficiency, ranked #51 of 178 in NC (top 29%) — acceptable for families but not a draw, mixed tenant base, ~2y average lease.
- Zoned schools: Statesville High (math 17% / reading 27%, grade F, #484 of 535 statewide, top 91%, 879 students, 77% FRL) — zoned schools average 77% FRL vs 38% district-wide (39 pts higher); higher-poverty schools than district average — tighter screening recommended.
- Zoned-school proficiency averages 22% at this address vs 52% district-wide (-30 pts) — the specific schools serving this property underperform the Iredell-Statesville Schools average; the district grade overstates school quality for this exact location.
- Market conditions: Rents flat; 471 active listings in the ZIP; 20 comparable units currently listed for rent nearby; rentals at typical pace (median 24d on market — plan ~3-4 weeks tenant-placement turnaround); 1,955 units permitted in Iredell County in 2024 (128 in 5+ unit buildings).
Forward outlook
- Local home prices are declining (-3.0%/yr); year-one equity from $899 of loan paydown is wiped out by about $4k of value loss. Plan a longer hold.
- Iredell County population projected at +26% by 2050 — long-run rental-demand tailwind backs the buy-and-hold thesis.
Negotiation context
- It's been on market 15 days — a 2% lower offer ($128k) is reasonable based on typical stale-listing flexibility.
- Current owner paid $30k; list at $130k implies a 333% gain — meaningful room to come down on a strong offer.
Risks & watch-outs
- Watch-outs: built in 1948 — expect roof / HVAC / electrical / plumbing capex.
- Climate carrying-cost: extreme-heat days projected 7→17/yr by 2055 (HVAC capex compounding) — expect insurance premiums to compound above CPI over the hold.
Questions for the listing agent
- Built in 1948 — when were the roof, HVAC, electrical panel, plumbing, and water heater last replaced?
- Is there a deadline driving the sale (1031 exchange, divorce, estate, relocation)? That informs how much negotiation room exists.
- Schools are D-rated, which usually means shorter tenancies and higher turnover. Who's the typical renter profile here, and what's been the actual vacancy rate?
- Crime grade is D in this area — have there been break-ins, vandalism, or insurance claims at this property in the last 3 years? What carrier currently insures it and at what premium?
- What's the average days-on-market for RENTAL listings here right now (not sales)? A rising rental-DOM trend means longer vacancies and softer asking-rent achievability than the comps imply.
- What's the recent tenant-quality profile in this submarket — average credit score on applications, eviction rate, late-payment / NSF rate, and stable-employment percentage? A property-management company in the area should have these aggregated.
- How much new for-sale + rental construction is in the pipeline within 1–3 miles? Heavy new supply typically softens prices + rents 12–24 months out; constrained supply supports both.
Investment metrics
- 1% rule
- 1.02% ✓
- Cap rate
- 8.67%
- Cash-on-cash
- 8.50%
- DSCR
- 1.38
- GRM
- 8.2
CMA / ARV
- ARV (on-the-fly)
- $212,042
- Comps found
- 12
Show comp detail 12 sales within ~0.75 mi
| Address | Dist | Beds/Ba | Sqft | Sold | Price | $/sf | Match |
|---|---|---|---|---|---|---|---|
| 103 Buena Vista Ave | 0.39mi | 3/1.0 (+1) | 1,092 (-0%) | 2mo | $75,000 | $69 | 75 |
| 116 S Patterson St #8 | 0.32mi | 2/1.0 | 1,206 (+10%) | 0mo | $178,500 | $148 | 67 |
| 620 W Bell St | 0.16mi | 3/2.0 (+1) | 1,209 (+11%) | 6mo | $238,000 | $197 | 60 |
| 626 W Bell St | 0.17mi | 3/2.0 (+1) | 1,209 (+11%) | 7mo | $238,000 | $197 | 60 |
| 926 Winston Ave | 0.54mi | 3/2.0 (+1) | 1,118 (+2%) | 6mo | $219,500 | $196 | 57 |
| 933 Wallace St | 0.52mi | 2/1.0 | 1,216 (+11%) | 2mo | $85,000 | $70 | 55 |
| 252 N Patterson St | 0.51mi | 3/2.0 (+1) | 1,156 (+6%) | 4mo | $212,000 | $183 | 54 |
| 816 Alexander St | 0.53mi | 3/1.5 (+1) | 950 (-13%) | 8mo | $170,000 | $179 | 40 |
| 264 N Lackey St | 0.57mi | 3/2.5 (+1) | 1,234 (+13%) | 2mo | $235,000 | $190 | 39 |
| 266 N Lackey St | 0.58mi | 3/2.5 (+1) | 1,234 (+13%) | 6mo | $240,000 | $194 | 36 |
| 270 N Lackey St | 0.58mi | 3/2.5 (+1) | 1,234 (+13%) | 6mo | $242,000 | $196 | 36 |
| 405 Winston Ave | 0.68mi | 3/2.5 (+1) | 1,234 (+13%) | 4mo | $240,000 | $194 | 32 |
Match score weights: distance 35% · size 25% · config 20% · recency 20%. Top-matched comps best support the ARV.
Projected returns pro-forma
-3.0% appreciation · 0.2% rent growth · sell at horizon
- IRR
- -6.3%
- Equity multiple
- 0.77×
- Total profit
- $-8,337
- Equity at exit
- $19,383
- IRR
- -0.2%
- Equity multiple
- 0.99×
- Total profit
- $-432
- Equity at exit
- $11,240
Cash invested: $36,400 (down + closing). Projections, not guarantees.
Landlord ↔ Tenant lean methodology
- Overall (STATE)
- 85 Strongly Landlord-Friendly
- State North Carolina
- 85 Strongly Landlord-Friendly · R+3
- County
- — inherits STATE
- City
- — inherits STATE
ZIP-level market 28677
- Rents YoY
- 0.2%
- Active inventory
- 471
- Price-to-rent
- 8.2×
Monthly cashflow live
- Estimated rent
- $1,328 high interval (Pro) →
- Mortgage (P&I)
- −$682
- Tax from tax record
- −$56 /mo · $668/yr
- Insurance
- −$54
- HOA
- −$0
- Vacancy / Maint / Mgmt
- −$279
- Net cashflow
- $258
Break-even live
UW: 25.0% down · 7.5% · 30yr · 1.5% tax · 5.0% vac · 8.0% maint · 8.0% mgmt
Financing live
Cash to close
- Down payment
- $32,500
- Closing costs
- $3,900
- Reserves months
- —
- Total cash needed
- —
Loan-product check · same deal, 3 products live
Conventional
25% down · 7.5% · 30yr
- Down + closing
- —
- Monthly P&I
- —
- Monthly cashflow
- —
- DSCR
- —
- Eligible?
- —
Personal DTI + credit; lowest rate.
DSCR
20% down · 8.5% · 30yr
- Down + closing
- —
- Monthly P&I
- —
- Monthly cashflow
- —
- DSCR
- —
- Eligible?
- —
No personal income docs; deal must DSCR.
Hard money
10% down · 12.0% · 12mo
- Down + closing
- —
- Monthly P&I
- —
- Monthly cashflow
- —
- DSCR
- —
- Eligible?
- —
Short-term bridge; refi at stabilization.
Rent comps 20 comps
| Address | Beds | Baths | Sqft | Rent | $/sqft | DOM | Units | Dist |
|---|---|---|---|---|---|---|---|---|
| 626 Walnut St Unit D Statesville, NC | 2.0 | 1.5 | 1090 | $1,100 | $1.01 | 23d | 1 | 0.13mi |
| 627 Cherry St Unit F Statesville, NC | 2.0 | 1.5 | 1098 | $1,200 | $1.09 | 23d | 1 | 0.17mi |
| 708 W Front St Statesville, NC | 2.0 | 1.0 | 950 | $985 | $1.04 | 2d | 1 | 0.17mi |
| 620 W Bell St Statesville, NC | 3.0 | 2.0 | 1209 | $1,850 | $1.53 | 21d | 1 | 0.18mi |
| 1151 Alexander St Unit 1151 Statesville, NC | 2.0 | 1.0 | 900 | $1,200 | $1.33 | 23d | 1 | 0.70mi |
| 544 N Center St Unit A Statesville, NC | 2.0 | 2.0 | 1040 | $1,195 | $1.15 | 23d | 1 | 0.94mi |
| 334 Brevard St Unit F Statesville, NC | 2.0 | 1.0 | 800 | $800 | $1.00 | 23d | 1 | 0.95mi |
| 533 Stockton St Statesville, NC | 1.0 | 1.0 | 725 | $925 | $1.28 | 23d | 1 | 1.06mi |
| 612 Davie Ave Unit K Statesville, NC | 2.0 | 1.0 | 800 | $1,050 | $1.31 | 5d | 1 | 1.12mi |
| 548 Greenway Dr Statesville, NC | 3.0 | 2.0 | 1474 | $1,850 | $1.26 | 10d | 1 | 1.14mi |
| 548 Greenway Dr Statesville, NC | 3.0 | 2.0 | 1474 | $1,850 | $1.26 | 12d | 1 | 1.14mi |
| 616 Davie Ave Apt B Statesville, NC | 2.0 | 1.0 | 800 | $1,050 | $1.31 | 23d | 1 | 1.14mi |
| 321 Vernon Ln Statesville, NC | 3.0 | 2.0 | 1300 | $1,675 | $1.29 | 2d | 1 | 1.17mi |
| 333 Vernon Ln Statesville, NC | 3.0 | 3.0 | 1300 | $1,675 | $1.29 | 2d | 1 | 1.19mi |
| 704 N Miller Ave Statesville, NC | 2.0 | 1.0 | 728 | $1,250 | $1.72 | 10d | 1 | 1.26mi |
| 1711 Younger Ave Statesville, NC | 3.0 | 1.0 | 1020 | $1,350 | $1.32 | 23d | 1 | 1.28mi |
| 1823 Bristol Rd Statesville, NC | 3.0 | 2.5 | 1234 | $1,803 | $1.46 | 21d | 1 | 1.33mi |
| 804 Jost St Unit 70 Statesville, NC | 3.0 | 2.5 | 1446 | $1,923 | $1.33 | 23d | 1 | 1.33mi |
| 1813 Younger Ave Unit B Statesville, NC | 2.0 | 1.0 | 700 | $1,275 | $1.82 | 23d | 1 | 1.35mi |
| 637 Hartness Rd Statesville, NC | 3.0 | 1.5 | 1240 | $1,500 | $1.21 | 11d | 1 | 1.47mi |
Listing history 13 events
-
2026-06-18days on market $130,000 Active 15 DOM
-
2026-06-17days on market $130,000 Active 14 DOM
-
2026-06-16days on market $130,000 Active 13 DOM
-
2026-06-15days on market $130,000 Active 12 DOM
-
2026-06-13days on market $130,000 Active 10 DOM
-
2026-06-13days on market $130,000 Active 9 DOM
-
2026-06-09days on market $130,000 Active 6 DOM
-
2026-06-08days on market $130,000 Active 5 DOM
-
2026-06-07days on market $130,000 Active 4 DOM
-
2026-06-04statusdays on market $130,000 Active 1 DOM
-
2026-06-03days on market $130,000 Coming Soon 2 DOM
-
2026-06-02remarks 225-char remark
-
2026-06-02$130,000 Coming Soon 1 DOM
ⓘ Source: listings_history table (triggers on properties + properties_extension) + one-shot
backfill from property_details.listing_events for pre-trigger history.
Tax reassessment forecast NC · Resets to sale price
- Current annual tax
- $668 · $56/mo
- Projected year-2 tax
- $1,066 · $89/mo
- Expected delta
- +$398/yr (+$33/mo · 59.7%)
ⓘ Screening estimate from a state-policy table — verify with the county assessor before closing.
Climate risk First Street
- Flood 1/10 Low FEMA zone X (unshaded) · 0% chance over 30 yrs
- Wildfire 1/10 Low
- Heat 5/10 Major 7 d/yr ≥103°F today · 17 d/yr by 30 yrs out
- Wind 3/10 Moderate 5% chance of damaging wind over 30 yrs
- Air quality 3/10 Moderate 2 unhealthy d/yr today · 3 by 30 yrs out
Nearby sold comps map
Loading sold comps map…
Walkable amenities ~0.75 mi
Loading nearby amenities…
Taxation est. · year 1
- Rental income
- $15,938
- − Mortgage interest
- −$7,282
- − Property taxes
- −$668
- − Insurance
- −$650
- − Repairs & maintenance
- −$1,275
- − Management
- −$1,275
- − Depreciation
- −$3,782
- Taxable income
- $1,007
- Est. tax owed @ 24.0%
- −$242
- After-tax cash flow
- $2,851/yr
For passive investors: Depreciation is non-cash, so a rental often shows a tax loss while cash-flowing — sheltering income. Rental losses are passive: they offset passive income freely, and up to $25,000/yr can offset ordinary (W-2) income if you actively participate and your MAGI is under $100k (phasing out to $0 by $150k); unused losses carry forward. On sale, claimed depreciation is recaptured at up to 25%, and gains may owe capital-gains tax (a 1031 exchange can defer both). Figures are a year-1 estimate at your 24.0% rate — not tax advice; consult a CPA.
Schools (NCES district)
- District
- Iredell-Statesville Schools
- NCES district ID
- 3702310
- Math proficiency
- 53% ▲ 8.00%
- Reading proficiency
- 52% ▲ 4.00%
- Median HH income
- $51,201
- Composite
- 44.98/100
- National rank
- #2703
- State rank
- #51 of 178 in NC
Livability — Statesville
- Score
- 59/100
- State rank
- #557
- US rank
- #20505
Category grades
Schools grade is shown separately in the Schools card above.
Census & demographics
- Census place
- Statesville, NC
- County
- Iredell County · 182,638 people
- City population
- 78,393
- Metro
- Charlotte-Concord-Gastonia, NC-SC
- Population (ZIP)
- 38,819
- Household income
- $62,406
- Rent vs Own
- Severe rent burden
- 1174.0
Population outlook (Iredell County) Hauer SSP2
- Today (2025)
- 194,510 people
- By 2030
- 206,171 · +6.0%
- By 2040
- 227,781 · +17.1%
- By 2050
- 245,102 · +26.0%
- By 2075
- 280,896 · +44.4%
- By 2100
- 294,375 · +51.3%
Race, ethnicity, and origin ACS 2023
- Neighborhood character
- Diverse neighborhood (Simpson 0.57)
- Race & ethnicity
- White 60% Black 21% Hispanic / Latino 14% Two or more races 7%
- Hispanic origin (detail)
- Mexican 7%
- Common ancestry
- Serbian 3% Slovak 2% Scandinavian 1%
- Foreign-born
- 9% · Canada, Jamaica
- Languages at home
- 86% English-only · Spanish 12% Arabic 1% Other Indo-European 1%
Political lean MEDSL · Iredell
- 2024 margin
- Solid R (+32.6) · D 33.2% · R 65.8%
- 2008→2024 swing
- -8.2pp toward R · 2008: -24.4pp · 2024: -32.6pp
- All cycles
- 2024: R+32.6 2020: R+32.4 2016: R+36.8 2012: R+30.5 2008: R+24.4
Not yet ingested
- Civics
- —
Market trends
- HPI YoY
- ▼ -298.76%
- Current HPI
- 243.0445
- Rent YoY
- ▲ 0.20%
- Metro
- Charlotte-Concord-Gastonia, NC-SC
- State GDP YoY
- ▲ 3.28%
- F500 in state
- 26
Industry mix (Fortune 500 HQ in NC)
| Industry | F500 HQs | Revenue |
|---|---|---|
| Financial Services | 2 | $213B |
|
||
| Retail | 2 | $95B |
|
||
| Industrial Conglomerate | 1 | $38B |
|
||
| Metals / Steel | 1 | $35B |
|
||
| Utilities | 1 | $30B |
|
||
| Industrial Machinery | 1 | $19B |
|
||
Price history
+333.3% since first listed2 events — show timeline
- 2026-06-01 Coming Soon $130,000 CANOPYMLS as Distributed by MLS Grid
- 1985-07-01 Sold (Public Records) $30,000 Public Records
Property tax history
+3.1%/yrLatest (2025): $668 · +0.0% YoY. Source: county tax records.
Cash-flow waterfall
monthlySold comps — $/sqft
last 12 mo · ≤1 miLoading sold comps…