6106 Berwood Ter · Penn Estates, PA
Flood risk 1/10 · Minimal
- FEMA flood zone
- X (unshaded)
- Chance of flooding over 30 yrs
- 0.0%
- Est. flood insurance / yr
- $507 – $1,088
Fire risk 4/10 · Minor
- Est. fire insurance / yr
- $511 – $949
Heat risk 3/10 · Minor
- Hot days now (above 99°F)
- 7 days/yr
- Hot days in 30 yrs
- 15 days/yr
Wind risk 4/10 · Minor
- Chance of severe wind over 30 yrs
- 13.0%
Air-quality risk 2/10 · Minimal
- Unhealthy air days now
- 1 days/yr
- Unhealthy air days in 30 yrs
- 2 days/yr
Risk factors via First Street. Map © Google.
Why this score? — see what drove the D- grade
The composite is a weighted blend of 9 inputs, each scored 0–100. Each bar is that input's sub-score; the figure is the points it added to the 100-point composite (weight × sub-score).
- Cash flow +8.2/30.0
- ARV discount +7.5/15.0
- Rent growth +5.0/5.0
- 1% rule +4.0/10.0
- Schools +3.6/10.0
- Livability +3.4/5.0
- Condition / age +2.5/5.0
- DSCR +2.2/10.0
- Appreciation +0.0/10.0
$260,000
🖨 Deal sheet 📄 Offer letter ✓ Due diligence
Listing remarks
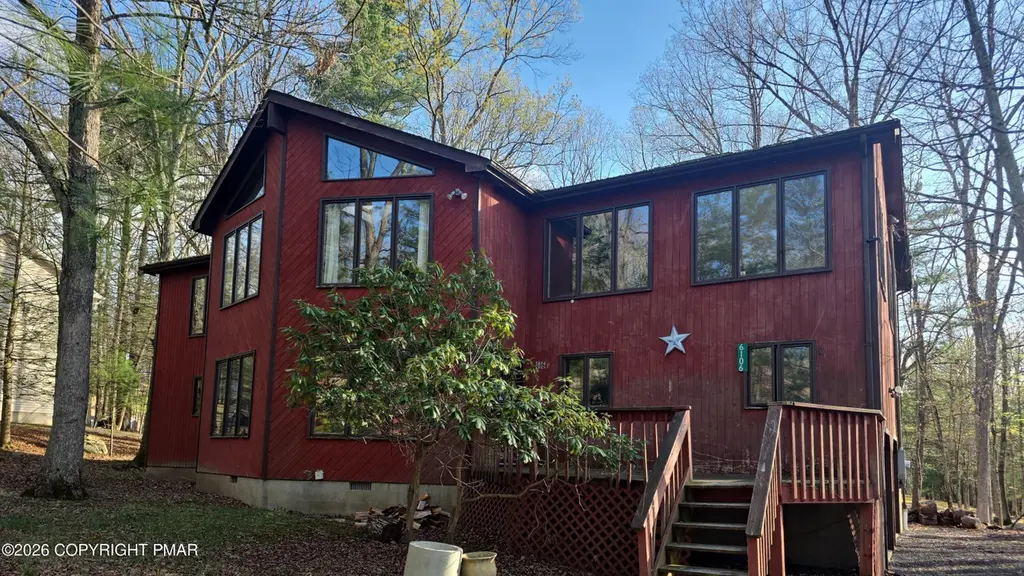
Tucked among tall trees in the Poconos, this contemporary home offers striking architecture and endless potential. Its bold red exterior and dramatic window lines bring in natural light from every angle, creating a warm connection to the surrounding woods. Inside, the open layout features two distinct living areas, each anchored by a stone fireplace that adds rustic charm and character. Vaulted ceilings and exposed beams enhance the spacious feel, while large picture windows frame serene forest views. The kitchen opens to a bright dining space with high ceilings and generous windows, ready to be re-imagined into a modern chef's hub. Multiple bedrooms provide flexibility for guests or family
Key facts
- Bold red exterior
- Rustic charm
- Stone fireplace
Tags
Property features AI
Finance
- Other: Directions: Main Gate of Penn Estates off of Hallet Road; follow Penn Estates Drive to a LEFT on Cranberry Ct, RIGHT on Hyland, LEFT on Berwood; home is on the right.; Subdivision: Penn Estates
- HOA & community: Homeowners association; Annual association fee (includes security); Community amenities: clubhouse, playground, tennis courts, pool, gated entry, security
Exterior
- Parking: Attached garage (2 spaces); Driveway; garage faces side
- Security: Gated community
- Utilities: Public water; Public sewer
- Home design: Single family house; Residential property
- Construction: Asphalt/fiberglass roof; Other foundation; Built as a house (year built not provided)
- Exterior features: Deck; Level lot with few trees; Paved private road with private maintenance and road maintenance agreement; Residential zoning
Interior
- Kitchen: Refrigerator
- Bedrooms: Total rooms: 7
- Flooring: Laminate; Tile
- Bathrooms: 2 full bathrooms; 1 half bathroom
- Heating & cooling: Heat pump (heating)
- Interior features: Kitchen island; High ceilings; Open floorplan; Two fireplaces (living room and other)
- Laundry & utility: Crawl space basement
Neighborhood map
What this means for you Summary
Snapshot
- This is a 3-bed/2.5-bath single-family listed at $260k.
Deal economics
- At list price, monthly cash flow is $-247 ($-3k/yr) — negative.
- To cash-flow at today's rent, offer at most $216k (16.8% below list).
- To meet the 1% rule (rent ≥ 1% of price), the offer needs to be $234k (10.0% below list).
- Recommended offer: $216k (16.8% below list) — sets the bar for cash-flow.
- Cap rate 5.2% vs local median 3.8% in Penn Estates — top-decile yield for the area; either an underpriced asset or a hidden risk that comps aren't pricing in. Stress-test before assuming the spread holds.
Location & tenants
- Location reads 68/100 on livability (#915 in PA) — a middle-class / working-renter tenant base. Strengths: employment A+, cost of living A+, housing A+; Watch: health & safety D, schools D-, amenities F.
- Stroudsburg Area SD (suburban): math 33% / reading 49% proficiency, ranked #315 of 539 in PA (top 58%) — families likely to look elsewhere, expect single-tenant / working-renter base with shorter leases.
- Market conditions: Rents rising fast (+10.4%/yr); 196 active listings in the ZIP; solid renter incomes; 278 units permitted in Monroe County in 2024 (52 in 5+ unit buildings).
- This rent runs 31% of the median local income ($91k/yr) — at the standard rent-burdened threshold; future hikes will face affordability resistance.
Forward outlook
- Local home prices are declining (-3.0%/yr); year-one equity from $2k of loan paydown is wiped out by about $8k of value loss. Plan a longer hold.
- Monroe County population projected at -11% by 2050 — secular population decline; favor cash flow + early exit over multi-decade hold.
Negotiation context
- Only 11 days on market — expect competitive offers; lowballing is unlikely to land.
Questions for the listing agent
- What do current leases actually rent for vs. the listed asking? Can we see a recent rent roll and the last 12 months of T-12 income?
- What does the HOA fee cover, when was the last increase, and are there any pending special assessments or reserve-fund shortfalls?
- Is there a deadline driving the sale (1031 exchange, divorce, estate, relocation)? That informs how much negotiation room exists.
- Schools are D-rated, which usually means shorter tenancies and higher turnover. Who's the typical renter profile here, and what's been the actual vacancy rate?
- The area grade is low — what's the realistic commute time and amenity access for the typical tenant pool here? Any planned neighborhood developments (good or bad) we should know about?
- What's the average days-on-market for RENTAL listings here right now (not sales)? A rising rental-DOM trend means longer vacancies and softer asking-rent achievability than the comps imply.
- What's the recent tenant-quality profile in this submarket — average credit score on applications, eviction rate, late-payment / NSF rate, and stable-employment percentage? A property-management company in the area should have these aggregated.
- How much new for-sale + rental construction is in the pipeline within 1–3 miles? Heavy new supply typically softens prices + rents 12–24 months out; constrained supply supports both.
Investment metrics
- 1% rule
- 0.90% ✗
- Cap rate
- 5.15%
- Cash-on-cash
- -4.07%
- DSCR
- 0.82
- GRM
- 9.3
CMA / ARV
No comps found within radius.
Projected returns pro-forma
-3.0% appreciation · 8.0% rent growth · sell at horizon
- IRR
- -16.7%
- Equity multiple
- 0.38×
- Total profit
- $-45,286
- Equity at exit
- $38,767
- IRR
- -0.4%
- Equity multiple
- 0.96×
- Total profit
- $-2,549
- Equity at exit
- $22,480
Cash invested: $72,800 (down + closing). Projections, not guarantees.
Landlord ↔ Tenant lean methodology
- Overall (STATE)
- 62 Landlord-Friendly
- State Pennsylvania
- 62 Landlord-Friendly · EVEN
- County
- — inherits STATE
- City
- — inherits STATE
ZIP-level market 18301
- Rents YoY
- 10.4%
- Active inventory
- 196
- Price-to-rent
- 9.3×
Monthly cashflow live
- Estimated rent
- $2,339 medium interval (Pro) →
- Mortgage (P&I)
- −$1,363
- Tax from tax record
- −$501 /mo · $6,011/yr
- Insurance
- −$108
- HOA
- −$122
- Vacancy / Maint / Mgmt
- −$491
- Net cashflow
- $-247
Break-even live
UW: 25.0% down · 7.5% · 30yr · 1.5% tax · 5.0% vac · 8.0% maint · 8.0% mgmt
Financing live
Cash to close
- Down payment
- $65,000
- Closing costs
- $7,800
- Reserves months
- —
- Total cash needed
- —
Loan-product check · same deal, 3 products live
Conventional
25% down · 7.5% · 30yr
- Down + closing
- —
- Monthly P&I
- —
- Monthly cashflow
- —
- DSCR
- —
- Eligible?
- —
Personal DTI + credit; lowest rate.
DSCR
20% down · 8.5% · 30yr
- Down + closing
- —
- Monthly P&I
- —
- Monthly cashflow
- —
- DSCR
- —
- Eligible?
- —
No personal income docs; deal must DSCR.
Hard money
10% down · 12.0% · 12mo
- Down + closing
- —
- Monthly P&I
- —
- Monthly cashflow
- —
- DSCR
- —
- Eligible?
- —
Short-term bridge; refi at stabilization.
HOA detail
- Monthly dues
- $122 · $1,464/yr
Listing history 9 events
-
2026-06-13statusdays on market $260,000 Pending 11 DOM
-
2026-06-10days on market $260,000 Active 9 DOM
-
2026-06-09days on market $260,000 Active 8 DOM
-
2026-06-08days on market $260,000 Active 7 DOM
-
2026-06-07days on market $260,000 Active 6 DOM
-
2026-06-05days on market $260,000 Active 3 DOM
-
2026-06-03days on market $260,000 Active 2 DOM
-
2026-06-02remarks 699-char remark
-
2026-06-02$260,000 Active 1 DOM
ⓘ Source: listings_history table (triggers on properties + properties_extension) + one-shot
backfill from property_details.listing_events for pre-trigger history.
Tax reassessment forecast PA · Partial reset (capped growth)
- Current annual tax
- $6,011 · $501/mo
- Projected year-2 tax
- $6,011 · $501/mo
- Expected delta
- $0/yr ($0/mo · 0.0%)
ⓘ Screening estimate from a state-policy table — verify with the county assessor before closing.
Climate risk First Street
- Flood 1/10 Low FEMA zone X (unshaded) · 0% chance over 30 yrs
- Wildfire 4/10 Moderate
- Heat 3/10 Moderate 7 d/yr ≥99°F today · 15 d/yr by 30 yrs out
- Wind 4/10 Moderate 13% chance of damaging wind over 30 yrs
- Air quality 2/10 Low 1 unhealthy d/yr today · 2 by 30 yrs out
Nearby sold comps map
Loading sold comps map…
Walkable amenities ~0.75 mi
Loading nearby amenities…
Taxation est. · year 1
- Rental income
- $28,066
- − Mortgage interest
- −$14,564
- − Property taxes
- −$6,011
- − Insurance
- −$1,300
- − Repairs & maintenance
- −$2,245
- − Management
- −$2,245
- − HOA
- −$1,464
- − Depreciation
- −$7,564
- Taxable loss
- −$7,327
- Est. tax savings @ 24.0%
- +$1,758
- After-tax cash flow
- $-1,206/yr
For passive investors: Depreciation is non-cash, so a rental often shows a tax loss while cash-flowing — sheltering income. Rental losses are passive: they offset passive income freely, and up to $25,000/yr can offset ordinary (W-2) income if you actively participate and your MAGI is under $100k (phasing out to $0 by $150k); unused losses carry forward. On sale, claimed depreciation is recaptured at up to 25%, and gains may owe capital-gains tax (a 1031 exchange can defer both). Figures are a year-1 estimate at your 24.0% rate — not tax advice; consult a CPA.
Schools (NCES district)
- District
- Stroudsburg Area SD
- NCES district ID
- 4222860
- Math proficiency
- 33% ▼ -10.00%
- Reading proficiency
- 49% ▼ -15.00%
- Median HH income
- $59,061
- Composite
- 36.13/100
- National rank
- #4747
- State rank
- #315 of 539 in PA
Livability — Penn Estates
- Score
- 68/100
- State rank
- #915
- US rank
- #9917
Category grades
Schools grade is shown separately in the Schools card above.
Census & demographics
- Census place
- Penn Estates, PA
- County
- Monroe County · 59,057 people
- Metro
- East Stroudsburg, PA
- Population (ZIP)
- 28,977
- Household income
- $90,522
- Rent vs Own
- Severe rent burden
- 672.0
Population outlook (Monroe County) Hauer SSP2
- Today (2025)
- 164,099 people
- By 2030
- 161,412 · -1.6%
- By 2040
- 154,616 · -5.8%
- By 2050
- 146,710 · -10.6%
- By 2075
- 140,830 · -14.2%
- By 2100
- 138,472 · -15.6%
Race, ethnicity, and origin ACS 2023
- Neighborhood character
- Diverse neighborhood (Simpson 0.64)
- Race & ethnicity
- White 53% Black 21% Hispanic / Latino 18% Two or more races 10% Asian 2%
- Hispanic origin (detail)
- Puerto Rican 8% Dominican 3%
- Common ancestry
- Romanian 6% Lithuanian 3% Portuguese 1%
- Foreign-born
- 12% · Canada, China, Jamaica
- Languages at home
- 82% English-only · Spanish 9% Russian/Polish/Slavic 2% Other Indo-European 2%
Political lean MEDSL · Monroe
- 2024 margin
- Toss-up / Even · D 49.1% · R 49.9%
- 2008→2024 swing
- -17.1pp toward R · 2008: 16.3pp · 2024: -0.8pp
- All cycles
- 2024: R+0.8 2020: D+6.4 2016: D+0.3 2012: D+14.0 2008: D+16.3
Not yet ingested
- Civics
- —
Market trends
- HPI YoY
- ▼ -109.90%
- Current HPI
- 154.4762
- Rent YoY
- ▲ 10.44%
- Metro
- East Stroudsburg, PA
- State GDP YoY
- ▲ 1.68%
- F500 in state
- 34
Industry mix (Fortune 500 HQ in PA)
| Industry | F500 HQs | Revenue |
|---|---|---|
| Healthcare | 2 | $309B |
|
||
| Insurance | 2 | $27B |
|
||
| Telecommunications / Media | 1 | $124B |
|
||
| Industrial Distribution | 1 | $22B |
|
||
| Financial Services | 1 | $20B |
|
||
| Chemicals / Materials | 1 | $18B |
|
||
Price history
-6.8% since first listed2 events — show timeline
- 2026-06-01 Listed $260,000 PMAR
- 2005-10-18 Sold (Public Records) $279,000 Public Records
Property tax history
-4.0%/yrLatest (2026): $6,011 · -0.0% YoY. Source: county tax records.
Cash-flow waterfall
monthlySold comps — $/sqft
last 12 mo · ≤1 miLoading sold comps…