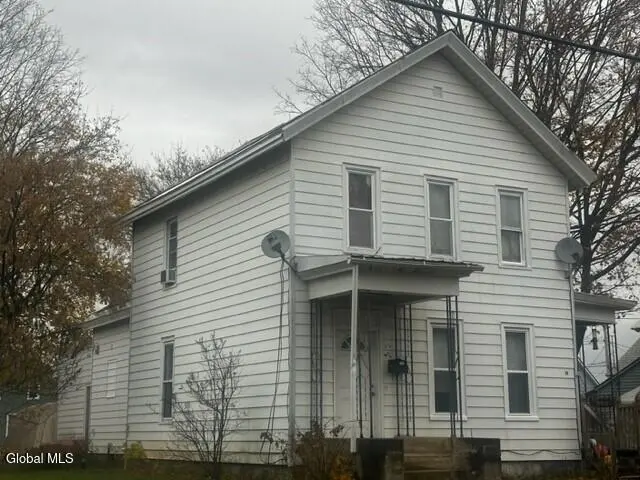
19 1st St · Glens Falls, NY
Flood risk No data
- FEMA flood zone
- —
- Chance of flooding over 30 yrs
- —
- Est. flood insurance / yr
- —
Fire risk No data
- Est. fire insurance / yr
- —
Heat risk No data
- Hot days now (above threshold)
- —
- Hot days in 30 yrs
- —
Wind risk No data
- Chance of severe wind over 30 yrs
- —
Air-quality risk No data
- Unhealthy air days now
- —
- Unhealthy air days in 30 yrs
- —
Risk factors via First Street. Map © Google.
Why this score? — see what drove the D grade
The composite is a weighted blend of 9 inputs, each scored 0–100. Each bar is that input's sub-score; the figure is the points it added to the 100-point composite (weight × sub-score).
- ARV discount +15.0/15.0
- Cash flow +9.7/30.0
- Livability +4.2/5.0
- Schools +4.1/10.0
- DSCR +2.8/10.0
- 1% rule +2.7/10.0
- Rent growth +2.5/5.0
- Condition / age +2.5/5.0
- Appreciation +0.0/10.0
$245,000
🖨 Deal sheet 📄 Offer letter ✓ Due diligence
Listing remarks MLS
ATTENTION INVESTORS: Come visit this 2 family home in the Heart of Glens Falls within walking distance to Downtown. Rents are below market value and create a tremendous upside potential. It may be possible to vacate a unit and allow for a FHA owner occupied buyer with 96.5% financing. Won't last long at this price.
Key facts
- 7,840 sq ft lot
- 6 parking spots
- Built 1900
Neighborhood map
What this means for you Summary
Snapshot
- This is a 3-bed/1.0-bath single-family listed at $245k.
Deal economics
- At list price, monthly cash flow is $-159 ($-2k/yr) — negative.
- To cash-flow at today's rent, offer at most $217k (11.5% below list).
- To meet the 1% rule (rent ≥ 1% of price), the offer needs to be $188k (23.3% below list).
- Recommended offer: $188k (23.3% below list) — sets the bar for 1% rule.
Location & tenants
- Location reads 83/100 on livability (#60 in NY, #894 nationally) — a professional / high-income tenant draw. Strengths: crime A+, amenities A+, housing A+.
- Glens Falls City School District (urban): math 44% / reading 53% proficiency, ranked #416 of 590 in NY (top 70%) — families likely to look elsewhere, expect single-tenant / working-renter base with shorter leases.
- Market conditions: 56 active listings in the ZIP; 3 comparable units currently listed for rent nearby; rentals at typical pace (median 21d on market — plan ~3-4 weeks tenant-placement turnaround); 180 units permitted in Warren County in 2024 (40 in 5+ unit buildings).
- This rent runs 33% of the median local income ($68k/yr) — at the standard rent-burdened threshold; future hikes will face affordability resistance.
Forward outlook
- Local home prices are declining (-3.0%/yr); year-one equity from $2k of loan paydown is wiped out by about $7k of value loss. Plan a longer hold.
- Warren County population projected at -19% by 2050 — secular population decline; favor cash flow + early exit over multi-decade hold.
Negotiation context
- It's been on market 222 days — a 12% lower offer ($216k) is reasonable based on typical stale-listing flexibility.
- 3 sale attempts since 3y ago with the ask held roughly flat each time — persistent listings suggest the price (not the market) is what's stuck; bring a comps-based counter.
- Current owner paid $2k; list at $245k implies a 16233% gain — meaningful room to come down on a strong offer.
Risks & watch-outs
- Watch-outs: built in 1900 — expect roof / HVAC / electrical / plumbing capex.
Questions for the listing agent
- What do current leases actually rent for vs. the listed asking? Can we see a recent rent roll and the last 12 months of T-12 income?
- It's been on market 222 days. Have you received any prior offers? Is the seller open to a 23% concession, seller financing, or rate buy-down credit?
- Built in 1900 — when were the roof, HVAC, electrical panel, plumbing, and water heater last replaced?
- Why hasn't it sold? Are there any deal-killer items the seller is aware of (foundation, flood, title, zoning, code violations)?
- Is there a deadline driving the sale (1031 exchange, divorce, estate, relocation)? That informs how much negotiation room exists.
- The area grade is low — what's the realistic commute time and amenity access for the typical tenant pool here? Any planned neighborhood developments (good or bad) we should know about?
- What's the average days-on-market for RENTAL listings here right now (not sales)? A rising rental-DOM trend means longer vacancies and softer asking-rent achievability than the comps imply.
- What's the recent tenant-quality profile in this submarket — average credit score on applications, eviction rate, late-payment / NSF rate, and stable-employment percentage? A property-management company in the area should have these aggregated.
- How much new for-sale + rental construction is in the pipeline within 1–3 miles? Heavy new supply typically softens prices + rents 12–24 months out; constrained supply supports both.
Investment metrics
- 1% rule
- 0.77% ✗
- Cap rate
- 5.51%
- Cash-on-cash
- -2.78%
- DSCR
- 0.88
- GRM
- 10.9
CMA / ARV
- ARV (median comp)
- $420,747
- List price
- $245,000
- Delta
- -41.77%
- Verdict
- UNDERPRICED
- Comps
- 20 within 1.0 mi
Show comp detail 12 sales within ~0.75 mi
| Address | Dist | Beds/Ba | Sqft | Sold | Price | $/sf | Match |
|---|---|---|---|---|---|---|---|
| 68 1st St | 0.24mi | 3/1.0 | 1,266 (-2%) | 1mo | $252,000 | $199 | 84 |
| 59 First St | 0.21mi | 3/1.5 | 1,249 (-3%) | 8mo | $90,000 | $72 | 76 |
| 11 Second St | 0.09mi | 3/2.0 | 1,400 (+8%) | 2mo | $236,000 | $169 | 76 |
| 30 4th St | 0.27mi | 3/1.0 | 1,378 (+7%) | 3mo | $265,000 | $192 | 73 |
| 69 Knight St | 0.53mi | 3/1.0 | 1,280 (-1%) | 6mo | $250,000 | $195 | 69 |
| 10 Caroline St | 0.63mi | 3/1.5 | 1,296 (+0%) | 5mo | $265,000 | $204 | 64 |
| 5 Quade St | 0.50mi | 3/1.0 | 1,237 (-4%) | 8mo | $234,000 | $189 | 63 |
| 11 E Boylston St | 0.54mi | 3/2.0 | 1,325 (+3%) | 6mo | $325,000 | $245 | 62 |
| 52 Staple St | 0.33mi | 4/1.0 (+1) | 1,138 (-12%) | 8mo | $251,500 | $221 | 53 |
| 6 Riverview St | 0.67mi | 3/1.5 | 1,372 (+6%) | 7mo | $320,000 | $233 | 50 |
| 17 Columbia Ave | 0.68mi | 2/2.0 (-1) | 1,232 (-4%) | 4mo | $289,000 | $235 | 48 |
| 15 Holden Ave | 0.55mi | 2/1.0 (-1) | 1,158 (-10%) | 5mo | $200,000 | $173 | 48 |
Match score weights: distance 35% · size 25% · config 20% · recency 20%. Top-matched comps best support the ARV.
Projected returns pro-forma
-3.0% appreciation · 3.0% rent growth · sell at horizon
- IRR
- -20.9%
- Equity multiple
- 0.27×
- Total profit
- $-49,843
- Equity at exit
- $36,530
- IRR
- -14.3%
- Equity multiple
- 0.18×
- Total profit
- $-56,469
- Equity at exit
- $21,183
Cash invested: $68,600 (down + closing). Projections, not guarantees.
Landlord ↔ Tenant lean methodology
- Overall (STATE)
- 15 Strongly Tenant-Friendly
- State New York
- 15 Strongly Tenant-Friendly · D+10
- County
- — inherits STATE
- City
- — inherits STATE
ZIP-level market 12801
- Home prices YoY
- -13.7%
- Active inventory
- 56
- Price-to-rent
- 10.9×
Monthly cashflow live
- Estimated rent
- $1,878 medium interval (Pro) →
- Mortgage (P&I)
- −$1,285
- Tax from tax record
- −$256 /mo · $3,071/yr
- Insurance
- −$102
- HOA
- −$0
- Vacancy / Maint / Mgmt
- −$394
- Net cashflow
- $-159
Break-even live
UW: 25.0% down · 7.5% · 30yr · 1.5% tax · 5.0% vac · 8.0% maint · 8.0% mgmt
Financing live
Cash to close
- Down payment
- $61,250
- Closing costs
- $7,350
- Reserves months
- —
- Total cash needed
- —
Loan-product check · same deal, 3 products live
Conventional
25% down · 7.5% · 30yr
- Down + closing
- —
- Monthly P&I
- —
- Monthly cashflow
- —
- DSCR
- —
- Eligible?
- —
Personal DTI + credit; lowest rate.
DSCR
20% down · 8.5% · 30yr
- Down + closing
- —
- Monthly P&I
- —
- Monthly cashflow
- —
- DSCR
- —
- Eligible?
- —
No personal income docs; deal must DSCR.
Hard money
10% down · 12.0% · 12mo
- Down + closing
- —
- Monthly P&I
- —
- Monthly cashflow
- —
- DSCR
- —
- Eligible?
- —
Short-term bridge; refi at stabilization.
Rent comps 3 comps
| Address | Beds | Baths | Sqft | Rent | $/sqft | DOM | Units | Dist |
|---|---|---|---|---|---|---|---|---|
| 60-62 Lawrence St Glens Falls, NY | 2.0 | 1.0 | 1000 | $1,650 | $1.65 | 14d | 1 | 1.01mi |
| 11 Hunter St Glens Falls, NY | 2.0 | 1.0 | 1465 | $2,200 | $1.50 | 21d | 1 | 1.03mi |
| 173 Bay St Glens Falls, NY | 3.0 | 1.0 | 1200 | $1,795 | $1.50 | 43d | 1 | 1.16mi |
Listing history 25 events
-
2026-06-19days on market $245,000 Active 222 DOM
-
2026-06-18days on market $245,000 Active 221 DOM
-
2026-06-17days on market $245,000 Active 220 DOM
-
2026-06-16days on market $245,000 Active 219 DOM
-
2026-06-15days on market $245,000 Active 218 DOM
-
2026-06-14days on market $245,000 Active 216 DOM
-
2026-06-12days on market $245,000 Active 215 DOM
-
2026-06-09days on market $245,000 Active 212 DOM
-
2026-06-08days on market $245,000 Active 211 DOM
-
2026-06-07days on market $245,000 Active 210 DOM
-
2026-06-04days on market $245,000 Active 206 DOM
-
2026-06-02days on market $245,000 Active 205 DOM
-
2026-06-01days on market $245,000 Active 204 DOM
-
2026-05-31days on market $245,000 Active 203 DOM
-
2026-05-31days on market $245,000 Active 202 DOM
-
2026-03-11price $245,000 321-char remark
Show marketing remark (321 chars)
ATTENTION INVESTORS: Come visit this 2 family home in the Heart of Glens Falls within walking distance to Downtown. Rents are below market value and create a tremendous upside potential. It may be possible to vacate a unit and allow for a FHA owner occupied buyer with 96.5% financing. Won't last long at this price.
-
2025-11-09$250,000 Active 321-char remark
Show marketing remark (321 chars)
ATTENTION INVESTORS: Come visit this 2 family home in the Heart of Glens Falls within walking distance to Downtown. Rents are below market value and create a tremendous upside potential. It may be possible to vacate a unit and allow for a FHA owner occupied buyer with 96.5% financing. Won't last long at this price.
-
2024-08-14soldstatus $1,500
-
2023-09-04historical
-
2023-07-27status Active
-
2023-03-15historical
-
2023-03-14price $180,000
-
2023-03-03$175,000 Active
-
2013-05-06soldstatus $200,000
-
2003-02-05soldstatus $66,500
ⓘ Source: listings_history table (triggers on properties + properties_extension) + one-shot
backfill from property_details.listing_events for pre-trigger history.
Tax reassessment forecast NY · Partial reset (capped growth)
- Current annual tax
- $3,071 · $256/mo
- Projected year-2 tax
- $3,606 · $300/mo
- Expected delta
- +$535/yr (+$45/mo · 17.4%)
ⓘ Screening estimate from a state-policy table — verify with the county assessor before closing.
Nearby sold comps map
Loading sold comps map…
Walkable amenities ~0.75 mi
Loading nearby amenities…
Taxation est. · year 1
- Rental income
- $22,536
- − Mortgage interest
- −$13,724
- − Property taxes
- −$3,071
- − Insurance
- −$1,225
- − Repairs & maintenance
- −$1,803
- − Management
- −$1,803
- − Depreciation
- −$7,127
- Taxable loss
- −$6,217
- Est. tax savings @ 24.0%
- +$1,492
- After-tax cash flow
- $-418/yr
For passive investors: Depreciation is non-cash, so a rental often shows a tax loss while cash-flowing — sheltering income. Rental losses are passive: they offset passive income freely, and up to $25,000/yr can offset ordinary (W-2) income if you actively participate and your MAGI is under $100k (phasing out to $0 by $150k); unused losses carry forward. On sale, claimed depreciation is recaptured at up to 25%, and gains may owe capital-gains tax (a 1031 exchange can defer both). Figures are a year-1 estimate at your 24.0% rate — not tax advice; consult a CPA.
Schools (NCES district)
- District
- Glens Falls City School District
- NCES district ID
- 3612240
- Math proficiency
- 44% ▼ -8.00%
- Reading proficiency
- 53% ▲ 6.00%
- Median HH income
- $48,216
- Composite
- 41.34/100
- National rank
- #3499
- State rank
- #416 of 590 in NY
Livability — Glens Falls
- Score
- 83/100
- State rank
- #60
- US rank
- #894
Category grades
Schools grade is shown separately in the Schools card above.
Census & demographics
- Census place
- Glens Falls, NY
- County
- Warren County · 14,628 people
- City population
- 14,628
- Metro
- Glens Falls, NY
- Population (ZIP)
- 14,628
- Household income
- $67,577
- Rent vs Own
- Severe rent burden
- 866.0
Population outlook (Warren County) Hauer SSP2
- Today (2025)
- 62,372 people
- By 2030
- 60,491 · -3.0%
- By 2040
- 55,616 · -10.8%
- By 2050
- 50,437 · -19.1%
- By 2075
- 40,843 · -34.5%
- By 2100
- 31,159 · -50.0%
Race, ethnicity, and origin ACS 2023
- Neighborhood character
- Predominantly White (90%)
- Race & ethnicity
- White 90% Two or more races 6% Hispanic / Latino 3% Black 2%
- Common ancestry
- Lithuanian 9% Romanian 5% Slovak 5%
- Foreign-born
- 3% · Canada, Dominican Republic
- Languages at home
- 97% English-only · Spanish 1% German/W. Germanic 1%
Political lean MEDSL · Warren
- 2024 margin
- Toss-up / Even · D 47.9% · R 52.1%
- 2008→2024 swing
- -6.9pp toward R · 2008: 2.6pp · 2024: -4.2pp
- All cycles
- 2024: R+4.2 2020: R+0.2 2016: R+10.6 2012: D+2.1 2008: D+2.6
Not yet ingested
- Civics
- —
Market trends
- HPI YoY
- ▼ -52.28%
- Current HPI
- 330.581
- Rent YoY
- —
- Metro
- Glens Falls, NY
- State GDP YoY
- ▲ 2.60%
- F500 in state
- 92
Industry mix (Fortune 500 HQ in NY)
| Industry | F500 HQs | Revenue |
|---|---|---|
| Financial Services | 10 | $950B |
|
||
| Consumer Goods | 9 | $162B |
|
||
| Insurance | 4 | $225B |
|
||
| Telecommunications | 2 | $144B |
|
||
| Pharmaceuticals | 2 | $112B |
|
||
| Media / Entertainment | 2 | $69B |
|
||
Price history
+268.4% since first listed10 events — show timeline
- 2026-03-11 Price Changed $245,000 Global MLS
- 2025-11-09 Listed $250,000 Global MLS
- 2024-08-14 Sold (Public Records) $1,500 Public Records
- 2023-09-04 Listing Removed — Global MLS
- 2023-07-27 Relisted — Global MLS
- 2023-03-15 Listing Removed — Global MLS
- 2023-03-14 Price Changed $180,000 Global MLS
- 2023-03-03 Listed $175,000 Global MLS
- 2013-05-06 Sold (Public Records) $200,000 Public Records
- 2003-02-05 Sold (Public Records) $66,500 Public Records
Property tax history
+4.7%/yrLatest (2025): $3,071 · +6.8% YoY. Source: county tax records.
Cash-flow waterfall
monthlySold comps — $/sqft
last 12 mo · ≤1 miLoading sold comps…