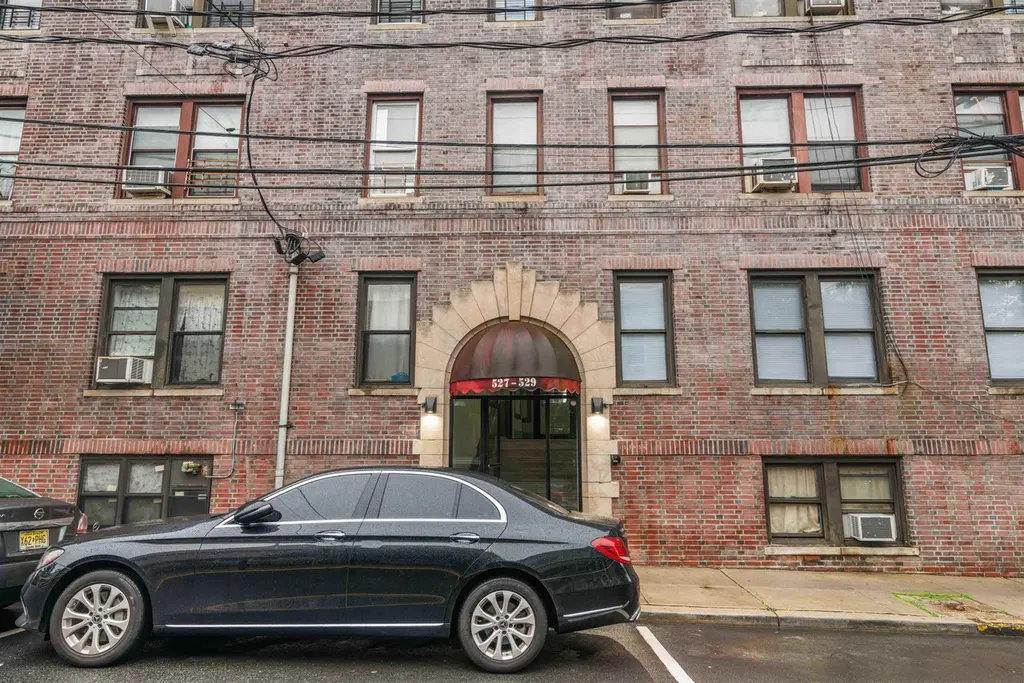
527-29 34TH St Unit B4 · Union City, NJ
Flood risk 1/10 · Minimal
- FEMA flood zone
- X (unshaded)
- Chance of flooding over 30 yrs
- 0.0%
- Est. flood insurance / yr
- $507 – $1,088
Fire risk 1/10 · Minimal
- Est. fire insurance / yr
- $526 – $976
Heat risk 7/10 · Major
- Hot days now (above 98°F)
- 7 days/yr
- Hot days in 30 yrs
- 15 days/yr
Wind risk 6/10 · Moderate
- Chance of severe wind over 30 yrs
- 27.0%
Air-quality risk 4/10 · Minor
- Unhealthy air days now
- 5 days/yr
- Unhealthy air days in 30 yrs
- 6 days/yr
Risk factors via First Street. Map © Google.
Why this score? — see what drove the D grade
The composite is a weighted blend of 9 inputs, each scored 0–100. Each bar is that input's sub-score; the figure is the points it added to the 100-point composite (weight × sub-score).
- Appreciation +10.0/10.0
- ARV discount +7.5/15.0
- Cash flow +6.6/30.0
- 1% rule +4.5/10.0
- Livability +3.9/5.0
- Condition / age +3.8/5.0
- Rent growth +2.7/5.0
- Schools +2.2/10.0
- DSCR +0.9/10.0
$202,000
🖨 Deal sheet (PDF) 📄 Offer letter ✓ Due diligence
Listing remarks MLS
Beautiful 1 bedroom 1 bath in great condition in a brick building, featuring hardwood floors, heat and hot water included in the maintenance fee and centrally located in the Heart of Union City near all public transportation to NYC and all major highways, few minutes away from Lincoln Tunnel, this will not last, call today and make your appointment.
Key facts
- Centrally located
- Near major highways
- Brick building
Tags
Neighborhood map
What this means for you Summary
Snapshot
- This is a 1-bed/1.0-bath condo listed at $202k. Condition is rated good.
Deal economics
- At list price, monthly cash flow is $-329 ($-4k/yr) — negative.
- To cash-flow at today's rent, offer at most $154k (23.6% below list).
- To meet the 1% rule (rent ≥ 1% of price), the offer needs to be $193k (4.6% below list).
- Recommended offer: $154k (23.6% below list) — sets the bar for cash-flow.
- Cap rate 4.3% vs local median 2.3% in Union City — top-decile yield for the area; either an underpriced asset or a hidden risk that comps aren't pricing in. Stress-test before assuming the spread holds.
Location & tenants
- Location reads 77/100 on livability (#117 in NJ, #2,998 nationally) — a middle-class / working-renter tenant base. Strengths: amenities A+, commute A+, health & safety A; Watch: cost of living F.
- Union City School District (suburban): math 15% / reading 36% proficiency, ranked #399 of 472 in NJ (top 84%) — low school quality limits family demand, transient renter base, plan for 1-2y turnover; 85% free/reduced lunch — lower-income household profile, screen leases tightly.
- Zoned schools: George Washington Elementary School (math 10% / reading 29%, grade F, #1,012 of 1,303 statewide, top 79%, 779 students, 90% FRL); Union Hill Middle School (math 18% / reading 40%, grade F, #321 of 431 statewide, top 77%, 849 students, 91% FRL); Union City High School (math 12% / reading 35%, grade F, #331 of 399 statewide, top 83%, 3,025 students, 83% FRL) — zoned schools at 88% FRL track the district average.
- Market conditions: Rents flat; 228 active listings in the ZIP; 4 comparable units currently listed for rent nearby; rentals at typical pace (median 27d on market — plan ~3-4 weeks tenant-placement turnaround); 5,310 units permitted in Hudson County in 2024 (4,154 in 5+ unit buildings).
- This rent runs 36% of the median local income ($64k/yr) — at the standard rent-burdened threshold; future hikes will face affordability resistance.
Forward outlook
- In year one you build about $22k of equity ($1k loan paydown + $20k appreciation (10.0% local appreciation)).
- Hudson County population projected at +29% by 2050 — long-run rental-demand tailwind backs the buy-and-hold thesis.
- By year 2, paydown + projected appreciation supports a ~$35k cash-out refi (75% LTV) — recoverable capital for the next deal without selling this one.
Negotiation context
- It's been on market 152 days — a 12% lower offer ($178k) is reasonable based on typical stale-listing flexibility.
- 2 sale attempts; this cycle's ask has dropped $13k (6%) from the opening price — seller is motivated, your offer sets the floor, not the list.
Risks & watch-outs
- Watch-outs: HOA is 24% of rent.
- Climate carrying-cost: major wind risk, 27% chance of damaging wind over 30y; extreme-heat days projected 7→15/yr by 2055 (HVAC capex compounding) — expect insurance premiums to compound above CPI over the hold.
Questions for the listing agent
- What do current leases actually rent for vs. the listed asking? Can we see a recent rent roll and the last 12 months of T-12 income?
- It's been on market 152 days. Have you received any prior offers? Is the seller open to a 24% concession, seller financing, or rate buy-down credit?
- What does the HOA fee cover, when was the last increase, and are there any pending special assessments or reserve-fund shortfalls?
- Any open or pending special assessments — roof, HVAC, plumbing, elevator, façade? What's the per-unit balance and payoff schedule, and is the seller paying it off at close or rolling it to the buyer?
- Why hasn't it sold? Are there any deal-killer items the seller is aware of (foundation, flood, title, zoning, code violations)?
- Is there a deadline driving the sale (1031 exchange, divorce, estate, relocation)? That informs how much negotiation room exists.
- The area grade is low — what's the realistic commute time and amenity access for the typical tenant pool here? Any planned neighborhood developments (good or bad) we should know about?
- What's the average days-on-market for RENTAL listings here right now (not sales)? A rising rental-DOM trend means longer vacancies and softer asking-rent achievability than the comps imply.
- What's the recent tenant-quality profile in this submarket — average credit score on applications, eviction rate, late-payment / NSF rate, and stable-employment percentage? A property-management company in the area should have these aggregated.
- How much new apartment / multifamily construction is in the pipeline within 1–3 miles? Heavy new supply (>2% of stock underway) typically softens rents 12–24 months out; light construction supports rent growth.
Investment metrics
- 1% rule
- 0.95% ✗
- Cap rate
- 4.34%
- Cash-on-cash
- -6.99%
- DSCR
- 0.69
- GRM
- 8.7
CMA / ARV
No comps found within radius.
Projected returns pro-forma
10.0% appreciation · 0.89% rent growth · sell at horizon
- IRR
- 18.6%
- Equity multiple
- 2.51×
- Total profit
- $85,343
- Equity at exit
- $181,978
- IRR
- 16.8%
- Equity multiple
- 5.61×
- Total profit
- $260,977
- Equity at exit
- $392,442
Cash invested: $56,560 (down + closing). Projections, not guarantees.
Landlord ↔ Tenant lean methodology
- Overall (STATE)
- 21 Tenant-Leaning
- State New Jersey
- 21 Tenant-Leaning · D+6
- County
- — inherits STATE
- City
- — inherits STATE
ZIP-level market 07087
- Home prices YoY
- 9.6%
- Rents YoY
- 0.9%
- Active inventory
- 228
- Price-to-rent
- 8.7×
Monthly cashflow live
- Estimated rent
- $1,927 medium interval (Pro) →
- Mortgage (P&I)
- −$1,059
- Tax est. 1.5%
- −$252 /mo · $3,030/yr
- Insurance
- −$84
- HOA
- −$456
- Vacancy / Maint / Mgmt
- −$405
- Net cashflow
- $-329
Break-even live
Sensitivity live
| Price | -10% $-190 | -5% $-260 | +0% $-329 | +5% $-399 | +10% $-469 |
|---|---|---|---|---|---|
| Rent | -10% $-482 | -5% $-405 | +0% $-329 | +5% $-253 | +10% $-177 |
| Rate | -1.0pp $-228 | -0.5pp $-278 | base $-329 | +0.5pp $-382 | +1.0pp $-435 |
UW: 25.0% down · 7.5% · 30yr · 1.5% tax · 5.0% vac · 8.0% maint · 8.0% mgmt
Financing live
Cash to close
- Down payment
- $50,500
- Closing costs
- $6,060
- Reserves months
- —
- Total cash needed
- —
Loan-product check · same deal, 3 products live
Conventional
25% down · 7.5% · 30yr
- Down + closing
- —
- Monthly P&I
- —
- Monthly cashflow
- —
- DSCR
- —
- Eligible?
- —
Personal DTI + credit; lowest rate.
DSCR
20% down · 8.5% · 30yr
- Down + closing
- —
- Monthly P&I
- —
- Monthly cashflow
- —
- DSCR
- —
- Eligible?
- —
No personal income docs; deal must DSCR.
Hard money
10% down · 12.0% · 12mo
- Down + closing
- —
- Monthly P&I
- —
- Monthly cashflow
- —
- DSCR
- —
- Eligible?
- —
Short-term bridge; refi at stabilization.
Rent comps 4 comps
| Address | Beds | Baths | Sqft | Rent | $/sqft | DOM | Units | Dist |
|---|---|---|---|---|---|---|---|---|
| 213 48th St Unit 4A Union City, NJ | 1.0 | 1.0 | 360 | $1,825 | $5.07 | 45d | 1 | 0.71mi |
| 1 Plaza Dr Secaucus, NJ | — | 1.0 | 300 | $3,089 | $10.30 | 26d | 1 | 0.99mi |
| 510 10th St Unit Ground 1 Union City, NJ | — | 1.0 | 360 | $1,600 | $4.44 | 0d | 1 | 1.16mi |
| 9 Ave At Port Imperial West New York, NJ | 1.0–2.0 | 1.0–2.0 | 748 | $2,570 | $3.43 | 0d | 2 | 1.47mi |
HOA detail condo
- Monthly dues
- $456 · $5,472/yr
- Likely covers
- water
- Assessments
- None detected in remarks — confirm with the listing agent.
Listing history 11 events
-
2026-06-07days on market $202,000 Active 152 DOM
-
2026-06-04days on market $202,000 Active 149 DOM
-
2026-06-03days on market $202,000 Active 148 DOM
-
2026-06-02days on market $202,000 Active 147 DOM
-
2026-06-01days on market $202,000 Active 146 DOM
-
2026-05-31days on market $202,000 Active 145 DOM
-
2026-03-26price $202,000 351-char remark
Show marketing remark (351 chars)
Beautiful 1 bedroom 1 bath in great condition in a brick building, featuring hardwood floors, heat and hot water included in the maintenance fee and centrally located in the Heart of Union City near all public transportation to NYC and all major highways, few minutes away from Lincoln Tunnel, this will not last, call today and make your appointment.
-
2026-01-06$215,000 Active 351-char remark
Show marketing remark (351 chars)
Beautiful 1 bedroom 1 bath in great condition in a brick building, featuring hardwood floors, heat and hot water included in the maintenance fee and centrally located in the Heart of Union City near all public transportation to NYC and all major highways, few minutes away from Lincoln Tunnel, this will not last, call today and make your appointment.
-
2025-12-13historical
-
2025-07-31price $215,000
-
2025-06-12$220,000 Active
ⓘ Source: listings_history table (triggers on properties + properties_extension) + one-shot
backfill from property_details.listing_events for pre-trigger history.
Climate risk First Street
- Flood 1/10 Low FEMA zone X (unshaded) · 0% chance over 30 yrs
- Wildfire 1/10 Low
- Heat 7/10 Severe 7 d/yr ≥98°F today · 15 d/yr by 30 yrs out
- Wind 6/10 Major 27% chance of damaging wind over 30 yrs
- Air quality 4/10 Moderate 5 unhealthy d/yr today · 6 by 30 yrs out
Nearby sold comps map
Loading sold comps map…
Walkable amenities ~0.75 mi
Loading nearby amenities…
Taxation est. · year 1
- Rental income
- $23,129
- − Mortgage interest
- −$11,315
- − Property taxes
- −$3,030
- − Insurance
- −$1,010
- − Repairs & maintenance
- −$1,850
- − Management
- −$1,850
- − HOA
- −$5,472
- − Depreciation
- −$5,876
- Taxable loss
- −$7,275
- Est. tax savings @ 24.0%
- +$1,746
- After-tax cash flow
- $-2,206/yr
For passive investors: Depreciation is non-cash, so a rental often shows a tax loss while cash-flowing — sheltering income. Rental losses are passive: they offset passive income freely, and up to $25,000/yr can offset ordinary (W-2) income if you actively participate and your MAGI is under $100k (phasing out to $0 by $150k); unused losses carry forward. On sale, claimed depreciation is recaptured at up to 25%, and gains may owe capital-gains tax (a 1031 exchange can defer both). Figures are a year-1 estimate at your 24.0% rate — not tax advice; consult a CPA.
Condition & rehab AI · 12 photos
This 1-bedroom condo is in good condition with minimal repairs needed. It's located in a well-maintained brick building and is centrally located, making it an attractive investment.
Value-add opportunities
- Both Painting exterior brick — Enhances curb appeal and resale value
- Both Landscaping improvements — Enhances curb appeal and rental value
- Both New flooring in kitchen and bathrooms — Improves aesthetics and functionality
- Both New kitchen appliances — Enhances functionality and resale value
Renovation cost estimate screening
Value-add ROI direction
- Both Painting exterior brick — Enhances curb appeal and resale value ↑
- Both Landscaping improvements — Enhances curb appeal and rental value ↑
- Both New flooring in kitchen and bathrooms — Improves aesthetics and functionality ↑
- Both New kitchen appliances — Enhances functionality and resale value ↑
ⓘ Cost ranges are severity-bucket heuristics (US national rule-of-thumb). Get contractor quotes + a written scope before underwriting a rehab budget.
Schools (NCES district)
- District
- Union City School District
- NCES district ID
- 3416380
- Math proficiency
- 15% ▼ -19.00%
- Reading proficiency
- 36% ▼ -19.00%
- Median HH income
- $41,210
- Composite
- 21.55/100
- National rank
- #8312
- State rank
- #399 of 472 in NJ
Livability — Union City
- Score
- 77/100
- State rank
- #117
- US rank
- #2998
Category grades
Schools grade is shown separately in the Schools card above.
Census & demographics
- Census place
- Union City, NJ
- County
- Hudson County · 718,323 people
- City population
- 66,463
- Metro
- New York-Newark-Jersey City, NY-NJ-PA
- Population (ZIP)
- 66,463
- Household income
- $64,310
- Rent vs Own
- Severe rent burden
- 6042.0
Population outlook (Hudson County) Hauer SSP2
- Today (2025)
- 771,834 people
- By 2030
- 818,028 · +6.0%
- By 2040
- 907,866 · +17.6%
- By 2050
- 994,480 · +28.8%
- By 2075
- 1,163,301 · +50.7%
- By 2100
- 1,254,703 · +62.6%
Race, ethnicity, and origin ACS 2023
- Neighborhood character
- Predominantly Hispanic (82%)
- Race & ethnicity
- Hispanic / Latino 82% Two or more races 28% White 10% Asian 4% Black 3% Native American 2%
- Hispanic origin (detail)
- Mexican 7% Puerto Rican 8% Cuban 9% Dominican 17%
- Foreign-born
- 55% · Canada, Jamaica, China
- Languages at home
- 18% English-only · Spanish 74% Other Indo-European 2% Arabic 1%
Political lean MEDSL · Hudson
- 2024 margin
- Strong D (+28.1) · D 62.6% · R 34.6% · Other 2.8%
- 2008→2024 swing
- -18.7pp toward R · 2008: 46.7pp · 2024: 28.1pp
- All cycles
- 2024: D+28.1 2020: D+46.2 2016: D+51.8 2012: D+55.7 2008: D+46.7
Not yet ingested
- Civics
- —
Market trends
- HPI YoY
- ▲ 52.10%
- Current HPI
- 597.8126
- Rent YoY
- ▲ 0.89%
- Metro
- New York-Newark-Jersey City, NY-NJ-PA
- State GDP YoY
- ▲ 2.05%
- F500 in state
- 34
Industry mix (Fortune 500 HQ in NJ)
| Industry | F500 HQs | Revenue |
|---|---|---|
| Consumer Goods | 3 | $31B |
|
||
| Pharmaceuticals | 2 | $153B |
|
||
| Technology | 2 | $21B |
|
||
| Insurance | 2 | $20B |
|
||
| Healthcare | 2 | $19B |
|
||
| Financial Services | 1 | $70B |
|
||
Price history
-8.2% since first listed5 events — show timeline
- 2026-03-26 Price Changed $202,000 HCMLS
- 2026-01-06 Listed $215,000 HCMLS
- 2025-12-13 Listing Removed — HCMLS
- 2025-07-31 Price Changed $215,000 HCMLS
- 2025-06-12 Listed $220,000 HCMLS
Cash-flow waterfall
monthlySold comps — $/sqft
last 12 mo · ≤1 miLoading sold comps…