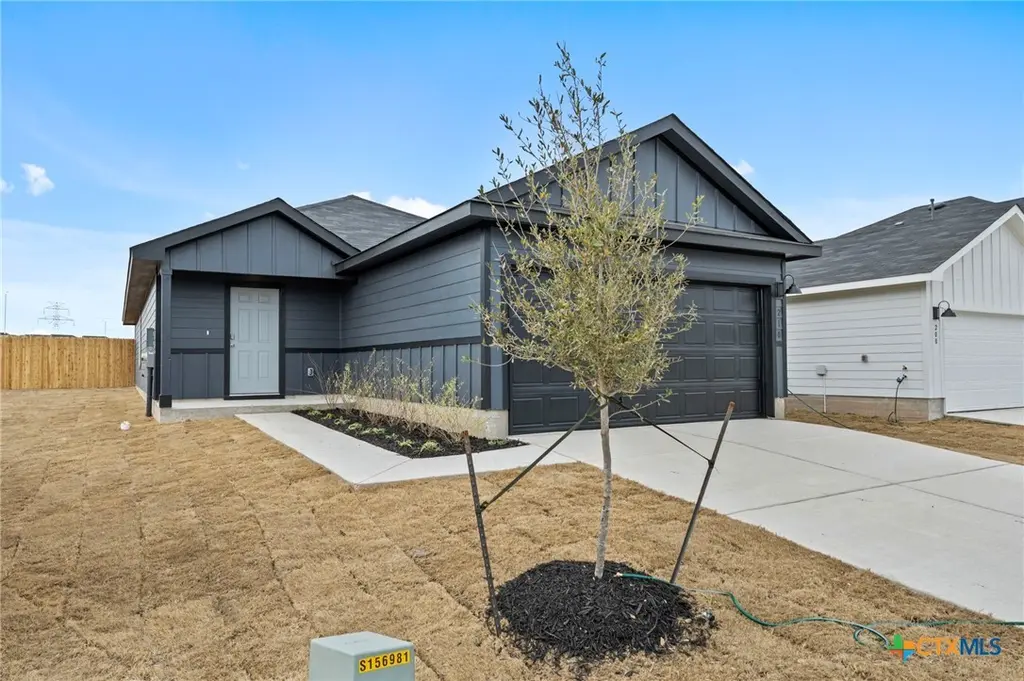
210 Langston Dr · Uhland, TX
Flood risk No data
- FEMA flood zone
- —
- Chance of flooding over 30 yrs
- —
- Est. flood insurance / yr
- —
Fire risk No data
- Est. fire insurance / yr
- —
Heat risk No data
- Hot days now (above threshold)
- —
- Hot days in 30 yrs
- —
Wind risk No data
- Chance of severe wind over 30 yrs
- —
Air-quality risk No data
- Unhealthy air days now
- —
- Unhealthy air days in 30 yrs
- —
Risk factors via First Street. Map © Google.
Why this score? — see what drove the D grade
The composite is a weighted blend of 9 inputs, each scored 0–100. Each bar is that input's sub-score; the figure is the points it added to the 100-point composite (weight × sub-score).
- ARV discount +12.2/15.0
- Cash flow +10.0/30.0
- Condition / age +4.0/5.0
- Schools +3.5/10.0
- 1% rule +3.3/10.0
- DSCR +2.8/10.0
- Livability +2.7/5.0
- Rent growth +2.4/5.0
- Appreciation +0.0/10.0
$264,000
🖨 Deal sheet (PDF) 📄 Offer letter ✓ Due diligence
Listing remarks
* 5% lender incentive offered with the use of the seller’s in-house lender! Incentive may be used towards buyer closing costs and/or rate buy-down, subject to lender approval and buyer qualification. Check out the Emma, one of our one-story floorplans available at Bollinger in Maxwell, Texas. This new home offers 4 bedrooms, 2 bathrooms and a 2-car garage within 1,572 square feet of living space. As you enter the home from the front porch, you'll cross the foyer to the open concept living area. The kitchen faces out to the dining room and family room, allowing for conversations to flow easily across the space as you make dinner and unwind from your day. The kitchen features an island
Key facts
- Quartz countertops
- Kitchen island
- Pantry closet
Tags
Property features AI
Finance
- HOA & community: Homeowners association (BOLLINGER HOA) with a monthly fee
Exterior
- Parking: Attached garage; 2-car garage
- Security: Smoke detector(s)
- Utilities: Electricity available; Natural gas available; Public water; Public sewer; Concrete road surface
- Home design: Single-story; New construction by DR Horton; Entry level: Main; Shingle/composition roof; Fiber cement exterior
- Construction: Built as new construction; Fiber cement construction; Slab foundation
- Exterior features: Sprinklers in ground; See remarks
Interior
- Kitchen: Dishwasher; Gas range; Range; Microwave; Some electric appliances; Some gas appliances
- Bedrooms: Bedroom 2 on main level (10 x 10); Bedroom 3 on main level (10 x 10); Bedroom 4 on main level (10 x 9)
- Flooring: Carpet; Vinyl
- Bathrooms: 2 full bathrooms; Separate shower
- Heating & cooling: Central heating (Electric and Natural Gas); Central air conditioning (one unit)
- Interior features: Open floorplan; Built-in features; Separate/formal dining room; Living/dining room; Dining area; Kitchen/family room combo; Kitchen/dining combo; Kitchen island; Pantry; Custom cabinets; Vanity; Walk-in closet(s); Separate shower (shower only); See remarks
- Laundry & utility: Washer hookup; Electric dryer hookup; Gas dryer hookup; Main level laundry room
Neighborhood map
What this means for you Summary
Snapshot
- This is a 4-bed/2.0-bath single-family listed at $264k. Condition is rated good.
Deal economics
- At list price, monthly cash flow is $-160 ($-2k/yr) — negative.
- To cash-flow at today's rent, offer at most $241k (8.8% below list).
- To meet the 1% rule (rent ≥ 1% of price), the offer needs to be $220k (16.5% below list).
- Recommended offer: $220k (16.5% below list) — sets the bar for 1% rule.
Location & tenants
- Location reads 54/100 on livability (#1,385 in TX) — a working-class tenant base; expect higher turnover. Strengths: cost of living A+, housing A+, crime A; Watch: employment C-, amenities F, commute F.
- Hays CISD (rural): math 35% / reading 41% proficiency, ranked #390 of 826 in TX (top 47%) — families likely to look elsewhere, expect single-tenant / working-renter base with shorter leases.
- Zoned schools: Hemphill El (math 22% / reading 32%, grade F, #2,791 of 4,322 statewide, top 68%, 577 students, 71% FRL); D J Red Simon Middle (math 16% / reading 22%, grade F, #1,466 of 1,662 statewide, top 89%, 733 students, 78% FRL); Lehman H S (math 20% / reading 32%, grade F, #1,234 of 1,632 statewide, top 76%, 2,120 students, 59% FRL) — zoned schools average 70% FRL vs 43% district-wide (26 pts higher); higher-poverty schools than district average — tighter screening recommended.
- Zoned-school proficiency averages 24% at this address vs 38% district-wide (-14 pts) — the specific schools serving this property underperform the Hays CISD average; the district grade overstates school quality for this exact location.
- Market conditions: Rents soft (-0.3%/yr); 1820 active listings in the ZIP; 2 comparable units currently listed for rent nearby; solid renter incomes; 529 units permitted in Caldwell County in 2024 (6 in 5+ unit buildings).
Forward outlook
- Local home prices are declining (-3.0%/yr); year-one equity from $2k of loan paydown is wiped out by about $8k of value loss. Plan a longer hold.
- Caldwell County population projected at +33% by 2050 — long-run rental-demand tailwind backs the buy-and-hold thesis.
Negotiation context
- It's been on market 60 days — a 3% lower offer ($256k) is reasonable based on typical stale-listing flexibility.
Questions for the listing agent
- What do current leases actually rent for vs. the listed asking? Can we see a recent rent roll and the last 12 months of T-12 income?
- It's been on market 60 days. Have you received any prior offers? Is the seller open to a 17% concession, seller financing, or rate buy-down credit?
- What does the HOA fee cover, when was the last increase, and are there any pending special assessments or reserve-fund shortfalls?
- Is there a deadline driving the sale (1031 exchange, divorce, estate, relocation)? That informs how much negotiation room exists.
- Schools are F-rated, which usually means shorter tenancies and higher turnover. Who's the typical renter profile here, and what's been the actual vacancy rate?
- The area grade is low — what's the realistic commute time and amenity access for the typical tenant pool here? Any planned neighborhood developments (good or bad) we should know about?
- What's the average days-on-market for RENTAL listings here right now (not sales)? A rising rental-DOM trend means longer vacancies and softer asking-rent achievability than the comps imply.
- What's the recent tenant-quality profile in this submarket — average credit score on applications, eviction rate, late-payment / NSF rate, and stable-employment percentage? A property-management company in the area should have these aggregated.
- How much new for-sale + rental construction is in the pipeline within 1–3 miles? Heavy new supply typically softens prices + rents 12–24 months out; constrained supply supports both.
Investment metrics
- 1% rule
- 0.83% ✗
- Cap rate
- 5.57%
- Cash-on-cash
- -2.60%
- DSCR
- 0.88
- GRM
- 10.0
CMA / ARV
- ARV (median comp)
- $294,551
- List price
- $264,000
- Delta
- -10.37%
- Verdict
- UNDERPRICED
- Comps
- 15 within 1.0 mi
Show comp detail 9 sales within ~0.75 mi
| Address | Dist | Beds/Ba | Sqft | Sold | Price | $/sf | Match |
|---|---|---|---|---|---|---|---|
| 325 Hodges St | 0.16mi | 3/2.0 (-1) | 1,575 (+0%) | 4mo | $324,990 | $206 | 84 |
| 439 Hodges St | 0.37mi | 3/2.0 (-1) | 1,575 (+0%) | 9mo | $289,990 | $184 | 70 |
| 205 Varner Way | 0.34mi | 4/2.5 | 1,543 (-2%) | 12mo | $263,615 | $171 | 69 |
| 341 Hodges St | 0.21mi | 4/2.0 | 1,796 (+14%) | 6mo | $330,990 | $184 | 61 |
| 223 Langston Dr | 0.47mi | 3/2.0 (-1) | 1,488 (-5%) | 10mo | $289,490 | $195 | 56 |
| 418 Hodges St | 0.49mi | 4/2.0 | 1,796 (+14%) | 1mo | $299,990 | $167 | 53 |
| 431 Hodges St | 0.35mi | 4/2.0 | 1,796 (+14%) | 9mo | $299,990 | $167 | 52 |
| 200 Kendall Ln | 0.51mi | 3/2.5 (-1) | 1,419 (-10%) | 5mo | $239,990 | $169 | 49 |
| 506 Hodges St | 0.39mi | 4/2.0 | 1,796 (+14%) | 12mo | $332,385 | $185 | 48 |
Match score weights: distance 35% · size 25% · config 20% · recency 20%. Top-matched comps best support the ARV.
Projected returns pro-forma
-3.0% appreciation · 0.0% rent growth · sell at horizon
- IRR
- -24.2%
- Equity multiple
- 0.20×
- Total profit
- $-59,353
- Equity at exit
- $39,363
- IRR
- -31.9%
- Equity multiple
- -0.21×
- Total profit
- $-89,448
- Equity at exit
- $22,826
Cash invested: $73,920 (down + closing). Projections, not guarantees.
Landlord ↔ Tenant lean methodology
- Overall (STATE)
- 87 Strongly Landlord-Friendly
- State Texas
- 87 Strongly Landlord-Friendly · R+5
- County
- — inherits STATE
- City
- — inherits STATE
ZIP-level market 78640
- Home prices YoY
- -33.8%
- Rents YoY
- -0.3%
- Active inventory
- 1820
- Price-to-rent
- 10.0×
Monthly cashflow live
- Estimated rent
- $2,204 medium interval (Pro) →
- Mortgage (P&I)
- −$1,384
- Tax est. 1.5%
- −$330 /mo · $3,960/yr
- Insurance
- −$110
- HOA
- −$77
- Vacancy / Maint / Mgmt
- −$463
- Net cashflow
- $-160
Break-even live
Sensitivity live
| Price | -10% $22 | -5% $-69 | +0% $-160 | +5% $-251 | +10% $-343 |
|---|---|---|---|---|---|
| Rent | -10% $-334 | -5% $-247 | +0% $-160 | +5% $-73 | +10% $14 |
| Rate | -1.0pp $-27 | -0.5pp $-93 | base $-160 | +0.5pp $-228 | +1.0pp $-298 |
UW: 25.0% down · 7.5% · 30yr · 1.5% tax · 5.0% vac · 8.0% maint · 8.0% mgmt
Financing live
Cash to close
- Down payment
- $66,000
- Closing costs
- $7,920
- Reserves months
- —
- Total cash needed
- —
Loan-product check · same deal, 3 products live
Conventional
25% down · 7.5% · 30yr
- Down + closing
- —
- Monthly P&I
- —
- Monthly cashflow
- —
- DSCR
- —
- Eligible?
- —
Personal DTI + credit; lowest rate.
DSCR
20% down · 8.5% · 30yr
- Down + closing
- —
- Monthly P&I
- —
- Monthly cashflow
- —
- DSCR
- —
- Eligible?
- —
No personal income docs; deal must DSCR.
Hard money
10% down · 12.0% · 12mo
- Down + closing
- —
- Monthly P&I
- —
- Monthly cashflow
- —
- DSCR
- —
- Eligible?
- —
Short-term bridge; refi at stabilization.
Rent comps 2 comps
| Address | Beds | Baths | Sqft | Rent | $/sqft | DOM | Units | Dist |
|---|---|---|---|---|---|---|---|---|
| 131 Kendall Ln Kyle, TX | 4.0 | 2.5 | 1543 | $1,895 | $1.23 | 22d | 1 | 0.26mi |
| 271 Cottonwood Trl Maxwell, TX | 3.0 | 2.0 | 1568 | $2,000 | $1.28 | 45d | 1 | 1.40mi |
HOA detail
- Monthly dues
- $77 · $924/yr
Listing history 15 events
-
2026-06-21days on market $264,000 Active 60 DOM
-
2026-06-18days on market $264,000 Active 57 DOM
-
2026-06-17days on market $264,000 Active 56 DOM
-
2026-06-16days on market $264,000 Active 55 DOM
-
2026-06-15days on market $264,000 Active 54 DOM
-
2026-06-13days on market $264,000 Active 52 DOM
-
2026-06-09days on market $264,000 Active 48 DOM
-
2026-06-08days on market $264,000 Active 47 DOM
-
2026-06-07pricedays on market $264,000 Active 46 DOM
-
2026-06-05days on market $265,000 Active 43 DOM
-
2026-06-03days on market $265,000 Active 42 DOM
-
2026-06-02days on market $265,000 Active 41 DOM
-
2026-06-01days on market $265,000 Active 40 DOM
-
2026-05-31days on market $265,000 Active 39 DOM
-
2026-04-22$265,000 Active 1587-char remark
ⓘ Source: listings_history table (triggers on properties + properties_extension) + one-shot
backfill from property_details.listing_events for pre-trigger history.
Nearby sold comps map
Loading sold comps map…
Walkable amenities ~0.75 mi
Loading nearby amenities…
Taxation est. · year 1
- Rental income
- $26,451
- − Mortgage interest
- −$14,788
- − Property taxes
- −$3,960
- − Insurance
- −$1,320
- − Repairs & maintenance
- −$2,116
- − Management
- −$2,116
- − HOA
- −$924
- − Depreciation
- −$7,680
- Taxable loss
- −$6,453
- Est. tax savings @ 24.0%
- +$1,549
- After-tax cash flow
- $-372/yr
For passive investors: Depreciation is non-cash, so a rental often shows a tax loss while cash-flowing — sheltering income. Rental losses are passive: they offset passive income freely, and up to $25,000/yr can offset ordinary (W-2) income if you actively participate and your MAGI is under $100k (phasing out to $0 by $150k); unused losses carry forward. On sale, claimed depreciation is recaptured at up to 25%, and gains may owe capital-gains tax (a 1031 exchange can defer both). Figures are a year-1 estimate at your 24.0% rate — not tax advice; consult a CPA.
Condition & rehab AI · 3 photos
This home is in excellent condition with minimal cosmetic updates needed. It offers a good starting point for investors looking to enhance its value through targeted improvements.
Value-add opportunities
- Both Painting exterior and interior walls — Enhances curb appeal and interior aesthetics
- Both Landscaping and irrigation system — Improves curb appeal and enhances property value
- Resale Kitchen backsplash and countertops — Modernizes the kitchen and adds value
- Resale Bathroom fixtures and vanity — Enhances bathroom aesthetics and functionality
Renovation cost estimate screening
Value-add ROI direction
- Both Painting exterior and interior walls — Enhances curb appeal and interior aesthetics ↑
- Both Landscaping and irrigation system — Improves curb appeal and enhances property value ↑
- Resale Kitchen backsplash and countertops — Modernizes the kitchen and adds value ↑
- Resale Bathroom fixtures and vanity — Enhances bathroom aesthetics and functionality ↑
ⓘ Cost ranges are severity-bucket heuristics (US national rule-of-thumb). Get contractor quotes + a written scope before underwriting a rehab budget.
Schools (NCES district)
- District
- Hays CISD
- NCES district ID
- 4800010
- Math proficiency
- 35% ▼ -15.00%
- Reading proficiency
- 41% ▼ -5.00%
- Median HH income
- $70,570
- Composite
- 34.78/100
- National rank
- #5118
- State rank
- #390 of 826 in TX
Livability — Uhland
- Score
- 54/100
- State rank
- #1385
- US rank
- #23774
Category grades
Schools grade is shown separately in the Schools card above.
Census & demographics
- County
- Hays County · 280,138 people
- Metro
- Austin-Round Rock-Georgetown, TX
- Population (ZIP)
- 77,531
- Household income
- $90,075
- Rent vs Own
- Severe rent burden
- 2552.0
Population outlook (Caldwell County) Hauer SSP2
- Today (2025)
- 46,557 people
- By 2030
- 49,673 · +6.7%
- By 2040
- 55,827 · +19.9%
- By 2050
- 61,832 · +32.8%
- By 2075
- 77,212 · +65.8%
- By 2100
- 89,225 · +91.6%
Race, ethnicity, and origin ACS 2023
- Neighborhood character
- Diverse neighborhood (Simpson 0.56)
- Race & ethnicity
- Hispanic / Latino 55% White 36% Two or more races 29% Black 5% Native American 1%
- Hispanic origin (detail)
- Mexican 47% Puerto Rican 1%
- Common ancestry
- Italian 2% Slovak 2% Lithuanian 1%
- Foreign-born
- 13% · Canada
- Languages at home
- 63% English-only · Spanish 35%
Political lean MEDSL · Caldwell
- 2024 margin
- R (+14.4) · D 42.2% · R 56.6% · Other 1.2%
- 2008→2024 swing
- -8.4pp toward R · 2008: -6.0pp · 2024: -14.4pp
- All cycles
- 2024: R+14.4 2020: R+9.1 2016: R+15.8 2012: R+11.1 2008: R+6.0
Not yet ingested
- Civics
- —
Market trends
- HPI YoY
- ▼ -92.64%
- Current HPI
- 181.7969
- Rent YoY
- ▼ -0.34%
- Metro
- Austin-Round Rock-Georgetown, TX
- State GDP YoY
- ▲ 3.95%
- F500 in state
- 110
Industry mix (Fortune 500 HQ in TX)
| Industry | F500 HQs | Revenue |
|---|---|---|
| Energy | 16 | $1,198B |
|
||
| Technology | 5 | $198B |
|
||
| Engineering / Construction | 4 | $72B |
|
||
| Energy Services | 3 | $60B |
|
||
| Utilities | 3 | $41B |
|
||
| Healthcare | 2 | $330B |
|
||
Price history
-0.4% since first listed2 events — show timeline
- 2026-06-05 Price Changed $264,000 CTXMLS
- 2026-04-22 Listed $265,000 CTXMLS
Cash-flow waterfall
monthlySold comps — $/sqft
last 12 mo · ≤1 miLoading sold comps…