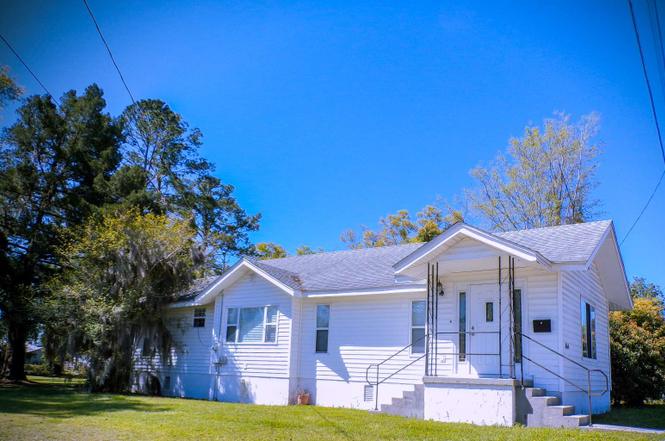
654 SE Baya Dr · Lake City, FL
Flood risk 1/10 · Minimal
- FEMA flood zone
- X (unshaded)
- Chance of flooding over 30 yrs
- 0.0%
- Est. flood insurance / yr
- $507 – $1,088
Fire risk 5/10 · Moderate
- Est. fire insurance / yr
- $947 – $1,759
Heat risk 8/10 · Major
- Hot days now (above 107°F)
- 7 days/yr
- Hot days in 30 yrs
- 21 days/yr
Wind risk 9/10 · Severe
- Chance of severe wind over 30 yrs
- 99.0%
Air-quality risk 5/10 · Moderate
- Unhealthy air days now
- 9 days/yr
- Unhealthy air days in 30 yrs
- 10 days/yr
Risk factors via First Street. Map © Google.
Why this score? — see what drove the C+ grade
The composite is a weighted blend of 9 inputs, each scored 0–100. Each bar is that input's sub-score; the figure is the points it added to the 100-point composite (weight × sub-score).
- Cash flow +17.2/30.0
- ARV discount +10.7/15.0
- Appreciation +10.0/10.0
- DSCR +5.4/10.0
- 1% rule +4.7/10.0
- Schools +4.5/10.0
- Livability +3.7/5.0
- Rent growth +2.5/5.0
- Condition / age +2.5/5.0
$184,500
🖨 Deal sheet 📄 Offer letter ✓ Due diligence
Listing remarks
WORK WHERE YOU LIVE - This 3 bed 1.5 bath home has the comforts of home with a location in the a professional district. The home boast pinewood floors, a large backyard for play or parking, cozy but classic bathroom, and even a handicap ramp. Note: close to the VA and convenient to stores and restaurants. NOTE: AN OFFER HAS BEEN ACCEPTED, BUT TAKING BACKUP OFFERS.
Key facts
- Large backyard
- Pinewood floors
- Convenient to stores
Tags
Property features AI
Exterior
- Parking: 3-car garage
- Utilities: Cable available
- Home design: Residential property; Single-story; Zoned RO
- Construction: Frame construction; Built with standard foundation
- Exterior features: Shingle roof; Shed(s); Irregular lot
Interior
- Kitchen: Electric cooktop; Refrigerator; Microwave
- Flooring: Carpet; Hardwood
- Bathrooms: 1 full bathroom; 1 half bathroom
- Heating & cooling: Central heating (electric); Central air conditioning; Ceiling fan(s)
- Interior features: Insulated windows
Neighborhood map
What this means for you Summary
Snapshot
- This is a 3-bed/1.5-bath single-family listed at $184k.
Deal economics
- At list price, monthly cash flow is $132 ($2k/yr) — positive.
- The deal already cash-flows at list — no discount required.
- To meet the 1% rule (rent ≥ 1% of price), the offer needs to be $178k (3.4% below list).
- Recommended offer: $162k (12.0% below list) — sets the bar for market timing.
- Cap rate 7.2% vs local median 3.7% in Lake City — top-decile yield for the area; either an underpriced asset or a hidden risk that comps aren't pricing in. Stress-test before assuming the spread holds.
Location & tenants
- Location reads 73/100 on livability (#304 in FL) — a middle-class / working-renter tenant base. Strengths: cost of living A+, housing A+, health & safety A+; Watch: amenities C-, commute F, employment F.
- Columbia (town): math 53% / reading 54% proficiency, ranked #25 of 73 in FL (top 34%) — acceptable for families but not a draw, mixed tenant base, ~2y average lease.
- Market conditions: 143 active listings in the ZIP; 178 units permitted in Columbia County in 2024 (0 in 5+ unit buildings).
- This rent runs 39% of the median local income ($55k/yr) — at the standard rent-burdened threshold; future hikes will face affordability resistance.
Forward outlook
- In year one you build about $20k of equity ($1k loan paydown + $18k appreciation (10.0% local appreciation)).
- Columbia County population projected to shrink 7% by 2050 — rents likely to lag national; underwrite the cash flow, not the appreciation.
- At projected returns (10.0% appreciation + 3.0% rent growth), your $52k cash investment doubles in ~3 years — after that, you're playing with house money.
- By year 2, paydown + projected appreciation supports a ~$32k cash-out refi (75% LTV) — recoverable capital for the next deal without selling this one.
Negotiation context
- It's been on market 210 days — a 12% lower offer ($162k) is reasonable based on typical stale-listing flexibility.
- 2 sale attempts; this cycle's ask has dropped $15k (8%) from the opening price — seller is motivated, your offer sets the floor, not the list.
Risks & watch-outs
- Watch-outs: built in 1948 — expect roof / HVAC / electrical / plumbing capex.
- Climate carrying-cost: severe wind risk, 99% chance of damaging wind over 30y; moderate wildfire risk; extreme-heat days projected 7→21/yr by 2055 (HVAC capex compounding) — expect insurance premiums to compound above CPI over the hold.
Questions for the listing agent
- It's been on market 210 days. Have you received any prior offers? Is the seller open to a 12% concession, seller financing, or rate buy-down credit?
- Built in 1948 — when were the roof, HVAC, electrical panel, plumbing, and water heater last replaced?
- Why hasn't it sold? Are there any deal-killer items the seller is aware of (foundation, flood, title, zoning, code violations)?
- Is there a deadline driving the sale (1031 exchange, divorce, estate, relocation)? That informs how much negotiation room exists.
- Schools are B-rated — typically a magnet for longer-tenancy family renters. What's the average tenant stay here, and is there a school-zone premium baked into asking?
- What's the average days-on-market for RENTAL listings here right now (not sales)? A rising rental-DOM trend means longer vacancies and softer asking-rent achievability than the comps imply.
- What's the recent tenant-quality profile in this submarket — average credit score on applications, eviction rate, late-payment / NSF rate, and stable-employment percentage? A property-management company in the area should have these aggregated.
- How much new for-sale + rental construction is in the pipeline within 1–3 miles? Heavy new supply typically softens prices + rents 12–24 months out; constrained supply supports both.
Investment metrics
- 1% rule
- 0.97% ✗
- Cap rate
- 7.15%
- Cash-on-cash
- 3.07%
- DSCR
- 1.14
- GRM
- 8.6
CMA / ARV
- ARV (on-the-fly)
- $198,770
- Comps found
- 12
Show comp detail 12 sales within ~0.75 mi
| Address | Dist | Beds/Ba | Sqft | Sold | Price | $/sf | Match |
|---|---|---|---|---|---|---|---|
| 493 SE Church Ave | 0.27mi | 2/2.0 (-1) | 1,440 (-6%) | 2mo | $187,500 | $130 | 69 |
| 294 SW Columbia Ave | 0.67mi | 3/2.0 | 1,526 (-0%) | 2mo | $225,000 | $147 | 65 |
| 570 SE Sunflower Pl | 0.31mi | 3/2.0 | 1,400 (-8%) | 8mo | $264,500 | $189 | 63 |
| 993 SE Putnam St | 0.40mi | 4/2.0 (+1) | 1,438 (-6%) | 6mo | $165,000 | $115 | 60 |
| 1104 SE Magnolia Loop | 0.47mi | 4/2.0 (+1) | 1,600 (+5%) | 4mo | $245,655 | $154 | 60 |
| 319 SE Avalon Ave | 0.21mi | 3/3.0 | 1,344 (-12%) | 8mo | $174,400 | $130 | 57 |
| 492 SE Lomond Ave | 0.52mi | 3/1.0 | 1,390 (-9%) | 6mo | $112,500 | $81 | 54 |
| 268 NE Anderson Ter | 0.62mi | 3/2.0 | 1,418 (-7%) | 6mo | $125,000 | $88 | 52 |
| 246 SE Lochlynn Ter | 0.46mi | 3/2.0 | 1,340 (-12%) | 6mo | $259,000 | $193 | 51 |
| 384 S Marion Ave | 0.59mi | 3/1.0 | 1,314 (-14%) | 1mo | $148,000 | $113 | 46 |
| 219 SE Hernando Ave | 0.59mi | 3/2.0 | 1,364 (-11%) | 8mo | $100,000 | $73 | 46 |
| 195 SE Emma Pl | 0.70mi | 3/1.5 | 1,748 (+14%) | 4mo | $232,000 | $133 | 40 |
Match score weights: distance 35% · size 25% · config 20% · recency 20%. Top-matched comps best support the ARV.
Projected returns pro-forma
10.0% appreciation · 3.0% rent growth · sell at horizon
- IRR
- 26.5%
- Equity multiple
- 3.11×
- Total profit
- $108,937
- Equity at exit
- $166,212
- IRR
- 23.2%
- Equity multiple
- 7.08×
- Total profit
- $314,228
- Equity at exit
- $358,443
Cash invested: $51,660 (down + closing). Projections, not guarantees.
Landlord ↔ Tenant lean methodology
- Overall (STATE)
- 87 Strongly Landlord-Friendly
- State Florida
- 87 Strongly Landlord-Friendly · R+3
- County
- — inherits STATE
- City
- — inherits STATE
ZIP-level market 32025
- Home prices YoY
- 6.8%
- Active inventory
- 143
- Price-to-rent
- 8.6×
Monthly cashflow live
- Estimated rent
- $1,781 medium interval (Pro) →
- Mortgage (P&I)
- −$968
- Tax est. 1.5%
- −$231 /mo · $2,768/yr
- Insurance
- −$77
- HOA
- −$0
- Vacancy / Maint / Mgmt
- −$374
- Net cashflow
- $132
Break-even live
UW: 25.0% down · 7.5% · 30yr · 1.5% tax · 5.0% vac · 8.0% maint · 8.0% mgmt
Financing live
Cash to close
- Down payment
- $46,125
- Closing costs
- $5,535
- Reserves months
- —
- Total cash needed
- —
Loan-product check · same deal, 3 products live
Conventional
25% down · 7.5% · 30yr
- Down + closing
- —
- Monthly P&I
- —
- Monthly cashflow
- —
- DSCR
- —
- Eligible?
- —
Personal DTI + credit; lowest rate.
DSCR
20% down · 8.5% · 30yr
- Down + closing
- —
- Monthly P&I
- —
- Monthly cashflow
- —
- DSCR
- —
- Eligible?
- —
No personal income docs; deal must DSCR.
Hard money
10% down · 12.0% · 12mo
- Down + closing
- —
- Monthly P&I
- —
- Monthly cashflow
- —
- DSCR
- —
- Eligible?
- —
Short-term bridge; refi at stabilization.
Listing history 20 events
-
2026-06-19days on market $184,500 Active 210 DOM
-
2026-06-18days on market $184,500 Active 209 DOM
-
2026-06-17days on market $184,500 Active 208 DOM
-
2026-06-17remarks 366-char remark
-
2026-06-16days on market $184,500 Active 207 DOM
-
2026-06-15days on market $184,500 Active 206 DOM
-
2026-06-14days on market $184,500 Active 204 DOM
-
2026-06-12days on market $184,500 Active 203 DOM
-
2026-06-09days on market $184,500 Active 200 DOM
-
2026-06-08days on market $184,500 Active 199 DOM
-
2026-06-07pricedays on market $184,500 Active 198 DOM
-
2026-06-05days on market $198,654 Active 195 DOM
-
2026-06-03days on market $198,654 Active 194 DOM
-
2026-06-02days on market $198,654 Active 193 DOM
-
2026-06-01days on market $198,654 Active 192 DOM
-
2026-05-31days on market $198,654 Active 191 DOM
-
2026-05-30days on market $198,654 Active 190 DOM
-
2026-03-30price $198,654
-
2025-11-21$199,654 Active
-
2025-03-19$215,000 Active
ⓘ Source: listings_history table (triggers on properties + properties_extension) + one-shot
backfill from property_details.listing_events for pre-trigger history.
Climate risk First Street
- Flood 1/10 Low FEMA zone X (unshaded) · 0% chance over 30 yrs
- Wildfire 5/10 Major
- Heat 8/10 Severe 7 d/yr ≥107°F today · 21 d/yr by 30 yrs out
- Wind 9/10 Extreme 99% chance of damaging wind over 30 yrs
- Air quality 5/10 Major 9 unhealthy d/yr today · 10 by 30 yrs out
Nearby sold comps map
Loading sold comps map…
Walkable amenities ~0.75 mi
Loading nearby amenities…
Taxation est. · year 1
- Rental income
- $21,377
- − Mortgage interest
- −$10,335
- − Property taxes
- −$2,768
- − Insurance
- −$922
- − Repairs & maintenance
- −$1,710
- − Management
- −$1,710
- − Depreciation
- −$5,367
- Taxable loss
- −$1,435
- Est. tax savings @ 24.0%
- +$344
- After-tax cash flow
- $1,932/yr
For passive investors: Depreciation is non-cash, so a rental often shows a tax loss while cash-flowing — sheltering income. Rental losses are passive: they offset passive income freely, and up to $25,000/yr can offset ordinary (W-2) income if you actively participate and your MAGI is under $100k (phasing out to $0 by $150k); unused losses carry forward. On sale, claimed depreciation is recaptured at up to 25%, and gains may owe capital-gains tax (a 1031 exchange can defer both). Figures are a year-1 estimate at your 24.0% rate — not tax advice; consult a CPA.
Schools (NCES district)
- District
- Columbia
- NCES district ID
- 1200360
- Math proficiency
- 53% ▼ -10.00%
- Reading proficiency
- 54% ▼ -3.00%
- Median HH income
- $40,053
- Composite
- 44.74/100
- National rank
- #2750
- State rank
- #25 of 73 in FL
Livability — Lake City
- Score
- 73/100
- State rank
- #304
- US rank
- #5154
Category grades
Schools grade is shown separately in the Schools card above.
Census & demographics
- Census place
- Lake City, FL
- County
- Columbia County · 40,507 people
- City population
- 40,507
- Metro
- Lake City, FL
- Population (ZIP)
- 22,948
- Household income
- $55,004
- Rent vs Own
- Severe rent burden
- 754.0
Population outlook (Columbia County) Hauer SSP2
- Today (2025)
- 68,129 people
- By 2030
- 67,501 · -0.9%
- By 2040
- 65,465 · -3.9%
- By 2050
- 63,058 · -7.4%
- By 2075
- 56,291 · -17.4%
- By 2100
- 45,243 · -33.6%
Race, ethnicity, and origin ACS 2023
- Neighborhood character
- Predominantly White (67%)
- Race & ethnicity
- White 67% Black 20% Hispanic / Latino 8% Two or more races 7%
- Hispanic origin (detail)
- Mexican 1% Puerto Rican 3% Cuban 1%
- Common ancestry
- Serbian 2% Lithuanian 2% Romanian 2%
- Foreign-born
- 3% · Canada
- Languages at home
- 91% English-only · Spanish 6% French/Haitian/Cajun 2%
Political lean MEDSL · Columbia
- 2024 margin
- Solid R (+50.2) · D 24.6% · R 74.7%
- 2008→2024 swing
- -16.4pp toward R · 2008: -33.8pp · 2024: -50.2pp
- All cycles
- 2024: R+50.2 2020: R+45.2 2016: R+44.5 2012: R+36.7 2008: R+33.8
Not yet ingested
- Civics
- —
Market trends
- HPI YoY
- ▲ 17.57%
- Current HPI
- 276.7253
- Rent YoY
- —
- Metro
- Lake City, FL
- State GDP YoY
- ▲ 3.28%
- F500 in state
- 36
Industry mix (Fortune 500 HQ in FL)
| Industry | F500 HQs | Revenue |
|---|---|---|
| Industrial Technology | 2 | $29B |
|
||
| Insurance | 2 | $17B |
|
||
| Retail | 1 | $60B |
|
||
| Technology Distribution | 1 | $58B |
|
||
| Homebuilding | 1 | $35B |
|
||
| Technology Manufacturing | 1 | $35B |
|
||
Price history
-7.6% since first listed3 events — show timeline
- 2026-03-30 Price Changed $198,654 NFMLS
- 2025-11-21 Listed $199,654 NFMLS
- 2025-03-19 Listed $215,000 NFMLS
Cash-flow waterfall
monthlySold comps — $/sqft
last 12 mo · ≤1 miLoading sold comps…