 Duplex
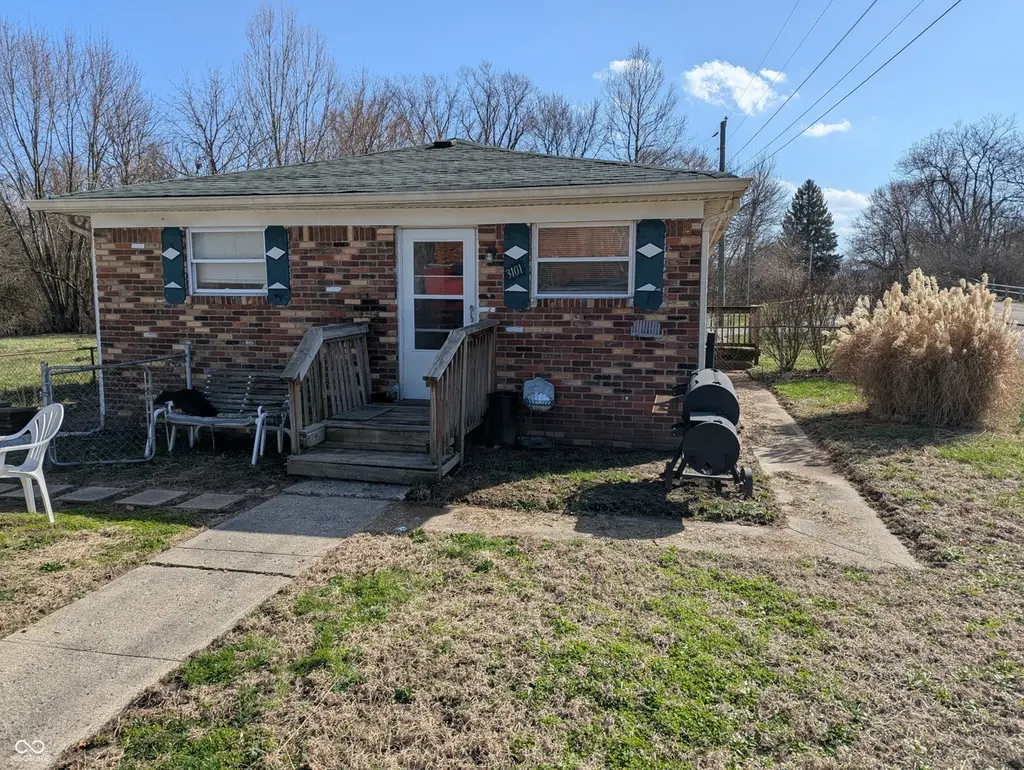
3101 E Bradbury Ave · Indianapolis city (balance), IN
Flood risk 8/10 · Major
- FEMA flood zone
- AE
- Chance of flooding over 30 yrs
- 0.99%
- Est. flood insurance / yr
- $1,737 – $8,500
Fire risk 1/10 · Minimal
- Est. fire insurance / yr
- $717 – $1,331
Heat risk 3/10 · Minor
- Hot days now (above 101°F)
- 7 days/yr
- Hot days in 30 yrs
- 19 days/yr
Wind risk 2/10 · Minimal
- Chance of severe wind over 30 yrs
- 1.0%
Air-quality risk 3/10 · Minor
- Unhealthy air days now
- 2 days/yr
- Unhealthy air days in 30 yrs
- 3 days/yr
Risk factors via First Street. Map © Google.
Why this score? — see what drove the C grade
The composite is a weighted blend of 9 inputs, each scored 0–100. Each bar is that input's sub-score; the figure is the points it added to the 100-point composite (weight × sub-score).
- Cash flow +28.5/30.0
- DSCR +10.0/10.0
- 1% rule +8.1/10.0
- Rent growth +3.2/5.0
- Livability +2.5/5.0
- Condition / age +2.5/5.0
- ARV discount +1.7/15.0
- Schools +1.4/10.0
- Appreciation +0.0/10.0
$175,000
🖨 Deal sheet 📄 Offer letter ✓ Due diligence
Multi-family units
County records classify this as Multi-Family (2-4 Unit). Listing-text estimate: 2 units. confirmed
Listing remarks MLS
Seize the day and take advantage of an excellent opportunity for an investor who wants a nice brick duplex that cash flows! Located just NW of Beech Grove, this rental property has 762 sf of space/unit with 2 BR's and 1 BA on each side. The first unit's address is 2401 S Perkins and is vacant, and newly rehabbed. It features new LVL flooring throughout, fresh paint, new smoke detectors, newly updated bath with new vanity, sink, faucet, new bath faucet for new shower/tub & new surround. The eat-in kitchen is 12 x12 and has a new drop in sink and faucet, LVL flooring. The unit at 3101 is now vacant also and has been cleaned, and painted throughout, has new smoke detectors. The 3101 side needs new flooring (either carpet or LVL in the bedrooms, hall, and living room. It is a mirror floor plan of the other unit. Both sides have gas heat, central air, laundry hookups, private driveways for parking, and storage sheds. Market rent for this property is $1,000/side, so do not miss the chance to get a solid, cash-flowing investment! Tenants will have convenient access to Beech Grove, Fountain Square, and downtown Indy. This affordable property is being sold "as-is".
Key facts
- Newly updated bath
- New lvl flooring
- New vanity
Tags
Neighborhood map
What this means for you Summary
Snapshot
- This is a 2 × 2-bed/1-bath units multifamily listed at $175k.
Deal economics
- At list price, monthly cash flow is $145 ($2k/yr) — positive. Per door: $73/mo.
- The deal already cash-flows at list — no discount required.
- Meets the 1% rule at list price ($2k rent vs $175k).
- Recommended offer: $159k (9.0% below list) — sets the bar for market timing.
- Cap rate 10.2% vs local median 4.4% in Indianapolis city (balance) — top-decile yield for the area; either an underpriced asset or a hidden risk that comps aren't pricing in. Stress-test before assuming the spread holds.
Location & tenants
- Location reads: area grade C — affects rentability + tenant quality, not the cash-flow math above.
- Indianapolis Public Schools (urban): math 14% / reading 20% proficiency, ranked #286 of 301 in IN (top 95%) — low school quality limits family demand, transient renter base, plan for 1-2y turnover; 77% free/reduced lunch — lower-income household profile, screen leases tightly.
- Market conditions: Rents rising (+2.9%/yr); 493 active listings in the ZIP; 37 comparable units currently listed for rent nearby; rentals at typical pace (median 24d on market — plan ~3-4 weeks tenant-placement turnaround); 1,906 units permitted in Marion County in 2024 (621 in 5+ unit buildings).
- At $2,291/mo this rent would consume 48% of the median local household income ($57k/yr) (locally 1499% of renters already pay >50% of income on rent) — very limited rent-growth headroom before tenants either downsize or default.
Forward outlook
- Local home prices are declining (-3.0%/yr); year-one equity from $1k of loan paydown is wiped out by about $5k of value loss. Plan a longer hold.
- Marion County population projected at +18% by 2050 — long-run rental-demand tailwind backs the buy-and-hold thesis.
Negotiation context
- It's been on market 98 days — a 9% lower offer ($159k) is reasonable based on typical stale-listing flexibility.
Risks & watch-outs
- Watch-outs: flood insurance adds $427/mo.
- Climate carrying-cost: in FEMA flood zone AE (mandatory federal flood insurance) — expect insurance premiums to compound above CPI over the hold.
Questions for the listing agent
- It's been on market 98 days. Have you received any prior offers? Is the seller open to a 9% concession, seller financing, or rate buy-down credit?
- Can we see the unit-by-unit rent roll, current vacancy, and any below-market leases? What's the average tenancy length?
- What capital expenditures (roof, boiler, parking lot, exteriors) have been made in the last 5 years, and what's planned in the next 2?
- Built in 1962 — when were the roof, HVAC, electrical panel, plumbing, and water heater last replaced?
- What's the actual annual flood-insurance premium (NFIP or private), and is the property in a SFHA with mandatory coverage?
- Why hasn't it sold? Are there any deal-killer items the seller is aware of (foundation, flood, title, zoning, code violations)?
- Is there a deadline driving the sale (1031 exchange, divorce, estate, relocation)? That informs how much negotiation room exists.
- What's the average days-on-market for RENTAL listings here right now (not sales)? A rising rental-DOM trend means longer vacancies and softer asking-rent achievability than the comps imply.
- What's the recent tenant-quality profile in this submarket — average credit score on applications, eviction rate, late-payment / NSF rate, and stable-employment percentage? A property-management company in the area should have these aggregated.
- How much new apartment / multifamily construction is in the pipeline within 1–3 miles? Heavy new supply (>2% of stock underway) typically softens rents 12–24 months out; light construction supports rent growth.
Investment metrics
- 1% rule
- 1.31% ✓
- Cap rate
- 10.21%
- Cash-on-cash
- 14.00%
- DSCR
- 1.62
- GRM
- 6.4
CMA / ARV
- ARV (median comp)
- $155,036
- List price
- $175,000
- Delta
- 12.88%
- Verdict
- OVERPRICED
- Comps
- 4 within 1.0 mi
Projected returns pro-forma
-3.0% appreciation · 2.88% rent growth · sell at horizon
- IRR
- -10.7%
- Equity multiple
- 0.61×
- Total profit
- $-19,064
- Equity at exit
- $26,093
- IRR
- -1.4%
- Equity multiple
- 0.91×
- Total profit
- $-4,536
- Equity at exit
- $15,131
Cash invested: $49,000 (down + closing). Projections, not guarantees.
Landlord ↔ Tenant lean methodology
- Overall (STATE)
- 90 Strongly Landlord-Friendly
- State Indiana
- 90 Strongly Landlord-Friendly · R+11
- County
- — inherits STATE
- City
- — inherits STATE
ZIP-level market 46203
- Home prices YoY
- -26.7%
- Rents YoY
- 2.9%
- Active inventory
- 493
- Price-to-rent
- 12.7×
Monthly cashflow live
- Estimated rent
- $2,291 medium interval (Pro) →
- Mortgage (P&I)
- −$918
- Tax from tax record
- −$247 /mo · $2,969/yr
- Insurance
- −$73
- Flood insurance flood zone
- −$427 /mo · $5,118/yr
- HOA
- −$0
- Vacancy / Maint / Mgmt
- −$481
- Net cashflow
- $145
Break-even live
2-unit breakdown (identical units grouped — click to expand)
| Units | Beds | Baths | Est. rent |
|---|---|---|---|
| 2× units | 2 | 1 | $2,290 |
| #1 | 2 | 1 | $1,145 |
| #2 | 2 | 1 | $1,145 |
| Total (2 units) | $2,291 | ||
UW: 25.0% down · 7.5% · 30yr · 1.5% tax · 5.0% vac · 8.0% maint · 8.0% mgmt
Financing live
Cash to close
- Down payment
- $43,750
- Closing costs
- $5,250
- Reserves months
- —
- Total cash needed
- —
Loan-product check · same deal, 3 products live
Conventional
25% down · 7.5% · 30yr
- Down + closing
- —
- Monthly P&I
- —
- Monthly cashflow
- —
- DSCR
- —
- Eligible?
- —
Personal DTI + credit; lowest rate.
DSCR
20% down · 8.5% · 30yr
- Down + closing
- —
- Monthly P&I
- —
- Monthly cashflow
- —
- DSCR
- —
- Eligible?
- —
No personal income docs; deal must DSCR.
Hard money
10% down · 12.0% · 12mo
- Down + closing
- —
- Monthly P&I
- —
- Monthly cashflow
- —
- DSCR
- —
- Eligible?
- —
Short-term bridge; refi at stabilization.
Rent comps 37 comps
| Address | Beds | Baths | Sqft | Rent | $/sqft | DOM | Units | Dist |
|---|---|---|---|---|---|---|---|---|
| 2430 E Kelly St Indianapolis, IN | 2.0 | 1.0 | 965 | $949 | $0.98 | 43d | 1 | 0.54mi |
| 2430 Albany St Beech Grove, IN | 2.0 | 1.0 | 800 | $899 | $1.12 | 14d | 1 | 0.65mi |
| 2430 Albany St Apt 01 Beech Grove, IN | 2.0 | 1.0 | 800 | $899 | $1.12 | 7d | 1 | 0.65mi |
| 2315 Bischoff Dr Beech Grove, IN | 2.0 | 1.0 | 1065 | $848 | $0.80 | 23d | 2 | 0.75mi |
| 1730 Perkins Ave Indianapolis, IN | 3.0 | 1.0 | 924 | $1,300 | $1.41 | 23d | 1 | 0.77mi |
| 2633 S Randolph St Unit b Indianapolis, IN | 2.0 | 1.0 | 900 | $995 | $1.11 | 23d | 1 | 0.81mi |
| 2633 S Randolph St Indianapolis, IN | 2.0 | 1.0 | 900 | $995 | $1.11 | 10d | 1 | 0.81mi |
| 3012 E Minnesota St Indianapolis, IN | 2.0 | 1.0 | 875 | $1,000 | $1.14 | 43d | 1 | 0.86mi |
| 3012 E Minnesota St Indianapolis, IN | 2.0 | 1.0 | 767 | $1,000 | $1.30 | 23d | 1 | 0.86mi |
| 2036 Calhoun St Indianapolis, IN | 2.0 | 1.0 | 880 | $1,200 | $1.36 | 7d | 1 | 0.89mi |
| 2469 Dawson St Indianapolis, IN | 2.0 | 1.0 | 700 | $949 | $1.36 | 3d | 4 | 0.89mi |
| 1505 S Rural St Indianapolis, IN | 3.0 | 1.0 | 1104 | $1,500 | $1.36 | 12d | 1 | 0.99mi |
| 3206 S Temple Ave Indianapolis, IN | 2.0 | 1.0 | 784 | $1,080 | $1.38 | 23d | 1 | 1.03mi |
| 1706 E Tabor St Unit 1708 Indianapolis, IN | 3.0 | 1.0 | 1000 | $1,300 | $1.30 | 7d | 1 | 1.05mi |
| 1637 Hoefgen St Indianapolis, IN | 2.0 | 1.0 | 780 | $1,000 | $1.28 | 43d | 1 | 1.07mi |
| 1815 Dawson St Unit 1815 Indianapolis, IN | 2.0 | 1.0 | 1019 | $999 | $0.98 | 14d | 1 | 1.15mi |
| 3518 Terrace Ave Indianapolis, IN | 3.0 | 1.0 | 864 | $1,300 | $1.50 | 43d | 1 | 1.15mi |
| 1727 S Randolph St Indianapolis, IN | 1.0 | 1.0 | 616 | $950 | $1.54 | 43d | 1 | 1.15mi |
| 1604 E Kelly St Indianapolis, IN | 2.0 | 1.0 | 800 | $1,025 | $1.28 | 10d | 1 | 1.16mi |
| 1604 E Kelly St Indianapolis, IN | 2.0 | 1.0 | 750 | $1,025 | $1.37 | 17d | 1 | 1.16mi |
| 1549 Nelson Ave Indianapolis, IN | 3.0 | 1.0 | 950 | $1,380 | $1.45 | 43d | 1 | 1.21mi |
| 1640 Asbury St Indianapolis, IN | 1.0 | 1.0 | 700 | $850 | $1.21 | 43d | 1 | 1.31mi |
| 3146 Asbury St Indianapolis, IN | 2.0 | 1.0 | 728 | $850 | $1.17 | 7d | 1 | 1.32mi |
| 1409 E Tabor St Indianapolis, IN | 1.0 | 1.0 | 528 | $775 | $1.47 | 23d | 1 | 1.32mi |
| 68 N 7th Ave #2 Beech Grove, IN | 1.0 | 1.0 | 600 | $825 | $1.38 | 43d | 1 | 1.32mi |
| 1534 Dawson St Indianapolis, IN | 3.0 | 1.0 | 1040 | $1,499 | $1.44 | 23d | 1 | 1.33mi |
| 1637 S State Ave Indianapolis, IN | 2.0 | 1.5 | 816 | $900 | $1.10 | 17d | 1 | 1.34mi |
| 3441 Prospect St Indianapolis, IN | 2.0 | 1.0 | 1008 | $1,700 | $1.69 | 44d | 1 | 1.35mi |
| 3441 Prospect St Indianapolis, IN | 2.0 | 1.0 | 1008 | $1,500 | $1.49 | 23d | 1 | 1.35mi |
| 1503 Dawson St Indianapolis, IN | 2.0 | 1.0 | 700 | $1,200 | $1.71 | 43d | 1 | 1.36mi |
| 64 N 6th Ave Apt 2 Beech Grove, IN | 1.0 | 1.0 | 550 | $825 | $1.50 | 12d | 1 | 1.38mi |
| 1543 S State Ave Indianapolis, IN | 2.0 | 1.0 | 1086 | $1,100 | $1.01 | 7d | 1 | 1.39mi |
| 108 S 8th Ave Beech Grove, IN | 2.0 | 1.5 | 816 | $1,225 | $1.50 | 10d | 1 | 1.40mi |
| 80 N 5th Ave Beech Grove, IN | 2.0 | 2.0 | 900 | $1,150 | $1.28 | 7d | 1 | 1.42mi |
| 82 N 5th Ave Beech Grove, IN | 2.0 | 2.0 | 900 | $1,295 | $1.44 | 43d | 1 | 1.42mi |
| 1026 Laurel St Indianapolis, IN | 1.0 | 1.0 | 655 | $860 | $1.31 | 43d | 1 | 1.43mi |
| 1620 E Palmer St Indianapolis, IN | 2.0 | 1.0 | 824 | $1,200 | $1.46 | 23d | 1 | 1.44mi |
Listing history 15 events
-
2026-06-18days on market $175,000 Active 98 DOM
-
2026-06-17days on market $175,000 Active 97 DOM
-
2026-06-16days on market $175,000 Active 96 DOM
-
2026-06-15days on market $175,000 Active 95 DOM
-
2026-06-13days on market $175,000 Active 93 DOM
-
2026-06-13days on market $175,000 Active 92 DOM
-
2026-06-09days on market $175,000 Active 89 DOM
-
2026-06-08days on market $175,000 Active 88 DOM
-
2026-06-07days on market $175,000 Active 87 DOM
-
2026-06-03days on market $175,000 Active 83 DOM
-
2026-06-02days on market $175,000 Active 82 DOM
-
2026-06-01days on market $175,000 Active 81 DOM
-
2026-05-31days on market $175,000 Active 80 DOM
-
2026-05-18price $175,000 1198-char remark
Show marketing remark (1198 chars)
Seize the day and take advantage of an excellent opportunity for an investor who wants a nice brick duplex that cash flows! Located just NW of Beech Grove, this rental property has 762 sf of space/unit with 2 BR's and 1 BA on each side. The first unit's address is 2401 S Perkins and is vacant, and newly rehabbed. It features new LVL flooring throughout, fresh paint, new smoke detectors, newly updated bath with new vanity, sink, faucet, new bath faucet for new shower/tub & new surround. The eat-in kitchen is 12 x12 and has a new drop in sink and faucet, LVL flooring. The unit at 3101 is now vacant also and has been cleaned, and painted throughout, has new smoke detectors. The 3101 side needs new flooring (either carpet or LVL in the bedrooms, hall, and living room. It is a mirror floor plan of the other unit. Both sides have gas heat, central air, laundry hookups, private driveways for parking, and storage sheds. Market rent for this property is $1,000/side, so do not miss the chance to get a solid, cash-flowing investment! Tenants will have convenient access to Beech Grove, Fountain Square, and downtown Indy. This affordable property is being sold "as-is".
-
2026-03-13$182,000 Active 1198-char remark
Show marketing remark (1198 chars)
Seize the day and take advantage of an excellent opportunity for an investor who wants a nice brick duplex that cash flows! Located just NW of Beech Grove, this rental property has 762 sf of space/unit with 2 BR's and 1 BA on each side. The first unit's address is 2401 S Perkins and is vacant, and newly rehabbed. It features new LVL flooring throughout, fresh paint, new smoke detectors, newly updated bath with new vanity, sink, faucet, new bath faucet for new shower/tub & new surround. The eat-in kitchen is 12 x12 and has a new drop in sink and faucet, LVL flooring. The unit at 3101 is now vacant also and has been cleaned, and painted throughout, has new smoke detectors. The 3101 side needs new flooring (either carpet or LVL in the bedrooms, hall, and living room. It is a mirror floor plan of the other unit. Both sides have gas heat, central air, laundry hookups, private driveways for parking, and storage sheds. Market rent for this property is $1,000/side, so do not miss the chance to get a solid, cash-flowing investment! Tenants will have convenient access to Beech Grove, Fountain Square, and downtown Indy. This affordable property is being sold "as-is".
ⓘ Source: listings_history table (triggers on properties + properties_extension) + one-shot
backfill from property_details.listing_events for pre-trigger history.
Tax reassessment forecast IN · Partial reset (capped growth)
- Current annual tax
- $2,969 · $247/mo
- Projected year-2 tax
- $2,969 · $247/mo
- Expected delta
- $0/yr ($0/mo · 0.0%)
ⓘ Screening estimate from a state-policy table — verify with the county assessor before closing.
Climate risk First Street
- Flood 8/10 Severe FEMA zone AE · 99% chance over 30 yrs
- Wildfire 1/10 Low
- Heat 3/10 Moderate 7 d/yr ≥101°F today · 19 d/yr by 30 yrs out
- Wind 2/10 Low 100% chance of damaging wind over 30 yrs
- Air quality 3/10 Moderate 2 unhealthy d/yr today · 3 by 30 yrs out
Nearby sold comps map
Loading sold comps map…
Walkable amenities ~0.75 mi
Loading nearby amenities…
Taxation est. · year 1
- Rental income
- $27,492
- − Mortgage interest
- −$9,803
- − Property taxes
- −$2,969
- − Insurance
- −$5,994
- − Repairs & maintenance
- −$2,199
- − Management
- −$2,199
- − Depreciation
- −$5,091
- Taxable loss
- −$763
- Est. tax savings @ 24.0%
- +$183
- After-tax cash flow
- $1,927/yr
For passive investors: Depreciation is non-cash, so a rental often shows a tax loss while cash-flowing — sheltering income. Rental losses are passive: they offset passive income freely, and up to $25,000/yr can offset ordinary (W-2) income if you actively participate and your MAGI is under $100k (phasing out to $0 by $150k); unused losses carry forward. On sale, claimed depreciation is recaptured at up to 25%, and gains may owe capital-gains tax (a 1031 exchange can defer both). Figures are a year-1 estimate at your 24.0% rate — not tax advice; consult a CPA.
Schools (NCES district)
- District
- Indianapolis Public Schools
- NCES district ID
- 1804770
- Math proficiency
- 14% ▼ -7.00%
- Reading proficiency
- 20% ▼ -3.00%
- Median HH income
- $32,034
- Composite
- 13.69/100
- National rank
- #9499
- State rank
- #286 of 301 in IN
Livability — Indianapolis city (balance)
No livability data for this city. (Only ~50 U.S. cities are tracked.)
Census & demographics
- Census place
- Indianapolis city (balance), IN
- County
- Marion County · 998,460 people
- City population
- 881,119
- Metro
- Indianapolis-Carmel-Anderson, IN
- Population (ZIP)
- 37,758
- Household income
- $57,393
- Rent vs Own
- Severe rent burden
- 1499.0
Population outlook (Marion County) Hauer SSP2
- Today (2025)
- 1,025,572 people
- By 2030
- 1,065,727 · +3.9%
- By 2040
- 1,141,577 · +11.3%
- By 2050
- 1,208,920 · +17.9%
- By 2075
- 1,367,288 · +33.3%
- By 2100
- 1,438,201 · +40.2%
Race, ethnicity, and origin ACS 2023
- Neighborhood character
- Predominantly White (69%)
- Race & ethnicity
- White 69% Hispanic / Latino 14% Black 12% Two or more races 8% Asian 2% Native American 1%
- Hispanic origin (detail)
- Mexican 12% Puerto Rican 1%
- Common ancestry
- Slovak 2% Lithuanian 2% Italian 1%
- Foreign-born
- 8% · Canada
- Languages at home
- 88% English-only · Spanish 10% Other Indo-European 1%
Political lean MEDSL · Marion
- 2024 margin
- Strong D (+27.7) · D 63.0% · R 35.3% · Other 1.7%
- 2008→2024 swing
- -0.7pp no change · 2008: 28.4pp · 2024: 27.7pp
- All cycles
- 2024: D+27.7 2020: D+29.1 2016: D+22.8 2012: D+22.2 2008: D+28.4
Not yet ingested
- Civics
- —
Market trends
- HPI YoY
- ▼ -127.37%
- Current HPI
- 349.579
- Rent YoY
- ▲ 2.88%
- Metro
- Indianapolis-Carmel-Anderson, IN
- State GDP YoY
- ▲ 2.90%
- F500 in state
- 18
Industry mix (Fortune 500 HQ in IN)
| Industry | F500 HQs | Revenue |
|---|---|---|
| Industrial Machinery | 2 | $37B |
|
||
| Healthcare | 1 | $177B |
|
||
| Pharmaceuticals | 1 | $45B |
|
||
| Metals / Steel | 1 | $18B |
|
||
| Agriculture | 1 | $17B |
|
||
| Packaging | 1 | $12B |
|
||
Price history
-3.8% since first listed2 events — show timeline
- 2026-05-18 Price Changed $175,000 MIBOR as Distributed by MLS Grid
- 2026-03-13 Listed $182,000 MIBOR as Distributed by MLS Grid
Property tax history
+8.9%/yrLatest (2025): $2,969 · +37.6% YoY. Source: county tax records.
Cash-flow waterfall
monthlySold comps — $/sqft
last 12 mo · ≤1 miLoading sold comps…