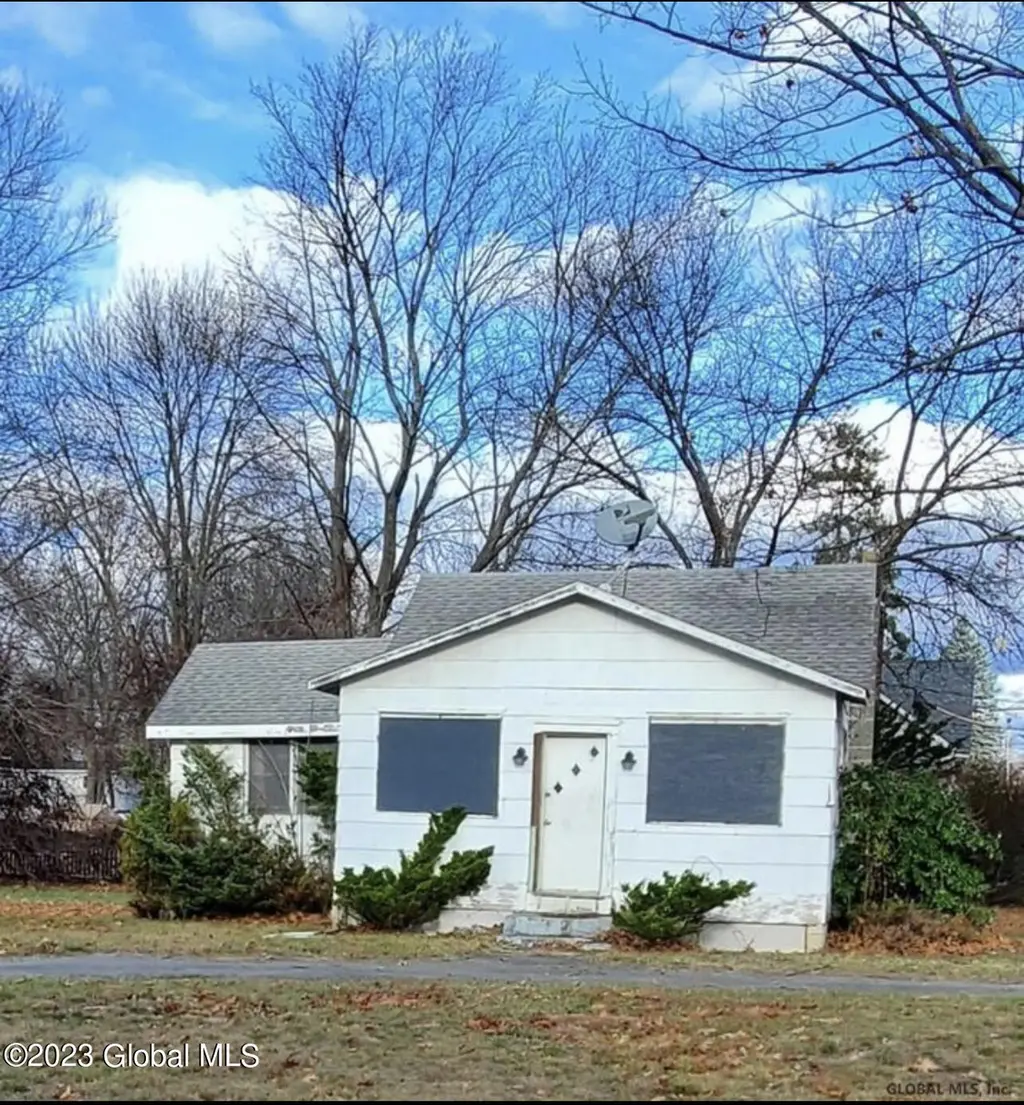
3323 Mcdonald Ave · Schenectady, NY
Flood risk 6/10 · Moderate
- FEMA flood zone
- X (unshaded)
- Chance of flooding over 30 yrs
- 0.74%
- Est. flood insurance / yr
- $473 – $860
Fire risk 1/10 · Minimal
- Est. fire insurance / yr
- $691 – $1,283
Heat risk 3/10 · Minor
- Hot days now (above 96°F)
- 7 days/yr
- Hot days in 30 yrs
- 16 days/yr
Wind risk 3/10 · Minor
- Chance of severe wind over 30 yrs
- 5.0%
Air-quality risk 1/10 · Minimal
- Unhealthy air days now
- 0 days/yr
- Unhealthy air days in 30 yrs
- 0 days/yr
Risk factors via First Street. Map © Google.
Why this score? — see what drove the D grade
The composite is a weighted blend of 9 inputs, each scored 0–100. Each bar is that input's sub-score; the figure is the points it added to the 100-point composite (weight × sub-score).
- Cash flow +15.0/30.0
- ARV discount +7.5/15.0
- 1% rule +5.0/10.0
- DSCR +5.0/10.0
- Livability +3.9/5.0
- Schools +3.0/10.0
- Rent growth +2.5/5.0
- Condition / age +2.5/5.0
- Appreciation +0.0/10.0
$39,990
🖨 Deal sheet (PDF) 📄 Offer letter ✓ Due diligence
Listing remarks MLS
Schenectady City owned property, code estimate $29,500. Great cozy home with a huge lot.
Key facts
- 0.39 acre lot
- 4 parking spots
- Built 1950
Neighborhood map
What this means for you Summary
Snapshot
- This is a 2-bed/1.0-bath single-family listed at $40k.
Deal economics
- At list price, monthly cash flow is $1k ($13k/yr) — positive.
- The deal already cash-flows at list — no discount required.
- Meets the 1% rule at list price ($2k rent vs $40k).
- Recommended offer: $35k (12.0% below list) — sets the bar for market timing.
- Cap rate 38.0% vs local median 6.3% in Schenectady — top-decile yield for the area; either an underpriced asset or a hidden risk that comps aren't pricing in. Stress-test before assuming the spread holds.
Location & tenants
- Location reads 78/100 on livability (#167 in NY, #2,597 nationally) — a middle-class / working-renter tenant base. Strengths: commute A+, health & safety A+, cost of living A; Watch: employment D+, crime F.
- Schenectady City School District (urban): math 38% / reading 34% proficiency, ranked #556 of 590 in NY (top 94%) — families likely to look elsewhere, expect single-tenant / working-renter base with shorter leases; 65% free/reduced lunch — lower-income household profile, screen leases tightly.
- Zoned schools: Schenectady High School (math 75% / reading 90%, grade A, #446 of 1,100 statewide, top 41%, 2,743 students, 71% FRL).
- Zoned-school proficiency averages 82% at this address vs 36% district-wide (+46 pts) — the actual schools serving this property are materially stronger than the Schenectady City School District average implies; a family-tenant draw the district grade alone would hide.
- Market conditions: 106 active listings in the ZIP; 4 comparable units currently listed for rent nearby; rentals at typical pace (median 15d on market — plan ~3-4 weeks tenant-placement turnaround); 154 units permitted in Schenectady County in 2024 (54 in 5+ unit buildings).
Forward outlook
- Local home prices are declining (-3.0%/yr); year-one equity from $276 of loan paydown is wiped out by about $1k of value loss. Plan a longer hold.
- Schenectady County population projected to shrink 4% by 2050 — rents likely to lag national; underwrite the cash flow, not the appreciation.
- At projected returns (-3.0% appreciation + 3.0% rent growth), your $11k cash investment doubles in ~1 year — after that, you're playing with house money.
Negotiation context
- It's been on market 140 days — a 12% lower offer ($35k) is reasonable based on typical stale-listing flexibility.
- 4 sale attempts since 6y ago with the ask held roughly flat each time — persistent listings suggest the price (not the market) is what's stuck; bring a comps-based counter.
Risks & watch-outs
- Watch-outs: built in 1950 — expect roof / HVAC / electrical / plumbing capex.
- Climate carrying-cost: major flood risk — expect insurance premiums to compound above CPI over the hold.
Questions for the listing agent
- It's been on market 140 days. Have you received any prior offers? Is the seller open to a 12% concession, seller financing, or rate buy-down credit?
- Built in 1950 — when were the roof, HVAC, electrical panel, plumbing, and water heater last replaced?
- Why hasn't it sold? Are there any deal-killer items the seller is aware of (foundation, flood, title, zoning, code violations)?
- Is there a deadline driving the sale (1031 exchange, divorce, estate, relocation)? That informs how much negotiation room exists.
- Crime grade is F in this area — have there been break-ins, vandalism, or insurance claims at this property in the last 3 years? What carrier currently insures it and at what premium?
- The area grade is low — what's the realistic commute time and amenity access for the typical tenant pool here? Any planned neighborhood developments (good or bad) we should know about?
- What's the average days-on-market for RENTAL listings here right now (not sales)? A rising rental-DOM trend means longer vacancies and softer asking-rent achievability than the comps imply.
- What's the recent tenant-quality profile in this submarket — average credit score on applications, eviction rate, late-payment / NSF rate, and stable-employment percentage? A property-management company in the area should have these aggregated.
- How much new for-sale + rental construction is in the pipeline within 1–3 miles? Heavy new supply typically softens prices + rents 12–24 months out; constrained supply supports both.
Investment metrics
- 1% rule
- 4.22% ✓
- Cap rate
- 38.03%
- Cash-on-cash
- 113.33%
- DSCR
- 6.04
- GRM
- 2.0
CMA / ARV
- ARV (on-the-fly)
- $181,139
- Comps found
- 11
Show comp detail 11 sales within ~0.75 mi
| Address | Dist | Beds/Ba | Sqft | Sold | Price | $/sf | Match |
|---|---|---|---|---|---|---|---|
| 435 Gifford Rd | 0.15mi | 3/1.0 (+1) | 864 (+9%) | 2mo | $139,999 | $162 | 71 |
| 477 Bradford Rd | 0.32mi | 2/1.0 | 840 (+6%) | 6mo | $215,000 | $256 | 70 |
| 3342 Mcdonald Ave | 0.05mi | 3/1.0 (+1) | 864 (+9%) | 10mo | $181,000 | $209 | 69 |
| 247 Chiswell Rd | 0.40mi | 2/1.0 | 875 (+11%) | 2mo | $221,500 | $253 | 62 |
| 428 Manchester Rd | 0.18mi | 2/1.5 | 870 (+10%) | 21mo | $175,500 | $202 | 56 |
| 3312 Maryvale Dr | 0.32mi | 2/1.0 | 864 (+9%) | 19mo | $211,000 | $244 | 54 |
| 3269 Maryvale Dr | 0.37mi | 2/1.5 | 896 (+13%) | 14mo | $217,000 | $242 | 47 |
| 309 Chiswell Rd | 0.36mi | 3/1.0 (+1) | 875 (+11%) | 18mo | $200,000 | $229 | 46 |
| 2016 State St | 0.70mi | 3/1.0 (+1) | 864 (+9%) | 2mo | $80,000 | $93 | 46 |
| 309 Manchester Rd | 0.33mi | 2/1.0 | 676 (-14%) | 22mo | $182,000 | $269 | 42 |
| 3078 Albany St | 0.63mi | 2/1.5 | 894 (+13%) | 16mo | $190,000 | $213 | 34 |
Match score weights: distance 35% · size 25% · config 20% · recency 20%. Top-matched comps best support the ARV.
Projected returns pro-forma
-3.0% appreciation · 3.0% rent growth · sell at horizon
- IRR
- —
- Equity multiple
- 6.44×
- Total profit
- $60,898
- Equity at exit
- $5,963
- IRR
- —
- Equity multiple
- 13.49×
- Total profit
- $139,861
- Equity at exit
- $3,458
Cash invested: $11,197 (down + closing). Projections, not guarantees.
Landlord ↔ Tenant lean methodology
- Overall (STATE)
- 15 Strongly Tenant-Friendly
- State New York
- 15 Strongly Tenant-Friendly · D+10
- County
- — inherits STATE
- City
- — inherits STATE
ZIP-level market 12304
- Home prices YoY
- -25.5%
- Active inventory
- 106
- Price-to-rent
- 2.0×
Monthly cashflow live
- Estimated rent
- $1,688 medium interval (Pro) →
- Mortgage (P&I)
- −$210
- Tax est. 1.5%
- −$50 /mo · $600/yr
- Insurance
- −$17
- HOA
- −$0
- Vacancy / Maint / Mgmt
- −$355
- Net cashflow
- $1,058
Break-even live
Sensitivity live
| Price | -10% $1,085 | -5% $1,071 | +0% $1,058 | +5% $1,044 | +10% $1,030 |
|---|---|---|---|---|---|
| Rent | -10% $924 | -5% $991 | +0% $1,058 | +5% $1,124 | +10% $1,191 |
| Rate | -1.0pp $1,078 | -0.5pp $1,068 | base $1,058 | +0.5pp $1,047 | +1.0pp $1,037 |
UW: 25.0% down · 7.5% · 30yr · 1.5% tax · 5.0% vac · 8.0% maint · 8.0% mgmt
Financing live
Cash to close
- Down payment
- $9,998
- Closing costs
- $1,200
- Reserves months
- —
- Total cash needed
- —
Loan-product check · same deal, 3 products live
Conventional
25% down · 7.5% · 30yr
- Down + closing
- —
- Monthly P&I
- —
- Monthly cashflow
- —
- DSCR
- —
- Eligible?
- —
Personal DTI + credit; lowest rate.
DSCR
20% down · 8.5% · 30yr
- Down + closing
- —
- Monthly P&I
- —
- Monthly cashflow
- —
- DSCR
- —
- Eligible?
- —
No personal income docs; deal must DSCR.
Hard money
10% down · 12.0% · 12mo
- Down + closing
- —
- Monthly P&I
- —
- Monthly cashflow
- —
- DSCR
- —
- Eligible?
- —
Short-term bridge; refi at stabilization.
Rent comps 4 comps
| Address | Beds | Baths | Sqft | Rent | $/sqft | DOM | Units | Dist |
|---|---|---|---|---|---|---|---|---|
| 4208 Court Royale Schenectady, NY | 2.0 | 1.0 | 860 | $1,590 | $1.85 | 14d | 1 | 0.42mi |
| 4219 Menga Dr Schenectady, NY | 2.0 | 1.0 | 865 | $1,775 | $2.05 | 15d | 1 | 0.48mi |
| 66 Cordell Rd Schenectady, NY | 2.0 | 1.0 | 744 | $1,900 | $2.55 | 44d | 1 | 0.78mi |
| 103 Kings Rd Unit 106 Schenectady, NY | 2.0 | 2.0 | 1100 | $1,450 | $1.32 | 15d | 1 | 0.84mi |
Listing history 9 events
-
2023-12-06status Pending
-
2023-11-17status Active
-
2023-10-03status Pending
-
2023-06-01$39,990 Active
-
2023-05-19historical
-
2023-01-31$100,000 Active
-
2021-05-06soldstatus $38,000 Closed (Final Sale) 88-char remark
Show marketing remark (88 chars)
Schenectady City owned property, code estimate $29,500. Great cozy home with a huge lot.
-
2021-03-19status Pend (Under Cntr) 88-char remark
Show marketing remark (88 chars)
Schenectady City owned property, code estimate $29,500. Great cozy home with a huge lot.
-
2020-11-25$50,000 New 88-char remark
Show marketing remark (88 chars)
Schenectady City owned property, code estimate $29,500. Great cozy home with a huge lot.
ⓘ Source: listings_history table (triggers on properties + properties_extension) + one-shot
backfill from property_details.listing_events for pre-trigger history.
Climate risk First Street
- Flood 6/10 Major FEMA zone X (unshaded) · 74% chance over 30 yrs
- Wildfire 1/10 Low
- Heat 3/10 Moderate 7 d/yr ≥96°F today · 16 d/yr by 30 yrs out
- Wind 3/10 Moderate 5% chance of damaging wind over 30 yrs
- Air quality 1/10 Low 0 unhealthy d/yr today · 0 by 30 yrs out
Nearby sold comps map
Loading sold comps map…
Walkable amenities ~0.75 mi
Loading nearby amenities…
Taxation est. · year 1
- Rental income
- $20,261
- − Mortgage interest
- −$2,240
- − Property taxes
- −$600
- − Insurance
- −$200
- − Repairs & maintenance
- −$1,621
- − Management
- −$1,621
- − Depreciation
- −$1,163
- Taxable income
- $12,816
- Est. tax owed @ 24.0%
- −$3,076
- After-tax cash flow
- $9,614/yr
For passive investors: Depreciation is non-cash, so a rental often shows a tax loss while cash-flowing — sheltering income. Rental losses are passive: they offset passive income freely, and up to $25,000/yr can offset ordinary (W-2) income if you actively participate and your MAGI is under $100k (phasing out to $0 by $150k); unused losses carry forward. On sale, claimed depreciation is recaptured at up to 25%, and gains may owe capital-gains tax (a 1031 exchange can defer both). Figures are a year-1 estimate at your 24.0% rate — not tax advice; consult a CPA.
Schools (NCES district)
- District
- Schenectady City School District
- NCES district ID
- 3626010
- Math proficiency
- 38% ▲ 12.00%
- Reading proficiency
- 34% ▲ 2.00%
- Median HH income
- $39,453
- Composite
- 30.2/100
- National rank
- #6309
- State rank
- #556 of 590 in NY
Livability — Schenectady
- Score
- 78/100
- State rank
- #167
- US rank
- #2597
Category grades
Schools grade is shown separately in the Schools card above.
Census & demographics
- Census place
- Schenectady, NY
- City population
- 141,369
- Population (ZIP)
- 22,027
Population outlook (Schenectady County) Hauer SSP2
- Today (2025)
- 155,046 people
- By 2030
- 154,322 · -0.5%
- By 2040
- 151,796 · -2.1%
- By 2050
- 148,621 · -4.1%
- By 2075
- 141,229 · -8.9%
- By 2100
- 126,014 · -18.7%
Race, ethnicity, and origin ACS 2023
- Neighborhood character
- Diverse neighborhood (Simpson 0.68)
- Race & ethnicity
- White 52% Black 17% Two or more races 13% Asian 10% Hispanic / Latino 9%
- Hispanic origin (detail)
- Mexican 2% Puerto Rican 3% Dominican 2%
- Common ancestry
- Lithuanian 6% Romanian 4% Iranian 1%
- Foreign-born
- 16% · Canada, China, South Korea
- Languages at home
- 89% English-only · Other Indo-European 5% Spanish 4% Other Asian/Pacific 1%
Political lean MEDSL · Schenectady
- 2024 margin
- D (+10.8) · D 55.4% · R 44.6%
- 2008→2024 swing
- -1.8pp toward R · 2008: 12.7pp · 2024: 10.8pp
- All cycles
- 2024: D+10.8 2020: D+15.7 2016: D+5.8 2012: D+15.4 2008: D+12.7
Not yet ingested
- Civics
- —
Market trends
- HPI YoY
- ▼ -113.18%
- Current HPI
- 331.0288
- Rent YoY
- —
- Metro
- —
- State GDP YoY
- ▲ 2.60%
- F500 in state
- 92
Industry mix (Fortune 500 HQ in NY)
| Industry | F500 HQs | Revenue |
|---|---|---|
| Financial Services | 10 | $950B |
|
||
| Consumer Goods | 9 | $162B |
|
||
| Insurance | 4 | $225B |
|
||
| Telecommunications | 2 | $144B |
|
||
| Pharmaceuticals | 2 | $112B |
|
||
| Media / Entertainment | 2 | $69B |
|
||
Price history
-20.0% since first listed9 events — show timeline
- 2023-12-06 Pending — Global MLS
- 2023-11-17 Relisted — Global MLS
- 2023-10-03 Pending — Global MLS
- 2023-06-01 Listed $39,990 Global MLS
- 2023-05-19 Listing Removed — Global MLS
- 2023-01-31 Listed $100,000 Global MLS
- 2021-05-06 Sold (MLS) $38,000 Global MLS
- 2021-03-19 Pending — Global MLS
- 2020-11-25 Listed $50,000 Global MLS
Property tax history
-0.0%/yrLatest (2025): $5,418 · -30.5% YoY. Source: county tax records.
Cash-flow waterfall
monthlySold comps — $/sqft
last 12 mo · ≤1 miLoading sold comps…