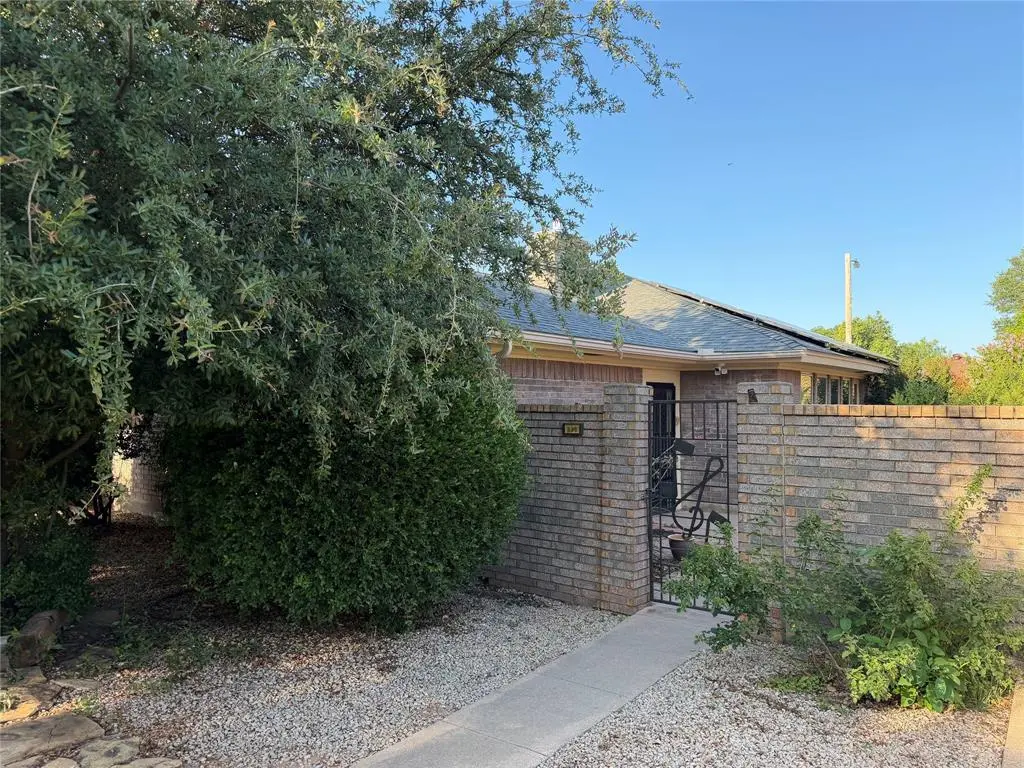
909 Ruswood Cir · Abilene, TX
Flood risk 1/10 · Minimal
- FEMA flood zone
- X (unshaded)
- Chance of flooding over 30 yrs
- 0.0%
- Est. flood insurance / yr
- $507 – $1,088
Fire risk 7/10 · Major
- Est. fire insurance / yr
- $1,222 – $2,270
Heat risk 7/10 · Major
- Hot days now (above 104°F)
- 7 days/yr
- Hot days in 30 yrs
- 24 days/yr
Wind risk 4/10 · Minor
- Chance of severe wind over 30 yrs
- 11.0%
Air-quality risk 1/10 · Minimal
- Unhealthy air days now
- 0 days/yr
- Unhealthy air days in 30 yrs
- 0 days/yr
Risk factors via First Street. Map © Google.
Why this score? — see what drove the C- grade
The composite is a weighted blend of 9 inputs, each scored 0–100. Each bar is that input's sub-score; the figure is the points it added to the 100-point composite (weight × sub-score).
- Cash flow +18.6/30.0
- ARV discount +9.9/15.0
- 1% rule +5.8/10.0
- DSCR +5.8/10.0
- Rent growth +5.0/5.0
- Livability +3.8/5.0
- Schools +2.8/10.0
- Condition / age +2.5/5.0
- Appreciation +0.0/10.0
$249,900
🖨 Deal sheet 📄 Offer letter ✓ Due diligence
Listing remarks MLS
Patio home with great location near ACU, HSU or Hendricks. Brand new carpet & fresh paint throughout. Grand living area with fireplace, built ins, vaulted ceiling + perfect den - wall of storage & shelves added in 1996. Corian counters in kitchen + new kitchen flooring. Atrium for your green thumb! This is a detached home (no adjoining walls) built to lot line on one side.
Key facts
- 6,534 sq ft lot
- 2 garage spots
- Built 1981
Property features AI
Finance
- Other: Property listed as residential single-family; Subdivision: Radford Hills; County: Taylor; Listing terms: Cash or Conventional; Possession at closing/funding
- Financial info: Treat as clear loan type; No second mortgage
- HOA & community: No association
Exterior
- Parking: Attached 2-car garage; 2 covered parking spaces; Garage faces rear
- Security: Audio and video consent for visitors to record; Audio and video surveillance devices present (notice)
- Utilities: City water; City sewer
- Home design: Single-family residence; One level
- Construction: Brick construction; Built in 1981
- Exterior features: Alley access; Asphalt access
Interior
- Kitchen: Dishwasher; Eat-in kitchen
- Bedrooms: Primary bedroom on first floor; Total of 3 bedrooms
- Bathrooms: Two full bathrooms
- Heating & cooling: No smart home features reported
- Interior features: Built-in features; Cable TV available; Eat-in kitchen; High-speed internet available; Two living areas; One dining area; Two total rooms (listed)
Neighborhood map
What this means for you Summary
Snapshot
- This is a 3-bed/2.0-bath single-family listed at $250k.
Deal economics
- At list price, monthly cash flow is $242 ($3k/yr) — positive.
- The deal already cash-flows at list — no discount required.
- Meets the 1% rule at list price ($3k rent vs $250k).
Location & tenants
- Location reads 75/100 on livability (#142 in TX, #4,037 nationally) — a middle-class / working-renter tenant base. Strengths: cost of living A+, housing A+, health & safety A+; Watch: crime D, commute F.
- Abilene ISD (urban): math 32% / reading 34% proficiency, ranked #575 of 826 in TX (top 70%) — families likely to look elsewhere, expect single-tenant / working-renter base with shorter leases.
- Zoned schools: Taylor El (math 32% / reading 44%, grade F, #1,709 of 4,322 statewide, top 40%, 658 students, 66% FRL).
- Market conditions: Rents rising fast (+43.4%/yr); 195 active listings in the ZIP; 4 comparable units currently listed for rent nearby; rentals lingering (median 44d on market — plan ~5-8 weeks vacancy on turnover, expect pricing pressure); 50% of comp listings sitting > 30 days — soft ceiling on asking rent; 508 units permitted in Taylor County in 2024 (0 in 5+ unit buildings).
- At $2,691/mo this rent would consume 60% of the median local household income ($54k/yr) (locally 1240% of renters already pay >50% of income on rent) — very limited rent-growth headroom before tenants either downsize or default.
Forward outlook
- Local home prices are declining (-3.0%/yr); year-one equity from $2k of loan paydown is wiped out by about $7k of value loss. Plan a longer hold.
- Taylor County population projected at +16% by 2050 — long-run rental-demand tailwind backs the buy-and-hold thesis.
- At projected returns (-3.0% appreciation + 8.0% rent growth), your $70k cash investment doubles in ~9 years — after that, you're playing with house money.
Negotiation context
- Only 1 days on market — expect competitive offers; lowballing is unlikely to land.
- 3 sale attempts since 17y ago with the ask held roughly flat each time — persistent listings suggest the price (not the market) is what's stuck; bring a comps-based counter.
Risks & watch-outs
- Climate carrying-cost: major wildfire risk; extreme-heat days projected 7→24/yr by 2055 (HVAC capex compounding) — expect insurance premiums to compound above CPI over the hold.
Questions for the listing agent
- Is there a deadline driving the sale (1031 exchange, divorce, estate, relocation)? That informs how much negotiation room exists.
- Schools are D-rated, which usually means shorter tenancies and higher turnover. Who's the typical renter profile here, and what's been the actual vacancy rate?
- Crime grade is D in this area — have there been break-ins, vandalism, or insurance claims at this property in the last 3 years? What carrier currently insures it and at what premium?
- What's the average days-on-market for RENTAL listings here right now (not sales)? A rising rental-DOM trend means longer vacancies and softer asking-rent achievability than the comps imply.
- What's the recent tenant-quality profile in this submarket — average credit score on applications, eviction rate, late-payment / NSF rate, and stable-employment percentage? A property-management company in the area should have these aggregated.
- How much new for-sale + rental construction is in the pipeline within 1–3 miles? Heavy new supply typically softens prices + rents 12–24 months out; constrained supply supports both.
Investment metrics
- 1% rule
- 1.08% ✓
- Cap rate
- 7.46%
- Cash-on-cash
- 4.16%
- DSCR
- 1.18
- GRM
- 7.7
CMA / ARV
- ARV (on-the-fly)
- $264,244
- Comps found
- 12
Show comp detail 12 sales within ~0.75 mi
| Address | Dist | Beds/Ba | Sqft | Sold | Price | $/sf | Match |
|---|---|---|---|---|---|---|---|
| 1330 Ruswood Dr | 0.03mi | 3/2.0 | 1,934 (-9%) | 3mo | $239,900 | $124 | 81 |
| 925 Kenwood Dr | 0.09mi | 4/3.0 (+1) | 2,153 (+1%) | 8mo | $295,000 | $137 | 78 |
| 937 Ruswood Cir | 0.08mi | 3/2.0 | 2,305 (+8%) | 6mo | $274,900 | $119 | 77 |
| 810 Harwell St | 0.37mi | 3/2.0 | 1,972 (-8%) | 2mo | $255,000 | $129 | 69 |
| 849 Harwell St | 0.33mi | 3/2.0 | 1,920 (-10%) | 3mo | $220,000 | $115 | 66 |
| 1033 Chriswood Dr | 0.30mi | 3/2.0 | 2,338 (+10%) | 5mo | $298,500 | $128 | 66 |
| 809 Harrison Ave | 0.45mi | 4/3.0 (+1) | 2,087 (-2%) | 4mo | $248,900 | $119 | 63 |
| 942 E North 12th St | 0.38mi | 3/2.0 | 1,908 (-10%) | 6mo | $214,900 | $113 | 60 |
| 857 Harrison Ave | 0.43mi | 4/2.0 (+1) | 2,289 (+7%) | 5mo | $264,000 | $115 | 58 |
| 817 Avenue F | 0.39mi | 4/2.0 (+1) | 2,294 (+8%) | 9mo | $285,000 | $124 | 57 |
| 1509 Griffith Rd | 0.43mi | 4/2.0 (+1) | 1,891 (-11%) | 6mo | $339,900 | $180 | 52 |
| 1749 Paras Ave | 0.71mi | 3/2.0 | 1,850 (-13%) | 7mo | $369,900 | $200 | 39 |
Match score weights: distance 35% · size 25% · config 20% · recency 20%. Top-matched comps best support the ARV.
Projected returns pro-forma
-3.0% appreciation · 8.0% rent growth · sell at horizon
- IRR
- -3.9%
- Equity multiple
- 0.85×
- Total profit
- $-10,708
- Equity at exit
- $37,261
- IRR
- 11.1%
- Equity multiple
- 2.08×
- Total profit
- $75,818
- Equity at exit
- $21,607
Cash invested: $69,972 (down + closing). Projections, not guarantees.
Landlord ↔ Tenant lean methodology
- Overall (STATE)
- 87 Strongly Landlord-Friendly
- State Texas
- 87 Strongly Landlord-Friendly · R+5
- County
- — inherits STATE
- City
- — inherits STATE
ZIP-level market 79601
- Home prices YoY
- -22.8%
- Rents YoY
- 43.4%
- Active inventory
- 195
- Price-to-rent
- 7.7×
Monthly cashflow live
- Estimated rent
- $2,691 medium interval (Pro) →
- Mortgage (P&I)
- −$1,311
- Tax from tax record
- −$469 /mo · $5,624/yr
- Insurance
- −$104
- HOA
- −$0
- Vacancy / Maint / Mgmt
- −$565
- Net cashflow
- $242
Break-even live
UW: 25.0% down · 7.5% · 30yr · 1.5% tax · 5.0% vac · 8.0% maint · 8.0% mgmt
Financing live
Cash to close
- Down payment
- $62,475
- Closing costs
- $7,497
- Reserves months
- —
- Total cash needed
- —
Loan-product check · same deal, 3 products live
Conventional
25% down · 7.5% · 30yr
- Down + closing
- —
- Monthly P&I
- —
- Monthly cashflow
- —
- DSCR
- —
- Eligible?
- —
Personal DTI + credit; lowest rate.
DSCR
20% down · 8.5% · 30yr
- Down + closing
- —
- Monthly P&I
- —
- Monthly cashflow
- —
- DSCR
- —
- Eligible?
- —
No personal income docs; deal must DSCR.
Hard money
10% down · 12.0% · 12mo
- Down + closing
- —
- Monthly P&I
- —
- Monthly cashflow
- —
- DSCR
- —
- Eligible?
- —
Short-term bridge; refi at stabilization.
Rent comps 4 comps
| Address | Beds | Baths | Sqft | Rent | $/sqft | DOM | Units | Dist |
|---|---|---|---|---|---|---|---|---|
| 825 Milford St Abilene, TX | 3.0 | 2.0 | 2068 | $2,895 | $1.40 | 43d | 1 | 0.48mi |
| 758 E North 10th St Abilene, TX | 4.0 | 2.0 | 2366 | $2,300 | $0.97 | 43d | 1 | 0.53mi |
| 873 Cloverleaf Ln Abilene, TX | 3.0 | 2.0 | 1541 | $2,995 | $1.94 | 13d | 1 | 1.31mi |
| 949 Reeves St Abilene, TX | 4.0 | 2.0 | 1900 | $3,200 | $1.68 | 13d | 1 | 1.38mi |
Listing history 3 events
-
2026-06-10status $249,900 Pending 1 DOM
-
2026-06-09remarks 149-char remark
-
2026-06-09$249,900 Active Option Contract 1 DOM
ⓘ Source: listings_history table (triggers on properties + properties_extension) + one-shot
backfill from property_details.listing_events for pre-trigger history.
Tax reassessment forecast TX · Resets to sale price
- Current annual tax
- $5,624 · $469/mo
- Projected year-2 tax
- $5,624 · $469/mo
- Expected delta
- $0/yr ($0/mo · 0.0%)
ⓘ Screening estimate from a state-policy table — verify with the county assessor before closing.
Climate risk First Street
- Flood 1/10 Low FEMA zone X (unshaded) · 0% chance over 30 yrs
- Wildfire 7/10 Severe
- Heat 7/10 Severe 7 d/yr ≥104°F today · 24 d/yr by 30 yrs out
- Wind 4/10 Moderate 11% chance of damaging wind over 30 yrs
- Air quality 1/10 Low 0 unhealthy d/yr today · 0 by 30 yrs out
Nearby sold comps map
Loading sold comps map…
Walkable amenities ~0.75 mi
Loading nearby amenities…
Taxation est. · year 1
- Rental income
- $32,287
- − Mortgage interest
- −$13,998
- − Property taxes
- −$5,624
- − Insurance
- −$1,250
- − Repairs & maintenance
- −$2,583
- − Management
- −$2,583
- − Depreciation
- −$7,270
- Taxable loss
- −$1,020
- Est. tax savings @ 24.0%
- +$245
- After-tax cash flow
- $3,152/yr
For passive investors: Depreciation is non-cash, so a rental often shows a tax loss while cash-flowing — sheltering income. Rental losses are passive: they offset passive income freely, and up to $25,000/yr can offset ordinary (W-2) income if you actively participate and your MAGI is under $100k (phasing out to $0 by $150k); unused losses carry forward. On sale, claimed depreciation is recaptured at up to 25%, and gains may owe capital-gains tax (a 1031 exchange can defer both). Figures are a year-1 estimate at your 24.0% rate — not tax advice; consult a CPA.
Schools (NCES district)
- District
- Abilene ISD
- NCES district ID
- 4807440
- Math proficiency
- 32% ▼ -11.00%
- Reading proficiency
- 34% ▼ -5.00%
- Median HH income
- $39,782
- Composite
- 27.71/100
- National rank
- #6909
- State rank
- #575 of 826 in TX
Livability — Abilene
- Score
- 75/100
- State rank
- #142
- US rank
- #4037
Category grades
Schools grade is shown separately in the Schools card above.
Census & demographics
- Census place
- Abilene, TX
- County
- Taylor County · 136,672 people
- City population
- 136,672
- Metro
- Abilene, TX
- Population (ZIP)
- 28,050
- Household income
- $53,631
- Rent vs Own
- Severe rent burden
- 1240.0
Population outlook (Taylor County) Hauer SSP2
- Today (2025)
- 145,270 people
- By 2030
- 150,050 · +3.3%
- By 2040
- 159,417 · +9.7%
- By 2050
- 168,883 · +16.3%
- By 2075
- 194,436 · +33.8%
- By 2100
- 203,163 · +39.9%
Race, ethnicity, and origin ACS 2023
- Neighborhood character
- Diverse neighborhood (Simpson 0.61)
- Race & ethnicity
- White 55% Hispanic / Latino 25% Black 13% Two or more races 13% Asian 3%
- Hispanic origin (detail)
- Mexican 21%
- Common ancestry
- Italian 2% Lithuanian 2% Serbian 1%
- Foreign-born
- 7% · Canada, Vietnam
- Languages at home
- 81% English-only · Spanish 15% French/Haitian/Cajun 1% Vietnamese 1%
Political lean MEDSL · Taylor
- 2024 margin
- Solid R (+49.8) · D 24.6% · R 74.4% · Other 1.0%
- 2008→2024 swing
- -4.2pp toward R · 2008: -45.6pp · 2024: -49.8pp
- All cycles
- 2024: R+49.8 2020: R+45.3 2016: R+51.1 2012: R+53.6 2008: R+45.6
Not yet ingested
- Civics
- —
Market trends
- HPI YoY
- ▼ -63.17%
- Current HPI
- 214.4372
- Rent YoY
- ▲ 43.38%
- Metro
- Abilene, TX
- State GDP YoY
- ▲ 3.95%
- F500 in state
- 110
Industry mix (Fortune 500 HQ in TX)
| Industry | F500 HQs | Revenue |
|---|---|---|
| Energy | 16 | $1,198B |
|
||
| Technology | 5 | $198B |
|
||
| Engineering / Construction | 4 | $72B |
|
||
| Energy Services | 3 | $60B |
|
||
| Utilities | 3 | $41B |
|
||
| Healthcare | 2 | $330B |
|
||
Price history
+92.4% since first listed7 events — show timeline
- 2026-06-08 Listed — NTREIS
- 2026-06-08 Listed $249,900 NTREIS
- 2009-05-20 Sold (Public Records) — Public Records
- 2009-05-18 Sold (MLS) — NTREIS
- 2009-05-04 Listing Removed — NTREIS
- 2009-02-03 Listed $129,900 NTREIS
- 2002-09-04 Sold (Public Records) — Public Records
Property tax history
+4.6%/yrLatest (2025): $5,624 · +7.8% YoY. Source: county tax records.
Cash-flow waterfall
monthlySold comps — $/sqft
last 12 mo · ≤1 miLoading sold comps…