 🏗️ New Construction
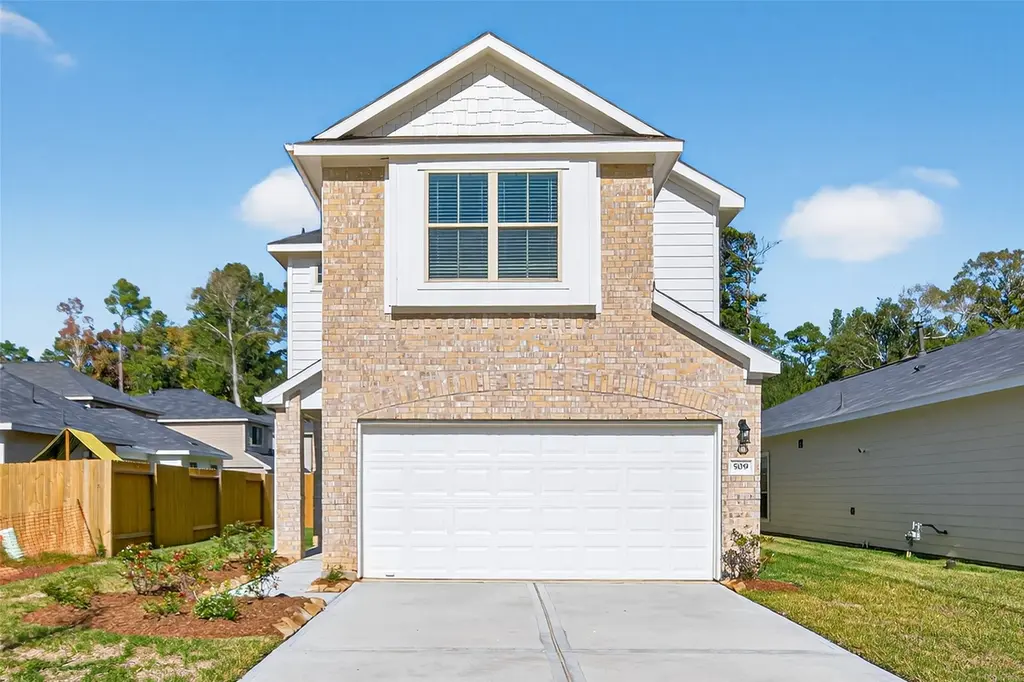
24718 Lago Bay Ln · Houston, TX
Flood risk 1/10 · Minimal
- FEMA flood zone
- X (unshaded)
- Chance of flooding over 30 yrs
- 0.0%
- Est. flood insurance / yr
- $507 – $1,088
Fire risk 3/10 · Minor
- Est. fire insurance / yr
- $1,222 – $2,270
Heat risk 8/10 · Major
- Hot days now (above 112°F)
- 6 days/yr
- Hot days in 30 yrs
- 20 days/yr
Wind risk 8/10 · Major
- Chance of severe wind over 30 yrs
- 99.0%
Air-quality risk 2/10 · Minimal
- Unhealthy air days now
- 2 days/yr
- Unhealthy air days in 30 yrs
- 2 days/yr
Risk factors via First Street. Map © Google.
Why this score? — see what drove the D- grade
The composite is a weighted blend of 9 inputs, each scored 0–100. Each bar is that input's sub-score; the figure is the points it added to the 100-point composite (weight × sub-score).
- Cash flow +9.8/30.0
- ARV discount +7.5/15.0
- Condition / age +4.0/5.0
- Livability +3.7/5.0
- 1% rule +3.1/10.0
- Schools +3.1/10.0
- DSCR +2.8/10.0
- Rent growth +2.5/5.0
- Appreciation +0.7/10.0
$259,990
🖨 Deal sheet 📄 Offer letter ✓ Due diligence
Listing remarks
Welcome to your new home built by Cyrene Homes! Spacious floor plans! This beautiful plan will offer a kitchen with granite countertops, recessed lighting, & stainless-steel appliances! Designer finishes! Rear sod included! Oversized homes available! Zoned to Huffman ISD! Walking distance from the nearby elementary school! Moments from Lake Houston Marina! Enjoy the lake breezes! Within proximity to TX-99, I-69, and Alt 90!
Key facts
- Rear sod included
- Recessed lighting
- Granite countertops
Tags
Property features AI
Finance
- Other: Municipal Utility District disclosure
- HOA & community: Association: ACMI; Annual association fee of $400; Community features include curbs
Exterior
- Parking: Attached 2-car garage; Driveway
- Security: Smoke detectors
- Utilities: Public water; Public sewer
- Home design: Residential property; Under construction (new construction); Built in 2026; Slab foundation; Composition roof
- Construction: Brick and cement siding construction; Builder: Cyrene Homes
- Exterior features: Deck; Patio; Private yard; Fenced backyard; Subdivision setting; Concrete road access
Interior
- Kitchen: Dishwasher; Gas cooktop; Oven; Microwave; Disposal; Granite counters; Breakfast bar
- Bedrooms: Total of 7 rooms (includes bedrooms and living spaces)
- Flooring: Carpet; Plank flooring; Vinyl
- Bathrooms: 2 full bathrooms; 1 half bathroom
- Heating & cooling: Central heating (gas); Central electric air conditioning
- Interior features: Breakfast bar; Double vanity; Granite counters; High ceilings; Primary bedroom with bath; Soaking tub; Separate shower; Tub/shower combination; Window treatments; Ceiling fans; Programmable thermostat; Insulated doors; Low emissivity windows; Window coverings; Ventilation for improved indoor air quality
- Laundry & utility: Washer hookup; Electric dryer hookup; Tankless water heater
Neighborhood map
What this means for you Summary
Snapshot
- This is a 4-bed/2.5-bath single-family listed at $260k. Condition is rated good.
Deal economics
- At list price, monthly cash flow is $-178 ($-2k/yr) — negative.
- To cash-flow at today's rent, offer at most $250k (3.7% below list).
- To meet the 1% rule (rent ≥ 1% of price), the offer needs to be $223k (14.1% below list).
- Recommended offer: $223k (14.1% below list) — sets the bar for 1% rule.
- Cap rate 5.5% vs local median 3.2% in Houston — top-decile yield for the area; either an underpriced asset or a hidden risk that comps aren't pricing in. Stress-test before assuming the spread holds.
Location & tenants
- Location reads 74/100 on livability (#184 in TX, #4,771 nationally) — a middle-class / working-renter tenant base. Strengths: amenities A+, cost of living A+, housing A+; Watch: crime F.
- Huffman ISD (rural): math 32% / reading 35% proficiency, ranked #500 of 826 in TX (top 60%) — families likely to look elsewhere, expect single-tenant / working-renter base with shorter leases.
- Zoned schools: Huffman Middle (math 36% / reading 32%, grade F, #892 of 1,662 statewide, top 55%, 907 students, 42% FRL); Hargrave H S (math 31% / reading 46%, grade F, #866 of 1,632 statewide, top 54%, 1,125 students, 36% FRL) — zoned schools at 39% FRL track the district average.
- Market conditions: 585 active listings in the ZIP; 6 comparable units currently listed for rent nearby; rentals lingering (median 44d on market — plan ~5-8 weeks vacancy on turnover, expect pricing pressure); 83% of comp listings sitting > 30 days — soft ceiling on asking rent; solid renter incomes; 29,883 units permitted in Harris County in 2024 (8,621 in 5+ unit buildings).
Forward outlook
- Local home prices are declining (-3.0%/yr); year-one equity from $2k of loan paydown is wiped out by about $8k of value loss. Plan a longer hold.
- Harris County population projected at +47% by 2050 — long-run rental-demand tailwind backs the buy-and-hold thesis.
Negotiation context
- Only 12 days on market — expect competitive offers; lowballing is unlikely to land.
Risks & watch-outs
- Climate carrying-cost: severe wind risk, 99% chance of damaging wind over 30y; extreme-heat days projected 6→20/yr by 2055 (HVAC capex compounding) — expect insurance premiums to compound above CPI over the hold.
Questions for the listing agent
- What do current leases actually rent for vs. the listed asking? Can we see a recent rent roll and the last 12 months of T-12 income?
- What does the HOA fee cover, when was the last increase, and are there any pending special assessments or reserve-fund shortfalls?
- Is there a deadline driving the sale (1031 exchange, divorce, estate, relocation)? That informs how much negotiation room exists.
- Schools are D-rated, which usually means shorter tenancies and higher turnover. Who's the typical renter profile here, and what's been the actual vacancy rate?
- Crime grade is F in this area — have there been break-ins, vandalism, or insurance claims at this property in the last 3 years? What carrier currently insures it and at what premium?
- The area grade is low — what's the realistic commute time and amenity access for the typical tenant pool here? Any planned neighborhood developments (good or bad) we should know about?
- What's the average days-on-market for RENTAL listings here right now (not sales)? A rising rental-DOM trend means longer vacancies and softer asking-rent achievability than the comps imply.
- What's the recent tenant-quality profile in this submarket — average credit score on applications, eviction rate, late-payment / NSF rate, and stable-employment percentage? A property-management company in the area should have these aggregated.
- How much new for-sale + rental construction is in the pipeline within 1–3 miles? Heavy new supply typically softens prices + rents 12–24 months out; constrained supply supports both.
Investment metrics
- 1% rule
- 0.81% ✗
- Cap rate
- 5.52%
- Cash-on-cash
- -2.76%
- DSCR
- 0.88
- GRM
- 10.3
CMA / ARV
- ARV (on-the-fly)
- $276,192
- Comps found
- 12
Show comp detail 12 sales within ~0.75 mi
| Address | Dist | Beds/Ba | Sqft | Sold | Price | $/sf | Match |
|---|---|---|---|---|---|---|---|
| 24711 Windward Birch Way | 0.12mi | 4/2.5 | 1,918 (0%) | 4mo | $271,990 | $142 | 91 |
| 24721 Thornbluff Briar Trl | 0.28mi | 4/2.5 | 1,918 (0%) | 1mo | $259,990 | $136 | 86 |
| 24707 White Libertia Ct | 0.24mi | 4/2.5 | 1,860 (-3%) | 3mo | $259,990 | $140 | 82 |
| 509 Emerald Thicket Ln | 0.38mi | 4/2.5 | 1,918 (0%) | 3mo | $249,990 | $130 | 80 |
| 24702 Windward Birch Ln | 0.12mi | 3/3.0 (-1) | 1,774 (-8%) | 2mo | $254,990 | $144 | 73 |
| 231 Loon River Dr | 0.44mi | 3/2.0 (-1) | 1,833 (-4%) | 3mo | $314,900 | $172 | 63 |
| 24702 Stablewood Frst | 0.37mi | 3/3.0 (-1) | 1,774 (-8%) | 2mo | $254,990 | $144 | 62 |
| 227 Glencroft Ct | 0.75mi | 4/2.0 | 1,960 (+2%) | 4mo | $325,000 | $166 | 56 |
| 24414 Whitesail Dr | 0.33mi | 3/2.0 (-1) | 1,663 (-13%) | 3mo | $193,200 | $116 | 53 |
| 513 Emerald Thicket Ln | 0.40mi | 3/2.5 (-1) | 1,647 (-14%) | 1mo | $249,990 | $152 | 52 |
| 24705 Sonora Crescent Cir | 0.45mi | 3/2.0 (-1) | 1,689 (-12%) | 3mo | $288,990 | $171 | 50 |
| 310 Cherry Valley Dr | 0.62mi | 4/2.5 | 2,192 (+14%) | 3mo | $339,000 | $155 | 45 |
Match score weights: distance 35% · size 25% · config 20% · recency 20%. Top-matched comps best support the ARV.
Projected returns pro-forma
-3.0% appreciation · 3.0% rent growth · sell at horizon
- IRR
- -20.9%
- Equity multiple
- 0.28×
- Total profit
- $-56,045
- Equity at exit
- $41,181
- IRR
- -14.2%
- Equity multiple
- 0.18×
- Total profit
- $-63,191
- Equity at exit
- $23,880
Cash invested: $77,334 (down + closing). Projections, not guarantees.
Landlord ↔ Tenant lean methodology
- Overall (STATE)
- 87 Strongly Landlord-Friendly
- State Texas
- 87 Strongly Landlord-Friendly · R+5
- County
- — inherits STATE
- City
- — inherits STATE
ZIP-level market 77336
- Home prices YoY
- -1.8%
- Active inventory
- 585
- Price-to-rent
- 9.7×
Monthly cashflow live
- Estimated rent
- $2,232 high interval (Pro) →
- Mortgage (P&I)
- −$1,448
- Tax est. 1.5%
- −$345 /mo · $4,143/yr
- Insurance
- −$115
- HOA
- −$33
- Vacancy / Maint / Mgmt
- −$469
- Net cashflow
- $-178
Break-even live
UW: 25.0% down · 7.5% · 30yr · 1.5% tax · 5.0% vac · 8.0% maint · 8.0% mgmt
Financing live
Cash to close
- Down payment
- $69,048
- Closing costs
- $8,286
- Reserves months
- —
- Total cash needed
- —
Loan-product check · same deal, 3 products live
Conventional
25% down · 7.5% · 30yr
- Down + closing
- —
- Monthly P&I
- —
- Monthly cashflow
- —
- DSCR
- —
- Eligible?
- —
Personal DTI + credit; lowest rate.
DSCR
20% down · 8.5% · 30yr
- Down + closing
- —
- Monthly P&I
- —
- Monthly cashflow
- —
- DSCR
- —
- Eligible?
- —
No personal income docs; deal must DSCR.
Hard money
10% down · 12.0% · 12mo
- Down + closing
- —
- Monthly P&I
- —
- Monthly cashflow
- —
- DSCR
- —
- Eligible?
- —
Short-term bridge; refi at stabilization.
Rent comps 6 comps
| Address | Beds | Baths | Sqft | Rent | $/sqft | DOM | Units | Dist |
|---|---|---|---|---|---|---|---|---|
| 24527 Lightwoods Dr Huffman, TX | 4.0 | 2.0 | 2095 | $2,100 | $1.00 | 44d | 1 | 0.16mi |
| 24523 Whitesail Dr Huffman, TX | 3.0 | 2.0 | 1512 | $1,800 | $1.19 | 44d | 1 | 0.18mi |
| 408 Emerald Thicket Ln Huffman, TX | 3.0 | 2.5 | 1755 | $2,200 | $1.25 | 44d | 1 | 0.27mi |
| 24719 Colony Meadow Trl Huffman, TX | 4.0 | 2.0 | 1613 | $2,200 | $1.36 | 44d | 1 | 0.87mi |
| 24730 Russet Bluff Trl Huffman, TX | 4.0 | 2.0 | 1604 | $2,150 | $1.34 | 1d | 1 | 0.97mi |
| 24118 Grey Fox Dr Huffman, TX | 3.0 | 2.0 | 1543 | $1,425 | $0.92 | 44d | 1 | 1.18mi |
HOA detail
- Monthly dues
- $33 · $396/yr
Listing history 9 events
-
2026-06-18days on market $259,990 Active 12 DOM
-
2026-06-17days on market $259,990 Active 11 DOM
-
2026-06-16days on market $259,990 Active 10 DOM
-
2026-06-15days on market $259,990 Active 9 DOM
-
2026-06-13days on market $259,990 Active 7 DOM
-
2026-06-09days on market $259,990 Active 3 DOM
-
2026-06-08days on market $259,990 Active 2 DOM
-
2026-06-07remarks 428-char remark
-
2026-06-07$259,990 Active 1 DOM
ⓘ Source: listings_history table (triggers on properties + properties_extension) + one-shot
backfill from property_details.listing_events for pre-trigger history.
Climate risk First Street
- Flood 1/10 Low FEMA zone X (unshaded) · 0% chance over 30 yrs
- Wildfire 3/10 Moderate
- Heat 8/10 Severe 6 d/yr ≥112°F today · 20 d/yr by 30 yrs out
- Wind 8/10 Severe 99% chance of damaging wind over 30 yrs
- Air quality 2/10 Low 2 unhealthy d/yr today · 2 by 30 yrs out
Nearby sold comps map
Loading sold comps map…
Walkable amenities ~0.75 mi
Loading nearby amenities…
Taxation est. · year 1
- Rental income
- $26,789
- − Mortgage interest
- −$15,471
- − Property taxes
- −$4,143
- − Insurance
- −$1,381
- − Repairs & maintenance
- −$2,143
- − Management
- −$2,143
- − HOA
- −$396
- − Depreciation
- −$8,035
- Taxable loss
- −$6,923
- Est. tax savings @ 24.0%
- +$1,662
- After-tax cash flow
- $-476/yr
For passive investors: Depreciation is non-cash, so a rental often shows a tax loss while cash-flowing — sheltering income. Rental losses are passive: they offset passive income freely, and up to $25,000/yr can offset ordinary (W-2) income if you actively participate and your MAGI is under $100k (phasing out to $0 by $150k); unused losses carry forward. On sale, claimed depreciation is recaptured at up to 25%, and gains may owe capital-gains tax (a 1031 exchange can defer both). Figures are a year-1 estimate at your 24.0% rate — not tax advice; consult a CPA.
Condition & rehab AI · 13 photos
This home is in good condition with modern finishes and a well-maintained exterior. A fresh coat of paint and some landscaping would significantly enhance its curb appeal and value.
Value-add opportunities
- Resale Paint exterior — Enhances curb appeal
- Resale Paint interior — Freshens the look
- Both Landscaping — Improves curb appeal and enhances property value
Renovation cost estimate screening
Value-add ROI direction
- Resale Paint exterior — Enhances curb appeal ↑
- Resale Paint interior — Freshens the look ↑
- Both Landscaping — Improves curb appeal and enhances property value ↑
ⓘ Cost ranges are severity-bucket heuristics (US national rule-of-thumb). Get contractor quotes + a written scope before underwriting a rehab budget.
Schools (NCES district)
- District
- Huffman ISD
- NCES district ID
- 4823820
- Math proficiency
- 32% ▼ -9.00%
- Reading proficiency
- 35% ▼ -9.00%
- Median HH income
- $65,848
- Composite
- 30.61/100
- National rank
- #6195
- State rank
- #500 of 826 in TX
Livability — Houston
- Score
- 74/100
- State rank
- #184
- US rank
- #4771
Category grades
Schools grade is shown separately in the Schools card above.
Census & demographics
- Census place
- Houston, TX
- County
- Harris County · 4,702,590 people
- City population
- 3,226,434
- Metro
- Houston-The Woodlands-Sugar Land, TX
- Population (ZIP)
- 14,342
- Household income
- $96,404
- Rent vs Own
- Severe rent burden
- 377.0
Population outlook (Harris County) Hauer SSP2
- Today (2025)
- 5,571,493 people
- By 2030
- 6,089,821 · +9.3%
- By 2040
- 7,142,806 · +28.2%
- By 2050
- 8,185,864 · +46.9%
- By 2075
- 10,574,329 · +89.8%
- By 2100
- 12,109,958 · +117.4%
Race, ethnicity, and origin ACS 2023
- Neighborhood character
- Majority White (65%)
- Race & ethnicity
- White 65% Hispanic / Latino 23% Two or more races 9% Black 5% Native American 4%
- Hispanic origin (detail)
- Mexican 20%
- Common ancestry
- Lithuanian 4% Slovak 2% Romanian 2%
- Foreign-born
- 9% · Canada
- Languages at home
- 79% English-only · Spanish 18% Other Indo-European 2%
Political lean MEDSL · Harris
- 2024 margin
- Lean D (+5.5) · D 52.0% · R 46.4% · Other 1.6%
- 2008→2024 swing
- +3.9pp toward D · 2008: 1.6pp · 2024: 5.5pp
- All cycles
- 2024: D+5.5 2020: D+13.3 2016: D+12.4 2012: D+0.1 2008: D+1.6
Not yet ingested
- Civics
- —
Market trends
- HPI YoY
- ▼ -8.59%
- Current HPI
- 472.03
- Rent YoY
- —
- Metro
- Houston-The Woodlands-Sugar Land, TX
- State GDP YoY
- ▲ 3.95%
- F500 in state
- 110
Industry mix (Fortune 500 HQ in TX)
| Industry | F500 HQs | Revenue |
|---|---|---|
| Energy | 16 | $1,198B |
|
||
| Technology | 5 | $198B |
|
||
| Engineering / Construction | 4 | $72B |
|
||
| Energy Services | 3 | $60B |
|
||
| Utilities | 3 | $41B |
|
||
| Healthcare | 2 | $330B |
|
||
Price history
1 event — show timeline
- 2026-06-06 Listed $259,990 HARMLS
Cash-flow waterfall
monthlySold comps — $/sqft
last 12 mo · ≤1 miLoading sold comps…