 🏗️ New Construction
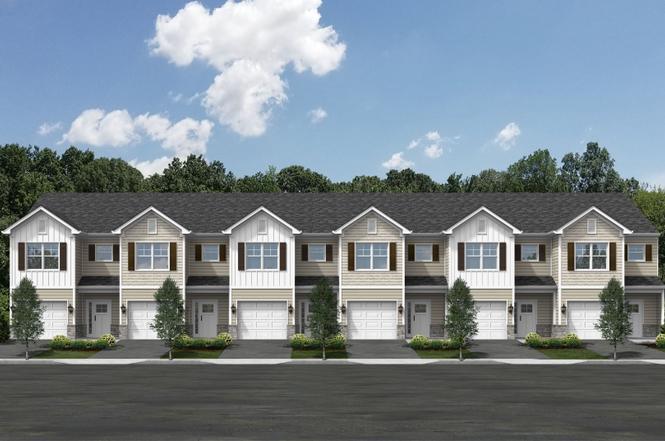
Cypress Townhome Interior Unit Plan · Dentsville, SC
Flood risk No data
- FEMA flood zone
- —
- Chance of flooding over 30 yrs
- —
- Est. flood insurance / yr
- —
Fire risk No data
- Est. fire insurance / yr
- —
Heat risk No data
- Hot days now (above threshold)
- —
- Hot days in 30 yrs
- —
Wind risk No data
- Chance of severe wind over 30 yrs
- —
Air-quality risk No data
- Unhealthy air days now
- —
- Unhealthy air days in 30 yrs
- —
Risk factors via First Street. Map © Google.
Why this score? — see what drove the D grade
The composite is a weighted blend of 9 inputs, each scored 0–100. Each bar is that input's sub-score; the figure is the points it added to the 100-point composite (weight × sub-score).
- Cash flow +14.6/30.0
- ARV discount +7.5/15.0
- DSCR +4.5/10.0
- 1% rule +4.1/10.0
- Schools +3.6/10.0
- Livability +3.6/5.0
- Rent growth +2.6/5.0
- Condition / age +2.5/5.0
- Appreciation +0.0/10.0
$196,400
🖨 Deal sheet (PDF) 📄 Offer letter ✓ Due diligence
Listing remarks
The Cypress invites you into a spacious entryway that leads to a half bath and coat closet. Beyond that, the townhome opens to a large great room that connects the kitchen and dining areas. Upstairs, you'll find three bedrooms and two full baths. The Owner's suite features a large walk-in closet. Additional highlights include a single-car garage for parking and storage.
Key facts
- Half bath
- Single-car garage
- Walk-in closet
Tags
Property features AI
Finance
- Financial info: List price $196,400
Exterior
- Parking: 1 parking space
- Home design: Townhome, interior unit; Plan inventory type
- Exterior features: Living area of 1362
Interior
- Bedrooms: 3 bedrooms
- Bathrooms: 2 full bathrooms, 1 half bathroom (2.5 total)
- Interior features: Active new construction plan (Cypress Townhome Interior Unit)
Neighborhood map
What this means for you Summary
Snapshot
- This is a 3-bed/2.5-bath townhouse listed at $196k.
Deal economics
- At list price, monthly cash flow is $48 ($579/yr) — positive.
- The deal already cash-flows at list — no discount required.
- To meet the 1% rule (rent ≥ 1% of price), the offer needs to be $178k (9.4% below list).
- Recommended offer: $173k (12.0% below list) — sets the bar for market timing.
Location & tenants
- Location reads 71/100 on livability (#50 in SC) — a middle-class / working-renter tenant base. Strengths: cost of living A+, health & safety A+, housing A; Watch: amenities D+, crime F, commute F.
- Richland 02 (suburban): math 35% / reading 47% proficiency, ranked #29 of 80 in SC (top 36%) — families likely to look elsewhere, expect single-tenant / working-renter base with shorter leases.
- Zoned schools: Windsor Elementary (math 21% / reading 23%, grade F, #475 of 597 statewide, top 81%, 537 students, 100% FRL); Longleaf Middle (math 19% / reading 41%, grade F, #136 of 229 statewide, top 60%, 802 students, 69% FRL); Westwood High (math 47% / reading 87%, grade B, #73 of 196 statewide, top 41%, 1,684 students, 66% FRL) — zoned schools average 78% FRL vs 38% district-wide (40 pts higher); higher-poverty schools than district average — tighter screening recommended.
- Market conditions: Rents flat; 341 active listings in the ZIP; 19 comparable units currently listed for rent nearby; rentals leasing fast (median 13d on market — plan ~1-2 weeks tenant-placement turnaround); 3,472 units permitted in Richland County in 2024 (1,096 in 5+ unit buildings).
- This rent runs 34% of the median local income ($62k/yr) — at the standard rent-burdened threshold; future hikes will face affordability resistance.
Forward outlook
- Local home prices are declining (-3.0%/yr); year-one equity from $1k of loan paydown is wiped out by about $6k of value loss. Plan a longer hold.
- Richland County population projected at +30% by 2050 — long-run rental-demand tailwind backs the buy-and-hold thesis.
Negotiation context
- It's been on market 132 days — a 12% lower offer ($173k) is reasonable based on typical stale-listing flexibility.
Questions for the listing agent
- It's been on market 132 days. Have you received any prior offers? Is the seller open to a 12% concession, seller financing, or rate buy-down credit?
- Why hasn't it sold? Are there any deal-killer items the seller is aware of (foundation, flood, title, zoning, code violations)?
- Is there a deadline driving the sale (1031 exchange, divorce, estate, relocation)? That informs how much negotiation room exists.
- Schools are D-rated, which usually means shorter tenancies and higher turnover. Who's the typical renter profile here, and what's been the actual vacancy rate?
- Crime grade is F in this area — have there been break-ins, vandalism, or insurance claims at this property in the last 3 years? What carrier currently insures it and at what premium?
- The area grade is low — what's the realistic commute time and amenity access for the typical tenant pool here? Any planned neighborhood developments (good or bad) we should know about?
- What's the average days-on-market for RENTAL listings here right now (not sales)? A rising rental-DOM trend means longer vacancies and softer asking-rent achievability than the comps imply.
- What's the recent tenant-quality profile in this submarket — average credit score on applications, eviction rate, late-payment / NSF rate, and stable-employment percentage? A property-management company in the area should have these aggregated.
- How much new for-sale + rental construction is in the pipeline within 1–3 miles? Heavy new supply typically softens prices + rents 12–24 months out; constrained supply supports both.
Investment metrics
- 1% rule
- 0.91% ✗
- Cap rate
- 6.59%
- Cash-on-cash
- 1.05%
- DSCR
- 1.05
- GRM
- 9.2
CMA / ARV
No comps found within radius.
Projected returns pro-forma
-3.0% appreciation · 0.21% rent growth · sell at horizon
- IRR
- -17.8%
- Equity multiple
- 0.39×
- Total profit
- $-33,587
- Equity at exit
- $29,284
- IRR
- -16.4%
- Equity multiple
- 0.20×
- Total profit
- $-44,039
- Equity at exit
- $16,981
Cash invested: $54,992 (down + closing). Projections, not guarantees.
Landlord ↔ Tenant lean methodology
- Overall (STATE)
- 90 Strongly Landlord-Friendly
- State South Carolina
- 90 Strongly Landlord-Friendly · R+6
- County
- — inherits STATE
- City
- — inherits STATE
ZIP-level market 29223
- Rents YoY
- 0.2%
- Active inventory
- 341
- Price-to-rent
- 9.2×
Monthly cashflow live
- Estimated rent
- $1,779 high interval (Pro) →
- Mortgage (P&I)
- −$1,030
- Tax est. 1.5%
- −$246 /mo · $2,946/yr
- Insurance
- −$82
- HOA
- −$0
- Vacancy / Maint / Mgmt
- −$374
- Net cashflow
- $48
Break-even live
Sensitivity live
| Price | -10% $184 | -5% $116 | +0% $48 | +5% $-20 | +10% $-88 |
|---|---|---|---|---|---|
| Rent | -10% $-92 | -5% $-22 | +0% $48 | +5% $118 | +10% $189 |
| Rate | -1.0pp $147 | -0.5pp $98 | base $48 | +0.5pp $-3 | +1.0pp $-54 |
UW: 25.0% down · 7.5% · 30yr · 1.5% tax · 5.0% vac · 8.0% maint · 8.0% mgmt
Financing live
Cash to close
- Down payment
- $49,100
- Closing costs
- $5,892
- Reserves months
- —
- Total cash needed
- —
Loan-product check · same deal, 3 products live
Conventional
25% down · 7.5% · 30yr
- Down + closing
- —
- Monthly P&I
- —
- Monthly cashflow
- —
- DSCR
- —
- Eligible?
- —
Personal DTI + credit; lowest rate.
DSCR
20% down · 8.5% · 30yr
- Down + closing
- —
- Monthly P&I
- —
- Monthly cashflow
- —
- DSCR
- —
- Eligible?
- —
No personal income docs; deal must DSCR.
Hard money
10% down · 12.0% · 12mo
- Down + closing
- —
- Monthly P&I
- —
- Monthly cashflow
- —
- DSCR
- —
- Eligible?
- —
Short-term bridge; refi at stabilization.
Rent comps 19 comps
| Address | Beds | Baths | Sqft | Rent | $/sqft | DOM | Units | Dist |
|---|---|---|---|---|---|---|---|---|
| 137 Carr Ln Columbia, SC | 3.0 | 2.5 | 1250 | $1,900 | $1.52 | 5d | 1 | 0.04mi |
| 2058 Mapleton Dr Columbia, SC | 3.0 | 2.5 | 1476 | $1,995 | $1.35 | 23d | 1 | 0.27mi |
| 237 Foxhunt Rd Columbia, SC | 3.0 | 1.5 | 1008 | $1,250 | $1.24 | 16d | 1 | 0.59mi |
| 1659 Legrand Rd Columbia, SC | 2.0–3.0 | 2.0–2.5 | 1450 | $2,500 | $1.72 | 5d | 12 | 0.70mi |
| 8100 Bayfield Rd Columbia, SC | 3.0 | 1.0–2.0 | 773 | $1,364 | $1.76 | 25d | 1 | 0.80mi |
| 125 Charleswood Dr Columbia, SC | 3.0 | 1.0 | 1074 | $1,350 | $1.26 | 25d | 1 | 0.87mi |
| 113 Charleswood Dr Columbia, SC | 4.0 | 1.5 | 1196 | $1,555 | $1.30 | 5d | 1 | 0.89mi |
| 1152 Rabon Pond Dr Columbia, SC | 3.0 | 2.5 | 1522 | $1,799 | $1.18 | 13d | 1 | 0.92mi |
| 381 Valley Heights Ln Columbia, SC | 3.0 | 2.5 | 1471 | $1,719 | $1.17 | 25d | 1 | 1.01mi |
| 207 Weddell St Unit 1D Columbia, SC | 2.0 | 2.0 | 1200 | $1,100 | $0.92 | 5d | 1 | 1.05mi |
| 712 Blazing Star Trl Columbia, SC | 3.0 | 2.0 | 1100 | $1,699 | $1.54 | 5d | 1 | 1.05mi |
| 1728 Springwoods Lake Dr Columbia, SC | 2.0 | 1.5 | 1025 | $1,200 | $1.17 | 5d | 1 | 1.05mi |
| 1682 Horseshoe Dr Unit D Columbia, SC | 2.0 | 2.0 | 1000 | $895 | $0.90 | 16d | 1 | 1.16mi |
| 500 Rockhaven Dr Columbia, SC | 3.0 | 2.0 | 1064 | $1,649 | $1.55 | 25d | 1 | 1.16mi |
| 2250 Hard Scrabble Rd Columbia, SC | 1.0–3.0 | 1.0–2.0 | 1155 | $2,311 | $2.00 | 13d | 18 | 1.21mi |
| 1718 Horseshoe Dr Apt B Columbia, SC | 2.0 | 1.5 | 1050 | $1,300 | $1.24 | 13d | 1 | 1.24mi |
| 109 Summer Vale Dr Columbia, SC | 4.0 | 2.5 | 1800 | $2,150 | $1.19 | 5d | 1 | 1.27mi |
| 261 Business Park Blvd Columbia, SC | 1.0–3.0 | 1.0–2.0 | 1127 | $1,599 | $1.42 | 13d | 2 | 1.29mi |
| 1000 Windsor Shores Dr Columbia, SC | 1.0–3.0 | 1.0–2.0 | 1011 | $1,590 | $1.57 | 25d | 1 | 1.45mi |
Listing history 16 events
-
2026-06-22days on market $196,400 Active 132 DOM
-
2026-06-18days on market $196,400 Active 129 DOM
-
2026-06-17days on market $196,400 Active 128 DOM
-
2026-06-16days on market $196,400 Active 127 DOM
-
2026-06-15days on market $196,400 Active 126 DOM
-
2026-06-14days on market $196,400 Active 124 DOM
-
2026-06-13days on market $196,400 Active 123 DOM
-
2026-06-10days on market $196,400 Active 121 DOM
-
2026-06-09days on market $196,400 Active 120 DOM
-
2026-06-08days on market $196,400 Active 119 DOM
-
2026-06-07days on market $196,400 Active 118 DOM
-
2026-06-05days on market $196,400 Active 115 DOM
-
2026-06-03days on market $196,400 Active 114 DOM
-
2026-06-03days on market $196,400 Active 113 DOM
-
2026-06-01days on market $196,400 Active 112 DOM
-
2026-05-31days on market $196,400 Active 111 DOM
ⓘ Source: listings_history table (triggers on properties + properties_extension) + one-shot
backfill from property_details.listing_events for pre-trigger history.
Nearby sold comps map
Loading sold comps map…
Walkable amenities ~0.75 mi
Loading nearby amenities…
Taxation est. · year 1
- Rental income
- $21,349
- − Mortgage interest
- −$11,001
- − Property taxes
- −$2,946
- − Insurance
- −$982
- − Repairs & maintenance
- −$1,708
- − Management
- −$1,708
- − Depreciation
- −$5,713
- Taxable loss
- −$2,710
- Est. tax savings @ 24.0%
- +$650
- After-tax cash flow
- $1,229/yr
For passive investors: Depreciation is non-cash, so a rental often shows a tax loss while cash-flowing — sheltering income. Rental losses are passive: they offset passive income freely, and up to $25,000/yr can offset ordinary (W-2) income if you actively participate and your MAGI is under $100k (phasing out to $0 by $150k); unused losses carry forward. On sale, claimed depreciation is recaptured at up to 25%, and gains may owe capital-gains tax (a 1031 exchange can defer both). Figures are a year-1 estimate at your 24.0% rate — not tax advice; consult a CPA.
Schools (NCES district)
- District
- Richland 02
- NCES district ID
- 4503390
- Math proficiency
- 35% ▼ -15.00%
- Reading proficiency
- 47% ▼ -5.00%
- Median HH income
- $59,684
- Composite
- 36.2/100
- National rank
- #4730
- State rank
- #29 of 80 in SC
Livability — Dentsville
- Score
- 71/100
- State rank
- #50
- US rank
- #6940
Category grades
Schools grade is shown separately in the Schools card above.
Census & demographics
- County
- Richland County · 389,530 people
- City population
- 52,835
- Metro
- Columbia, SC
- Population (ZIP)
- 53,074
- Household income
- $62,408
- Rent vs Own
- Severe rent burden
- 2857.0
Population outlook (Richland County) Hauer SSP2
- Today (2025)
- 459,667 people
- By 2030
- 487,524 · +6.1%
- By 2040
- 542,035 · +17.9%
- By 2050
- 595,371 · +29.5%
- By 2075
- 732,998 · +59.5%
- By 2100
- 820,415 · +78.5%
Race, ethnicity, and origin ACS 2023
- Neighborhood character
- Diverse neighborhood (Simpson 0.60)
- Race & ethnicity
- Black 57% White 23% Hispanic / Latino 11% Two or more races 6% Asian 4%
- Hispanic origin (detail)
- Mexican 5% Puerto Rican 2%
- Common ancestry
- Slovak 1% Serbian 1% Italian 1%
- Foreign-born
- 10% · Canada, South Korea
- Languages at home
- 86% English-only · Spanish 8% Other Indo-European 2% Korean 1%
Political lean MEDSL · Richland
- 2024 margin
- Solid D (+34.6) · D 66.4% · R 31.8% · Other 1.8%
- 2008→2024 swing
- +5.7pp toward D · 2008: 28.9pp · 2024: 34.6pp
- All cycles
- 2024: D+34.6 2020: D+38.3 2016: D+32.9 2012: D+33.3 2008: D+28.9
Not yet ingested
- Civics
- —
Market trends
- HPI YoY
- ▼ -135.96%
- Current HPI
- 195.3158
- Rent YoY
- ▲ 0.21%
- Metro
- Columbia, SC
- State GDP YoY
- ▲ 4.51%
- F500 in state
- 2
Industry mix (Fortune 500 HQ in SC)
| Industry | F500 HQs | Revenue |
|---|---|---|
| Packaging | 1 | $7B |
|
||
Cash-flow waterfall
monthlySold comps — $/sqft
last 12 mo · ≤1 miLoading sold comps…