1703 Pueblo Trce · Harker Heights, TX
Flood risk 1/10 · Minimal
- FEMA flood zone
- X (unshaded)
- Chance of flooding over 30 yrs
- 0.0%
- Est. flood insurance / yr
- $507 – $1,088
Fire risk 5/10 · Moderate
- Est. fire insurance / yr
- $1,222 – $2,270
Heat risk 8/10 · Major
- Hot days now (above 107°F)
- 7 days/yr
- Hot days in 30 yrs
- 24 days/yr
Wind risk 8/10 · Major
- Chance of severe wind over 30 yrs
- 80.0%
Air-quality risk 2/10 · Minimal
- Unhealthy air days now
- 0 days/yr
- Unhealthy air days in 30 yrs
- 1 days/yr
Risk factors via First Street. Map © Google.
Why this score? — see what drove the C grade
The composite is a weighted blend of 9 inputs, each scored 0–100. Each bar is that input's sub-score; the figure is the points it added to the 100-point composite (weight × sub-score).
- Cash flow +19.5/30.0
- ARV discount +15.0/15.0
- DSCR +6.2/10.0
- 1% rule +5.7/10.0
- Livability +4.0/5.0
- Schools +3.0/10.0
- Rent growth +2.7/5.0
- Condition / age +2.5/5.0
- Appreciation +0.0/10.0
$129,999
🖨 Deal sheet 📄 Offer letter ✓ Due diligence
Listing remarks MLS
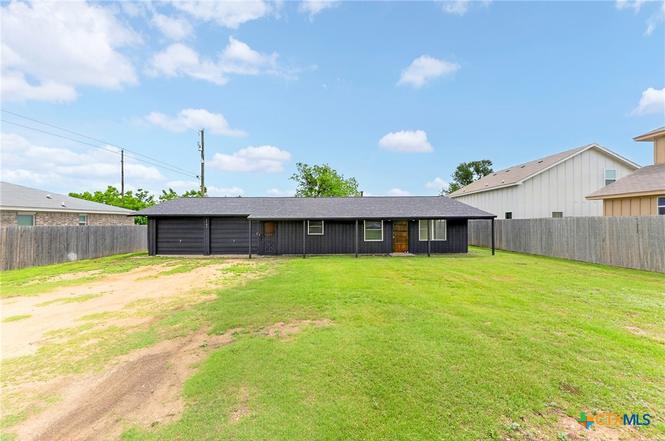
Located in the growing community of Harker Heights, this 2-bedroom, 2-bath home with a flex room offers a great opportunity for investors or buyers looking to build equity. Situated on a . 31-acre lot, the home features 1,046 sq ft of living space with plenty of potential to customize and add value. The flex room can easily serve as a home office, additional bedroom, or space, increasing both functionality and rental appeal. The SPACIOUS lot provides ample room for outdoor improvements, expansion, or additional storage. Recent updates include new windows, new refrigerator and stove, fresh interior and exterior paint (Jan–Feb 2026), new carpet in the bedrooms and flex room (April 2026), and a roof that is approximately 2 years old. With no HOA restrictions, owners have greater flexibility for long-term rentals or personal use. Conveniently located near shopping, dining, schools, and just minutes from Fort Hood, this property offers strong potential as a rental investment or a great starter home. Schedule your showing TODAY and EXPLORE the possibilities this property has to offer!
Key facts
- New stove
- Spacious lot
- New refrigerator
Tags
Neighborhood map
What this means for you Summary
Snapshot
- This is a 2-bed/2.0-bath single-family listed at $130k.
Deal economics
- At list price, monthly cash flow is $147 ($2k/yr) — positive.
- The deal already cash-flows at list — no discount required.
- Meets the 1% rule at list price ($1k rent vs $130k).
- Recommended offer: $126k (3.0% below list) — sets the bar for market timing.
- Cap rate 7.6% vs local median 3.8% in Harker Heights — top-decile yield for the area; either an underpriced asset or a hidden risk that comps aren't pricing in. Stress-test before assuming the spread holds.
Location & tenants
- Location reads 79/100 on livability (#61 in TX, #2,271 nationally) — a middle-class / working-renter tenant base. Strengths: cost of living A+, housing A+, health & safety A+; Watch: amenities F, commute F.
- Killeen ISD (urban): math 31% / reading 38% proficiency, ranked #524 of 826 in TX (top 63%) — families likely to look elsewhere, expect single-tenant / working-renter base with shorter leases.
- Market conditions: Rents flat; 267 active listings in the ZIP; 40 comparable units currently listed for rent nearby; rentals lingering (median 44d on market — plan ~5-8 weeks vacancy on turnover, expect pricing pressure); 52% of comp listings sitting > 30 days — soft ceiling on asking rent; solid renter incomes; 3,222 units permitted in Bell County in 2024 (246 in 5+ unit buildings).
Forward outlook
- Local home prices are declining (-3.0%/yr); year-one equity from $899 of loan paydown is wiped out by about $4k of value loss. Plan a longer hold.
- Bell County population projected at +21% by 2050 — long-run rental-demand tailwind backs the buy-and-hold thesis.
Negotiation context
- It's been on market 53 days — a 3% lower offer ($126k) is reasonable based on typical stale-listing flexibility.
- 5 sale attempts since 10y ago with the ask held roughly flat each time — persistent listings suggest the price (not the market) is what's stuck; bring a comps-based counter.
- Current owner paid $60k; list at $130k implies a 117% gain — meaningful room to come down on a strong offer.
Risks & watch-outs
- Climate carrying-cost: severe wind risk, 80% chance of damaging wind over 30y; moderate wildfire risk; extreme-heat days projected 7→24/yr by 2055 (HVAC capex compounding) — expect insurance premiums to compound above CPI over the hold.
Questions for the listing agent
- It's been on market 53 days. Have you received any prior offers? Is the seller open to a 3% concession, seller financing, or rate buy-down credit?
- Built in 1973 — when were the roof, HVAC, electrical panel, plumbing, and water heater last replaced?
- Is there a deadline driving the sale (1031 exchange, divorce, estate, relocation)? That informs how much negotiation room exists.
- What's the average days-on-market for RENTAL listings here right now (not sales)? A rising rental-DOM trend means longer vacancies and softer asking-rent achievability than the comps imply.
- What's the recent tenant-quality profile in this submarket — average credit score on applications, eviction rate, late-payment / NSF rate, and stable-employment percentage? A property-management company in the area should have these aggregated.
- How much new for-sale + rental construction is in the pipeline within 1–3 miles? Heavy new supply typically softens prices + rents 12–24 months out; constrained supply supports both.
Investment metrics
- 1% rule
- 1.07% ✓
- Cap rate
- 7.65%
- Cash-on-cash
- 4.85%
- DSCR
- 1.22
- GRM
- 7.8
CMA / ARV
- ARV (median comp)
- $212,068
- List price
- $129,999
- Delta
- -38.70%
- Verdict
- UNDERPRICED
- Comps
- 7 within 2.0 mi
Show comp detail 12 sales within ~0.75 mi
| Address | Dist | Beds/Ba | Sqft | Sold | Price | $/sf | Match |
|---|---|---|---|---|---|---|---|
| 1518 Zinfandel Dr | 0.41mi | 3/2.0 (+1) | 1,469 (+5%) | 7mo | $220,000 | $150 | 62 |
| 1100 Chablis Dr | 0.44mi | 3/2.0 (+1) | 1,533 (+10%) | 2mo | $220,000 | $144 | 58 |
| 1516 Indian Trl | 0.35mi | 3/2.0 (+1) | 1,589 (+14%) | 8mo | $220,000 | $138 | 50 |
| 1842 Horatio St | 0.47mi | 3/2.0 (+1) | 1,598 (+14%) | 3mo | $285,000 | $178 | 47 |
| 1961 Mercer St | 0.51mi | 3/2.0 (+1) | 1,508 (+8%) | 14mo | $276,470 | $183 | 46 |
| 1741 Horatio St | 0.50mi | 3/2.0 (+1) | 1,508 (+8%) | 17mo | $284,140 | $188 | 45 |
| 1738 Horatio St | 0.51mi | 3/2.0 (+1) | 1,508 (+8%) | 19mo | $269,010 | $178 | 43 |
| 1824 Caponier St | 0.60mi | 3/2.0 (+1) | 1,508 (+8%) | 16mo | $296,805 | $197 | 41 |
| 1778 Horatio St | 0.47mi | 3/2.0 (+1) | 1,605 (+15%) | 12mo | $302,225 | $188 | 39 |
| 1879 Truscott Pkwy | 0.70mi | 3/2.0 (+1) | 1,508 (+8%) | 15mo | $284,745 | $189 | 37 |
| 1957 Mercer St | 0.51mi | 3/2.0 (+1) | 1,605 (+15%) | 23mo | $276,150 | $172 | 28 |
| 1908 Wyman St | 0.64mi | 3/2.0 (+1) | 1,605 (+15%) | 18mo | $299,225 | $186 | 25 |
Match score weights: distance 35% · size 25% · config 20% · recency 20%. Top-matched comps best support the ARV.
Projected returns pro-forma
-3.0% appreciation · 0.93% rent growth · sell at horizon
- IRR
- -11.2%
- Equity multiple
- 0.60×
- Total profit
- $-14,487
- Equity at exit
- $19,383
- IRR
- -5.4%
- Equity multiple
- 0.68×
- Total profit
- $-11,507
- Equity at exit
- $11,240
Cash invested: $36,400 (down + closing). Projections, not guarantees.
Landlord ↔ Tenant lean methodology
- Overall (STATE)
- 87 Strongly Landlord-Friendly
- State Texas
- 87 Strongly Landlord-Friendly · R+5
- County
- — inherits STATE
- City
- — inherits STATE
ZIP-level market 76548
- Home prices YoY
- -25.2%
- Rents YoY
- 0.9%
- Active inventory
- 267
- Price-to-rent
- 7.8×
Monthly cashflow live
- Estimated rent
- $1,390 high interval (Pro) →
- Mortgage (P&I)
- −$682
- Tax from tax record
- −$215 /mo · $2,579/yr
- Insurance
- −$54
- HOA
- −$0
- Vacancy / Maint / Mgmt
- −$292
- Net cashflow
- $147
Break-even live
UW: 25.0% down · 7.5% · 30yr · 1.5% tax · 5.0% vac · 8.0% maint · 8.0% mgmt
Financing live
Cash to close
- Down payment
- $32,500
- Closing costs
- $3,900
- Reserves months
- —
- Total cash needed
- —
Loan-product check · same deal, 3 products live
Conventional
25% down · 7.5% · 30yr
- Down + closing
- —
- Monthly P&I
- —
- Monthly cashflow
- —
- DSCR
- —
- Eligible?
- —
Personal DTI + credit; lowest rate.
DSCR
20% down · 8.5% · 30yr
- Down + closing
- —
- Monthly P&I
- —
- Monthly cashflow
- —
- DSCR
- —
- Eligible?
- —
No personal income docs; deal must DSCR.
Hard money
10% down · 12.0% · 12mo
- Down + closing
- —
- Monthly P&I
- —
- Monthly cashflow
- —
- DSCR
- —
- Eligible?
- —
Short-term bridge; refi at stabilization.
Rent comps 40 comps
| Address | Beds | Baths | Sqft | Rent | $/sqft | DOM | Units | Dist |
|---|---|---|---|---|---|---|---|---|
| 1619 Pima Trl Unit B Harker Heights, TX | 3.0 | 2.0 | 1150 | $1,295 | $1.13 | 23d | 1 | 0.10mi |
| 1623 Yuma Trl Unit A Harker Heights, TX | 3.0 | 2.0 | 1152 | $1,300 | $1.13 | 23d | 1 | 0.13mi |
| 1623 Yuma Trl Unit A Harker Heights, TX | 3.0 | 2.0 | 1152 | $1,350 | $1.17 | 43d | 1 | 0.13mi |
| 1606 Yuma Trl Unit A Harker Heights, TX | 3.0 | 2.0 | 1152 | $1,250 | $1.09 | 23d | 1 | 0.20mi |
| 1622 Pima Trl Unit A Harker Heights, TX | 3.0 | 2.0 | 1252 | $1,350 | $1.08 | 13d | 1 | 0.21mi |
| 1618 Pima Trl Unit A-SHOWABLE Harker Heights, TX | 3.0 | 2.0 | 1370 | $1,395 | $1.02 | 23d | 1 | 0.22mi |
| 1610 Tejas Trl Apt B Harker Heights, TX | 2.0 | 2.0 | 1217 | $1,350 | $1.11 | 43d | 1 | 0.24mi |
| 1610 Tejas Trl Apt B Harker Heights, TX | 2.0 | 2.0 | 1217 | $1,350 | $1.11 | 23d | 1 | 0.24mi |
| 1621 Pontotoc Trce Harker Heights, TX | 2.0 | 2.0 | 932 | $1,195 | $1.28 | 43d | 1 | 0.24mi |
| 1610 Pima Trl Unit A Harker Heights, TX | 3.0 | 2.0 | 1252 | $1,700 | $1.36 | 43d | 1 | 0.25mi |
| 1613 Pontotoc Trce Apt B Harker Heights, TX | 3.0 | 2.0 | 1310 | $1,395 | $1.06 | 43d | 1 | 0.25mi |
| 1608 Aztec Trce Apt A Harker Heights, TX | 3.0 | 2.0 | 1151 | $1,000 | $0.87 | 43d | 1 | 0.26mi |
| 1728 Tejas Trl Harker Heights, TX | 3.0 | 2.0–2.5 | 1293 | $1,832 | $1.42 | 13d | 13 | 0.27mi |
| 1909 Caspian Trl Unit B Harker Heights, TX | 3.0 | 2.0 | 1367 | $1,495 | $1.09 | 43d | 1 | 0.32mi |
| 1513 Indian Trl Unit A Harker Heights, TX | 2.0 | 1.0 | 952 | $995 | $1.05 | 13d | 1 | 0.34mi |
| 1808 Seminole Trce Unit A-SHOWABLE Harker Heights, TX | 3.0 | 2.0 | 1308 | $1,395 | $1.07 | 43d | 1 | 0.36mi |
| 1811 Pontotoc Trce Unit C-WILL INSTALL VINYL PLANK THROUGHOUT WHEN RENTED Harker Heights, TX | 2.0 | 1.0 | 888 | $795 | $0.90 | 13d | 1 | 0.38mi |
| 1701 Dakota Trce Harker Heights, TX | 3.0 | 2.5 | 1219 | $1,650 | $1.35 | 21d | 1 | 0.38mi |
| 1427 Hopi Trl Unit B Harker Heights, TX | 3.0 | 2.0 | 1400 | $1,245 | $0.89 | 13d | 1 | 0.39mi |
| 1514 Dakota Trce Apt A Harker Heights, TX | 3.0 | 2.0 | 1330 | $1,395 | $1.05 | 23d | 1 | 0.41mi |
| 1809 Indian Trl Harker Heights, TX | 2.0 | 2.0 | 1150 | $1,400 | $1.22 | 43d | 1 | 0.43mi |
| 1803 Emma Naylor Ct Unit B Harker Heights, TX | 3.0 | 2.0 | 1330 | $1,450 | $1.09 | 43d | 1 | 0.43mi |
| 1814 Horatio St Nolanville, TX | 3.0 | 2.0 | 1841 | $2,065 | $1.12 | 43d | 1 | 0.44mi |
| 1601 Ute Trl Harker Heights, TX | 2.0 | 1.0 | 970 | $850 | $0.88 | 43d | 1 | 0.47mi |
| 1601 Ute Trl Unit 1 Harker Heights, TX | 2.0 | 1.0 | 970 | $995 | $1.03 | 13d | 1 | 0.47mi |
| 1712 Ute Trl Unit A Harker Heights, TX | 3.0 | 2.0 | 1250 | $1,150 | $0.92 | 23d | 1 | 0.48mi |
| 1409 Natchez Trl Harker Heights, TX | 3.0 | 2.0 | 1347 | $1,350 | $1.00 | 43d | 1 | 0.49mi |
| 2002 Tru Cir Unit A-MAKE READY Harker Heights, TX | 3.0 | 2.0 | 1397 | $1,395 | $1.00 | 13d | 1 | 0.52mi |
| 1800 Tru Trl Apt B Harker Heights, TX | 3.0 | 2.0 | 1310 | $1,295 | $0.99 | 23d | 1 | 0.56mi |
| 1909 Chiricahua Trce Harker Heights, TX | 3.0 | 2.0 | 1341 | $1,595 | $1.19 | 43d | 1 | 0.62mi |
| 1301 Indian Trl Unit D Harker Heights, TX | 2.0 | 1.5 | 976 | $795 | $0.81 | 43d | 1 | 0.63mi |
| 1301 Indian Trl Harker Heights, TX | 2.0 | 2.0 | 976 | $850 | $0.87 | 43d | 1 | 0.63mi |
| 1430 Shoshoni Trl Apt A Harker Heights, TX | 3.0 | 2.0 | 1085 | $1,100 | $1.01 | 23d | 1 | 0.64mi |
| 1430 Shoshoni Trl Apt B Harker Heights, TX | 3.0 | 2.0 | 1085 | $1,125 | $1.04 | 23d | 1 | 0.64mi |
| 1534 Shoshoni Trl Unit A Harker Heights, TX | 3.0 | 2.0 | 1100 | $1,295 | $1.18 | 43d | 1 | 0.64mi |
| 2209 Indian Trl Unit A Harker Heights, TX | 3.0 | 2.0 | 1200 | $995 | $0.83 | 43d | 1 | 0.65mi |
| 124 Wind Ridge Dr Unit B Harker Heights, TX | 2.0 | 1.0 | 1012 | $1,175 | $1.16 | 43d | 1 | 0.69mi |
| 707 End O Trl Harker Heights, TX | 3.0 | 2.0 | 1508 | $1,850 | $1.23 | 13d | 1 | 0.69mi |
| 2013 Drawbridge Dr Unit DRAW2013 Harker Heights, TX | 3.0 | 2.0 | 1687 | $1,699 | $1.01 | 43d | 1 | 0.92mi |
| 1004 Indian Trl Apt D Harker Heights, TX | 2.0 | 2.0 | 1200 | $900 | $0.75 | 43d | 1 | 0.94mi |
Listing history 22 events
-
2026-06-15statusdays on market $129,999 Pending 53 DOM
-
2026-06-14days on market $129,999 Active Under Contract 52 DOM
-
2026-06-13days on market $129,999 Active Under Contract 51 DOM
-
2026-06-10days on market $129,999 Active Under Contract 49 DOM
-
2026-06-09days on market $129,999 Active Under Contract 48 DOM
-
2026-06-08days on market $129,999 Active Under Contract 47 DOM
-
2026-06-07days on market $129,999 Active Under Contract 46 DOM
-
2026-06-03days on market $129,999 Active Under Contract 42 DOM
-
2026-06-02days on market $129,999 Active Under Contract 41 DOM
-
2026-06-01days on market $129,999 Active Under Contract 40 DOM
-
2026-05-31days on market $129,999 Active Under Contract 39 DOM
-
2026-05-30days on market $129,999 Active Under Contract 38 DOM
-
2026-05-08historical Active Under Contract 1101-char remark
Show marketing remark (1101 chars)
Located in the growing community of Harker Heights, this 2-bedroom, 2-bath home with a flex room offers a great opportunity for investors or buyers looking to build equity. Situated on a . 31-acre lot, the home features 1,046 sq ft of living space with plenty of potential to customize and add value. The flex room can easily serve as a home office, additional bedroom, or space, increasing both functionality and rental appeal. The SPACIOUS lot provides ample room for outdoor improvements, expansion, or additional storage. Recent updates include new windows, new refrigerator and stove, fresh interior and exterior paint (Jan–Feb 2026), new carpet in the bedrooms and flex room (April 2026), and a roof that is approximately 2 years old. With no HOA restrictions, owners have greater flexibility for long-term rentals or personal use. Conveniently located near shopping, dining, schools, and just minutes from Fort Hood, this property offers strong potential as a rental investment or a great starter home. Schedule your showing TODAY and EXPLORE the possibilities this property has to offer!
-
2026-04-22status Active 1101-char remark
Show marketing remark (1101 chars)
Located in the growing community of Harker Heights, this 2-bedroom, 2-bath home with a flex room offers a great opportunity for investors or buyers looking to build equity. Situated on a . 31-acre lot, the home features 1,046 sq ft of living space with plenty of potential to customize and add value. The flex room can easily serve as a home office, additional bedroom, or space, increasing both functionality and rental appeal. The SPACIOUS lot provides ample room for outdoor improvements, expansion, or additional storage. Recent updates include new windows, new refrigerator and stove, fresh interior and exterior paint (Jan–Feb 2026), new carpet in the bedrooms and flex room (April 2026), and a roof that is approximately 2 years old. With no HOA restrictions, owners have greater flexibility for long-term rentals or personal use. Conveniently located near shopping, dining, schools, and just minutes from Fort Hood, this property offers strong potential as a rental investment or a great starter home. Schedule your showing TODAY and EXPLORE the possibilities this property has to offer!
-
2026-04-17$129,999 Active 1101-char remark
Show marketing remark (1101 chars)
Located in the growing community of Harker Heights, this 2-bedroom, 2-bath home with a flex room offers a great opportunity for investors or buyers looking to build equity. Situated on a . 31-acre lot, the home features 1,046 sq ft of living space with plenty of potential to customize and add value. The flex room can easily serve as a home office, additional bedroom, or space, increasing both functionality and rental appeal. The SPACIOUS lot provides ample room for outdoor improvements, expansion, or additional storage. Recent updates include new windows, new refrigerator and stove, fresh interior and exterior paint (Jan–Feb 2026), new carpet in the bedrooms and flex room (April 2026), and a roof that is approximately 2 years old. With no HOA restrictions, owners have greater flexibility for long-term rentals or personal use. Conveniently located near shopping, dining, schools, and just minutes from Fort Hood, this property offers strong potential as a rental investment or a great starter home. Schedule your showing TODAY and EXPLORE the possibilities this property has to offer!
-
2021-07-07historical
-
2021-07-06$46,700
-
2016-08-12soldstatus $60,000
-
2016-07-15$67,000
-
2016-07-15historical
-
2016-07-13$67,000
-
1973-05-14soldstatus
ⓘ Source: listings_history table (triggers on properties + properties_extension) + one-shot
backfill from property_details.listing_events for pre-trigger history.
Tax reassessment forecast TX · Resets to sale price
- Current annual tax
- $2,579 · $215/mo
- Projected year-2 tax
- $2,579 · $215/mo
- Expected delta
- $0/yr ($0/mo · 0.0%)
ⓘ Screening estimate from a state-policy table — verify with the county assessor before closing.
Climate risk First Street
- Flood 1/10 Low FEMA zone X (unshaded) · 0% chance over 30 yrs
- Wildfire 5/10 Major
- Heat 8/10 Severe 7 d/yr ≥107°F today · 24 d/yr by 30 yrs out
- Wind 8/10 Severe 80% chance of damaging wind over 30 yrs
- Air quality 2/10 Low 0 unhealthy d/yr today · 1 by 30 yrs out
Nearby sold comps map
Loading sold comps map…
Walkable amenities ~0.75 mi
Loading nearby amenities…
Taxation est. · year 1
- Rental income
- $16,675
- − Mortgage interest
- −$7,282
- − Property taxes
- −$2,579
- − Insurance
- −$650
- − Repairs & maintenance
- −$1,334
- − Management
- −$1,334
- − Depreciation
- −$3,782
- Taxable loss
- −$286
- Est. tax savings @ 24.0%
- +$69
- After-tax cash flow
- $1,832/yr
For passive investors: Depreciation is non-cash, so a rental often shows a tax loss while cash-flowing — sheltering income. Rental losses are passive: they offset passive income freely, and up to $25,000/yr can offset ordinary (W-2) income if you actively participate and your MAGI is under $100k (phasing out to $0 by $150k); unused losses carry forward. On sale, claimed depreciation is recaptured at up to 25%, and gains may owe capital-gains tax (a 1031 exchange can defer both). Figures are a year-1 estimate at your 24.0% rate — not tax advice; consult a CPA.
Schools (NCES district)
- District
- Killeen ISD
- NCES district ID
- 4825660
- Math proficiency
- 31% ▼ -16.00%
- Reading proficiency
- 38% ▼ -3.00%
- Median HH income
- $47,665
- Composite
- 29.69/100
- National rank
- #6458
- State rank
- #524 of 826 in TX
Livability — Harker Heights
- Score
- 79/100
- State rank
- #61
- US rank
- #2271
Category grades
Schools grade is shown separately in the Schools card above.
Census & demographics
- Census place
- Harker Heights, TX
- County
- Bell County · 345,090 people
- City population
- 33,729
- Metro
- Killeen-Temple, TX
- Population (ZIP)
- 33,729
- Household income
- $80,520
- Rent vs Own
- Severe rent burden
- 672.0
Population outlook (Bell County) Hauer SSP2
- Today (2025)
- 371,114 people
- By 2030
- 389,104 · +4.8%
- By 2040
- 420,592 · +13.3%
- By 2050
- 447,779 · +20.7%
- By 2075
- 499,130 · +34.5%
- By 2100
- 505,680 · +36.3%
Race, ethnicity, and origin ACS 2023
- Neighborhood character
- Highly diverse neighborhood (Simpson 0.72)
- Race & ethnicity
- White 40% Black 27% Hispanic / Latino 22% Two or more races 13% Asian 3% Pacific Islander 2% Native American 1%
- Hispanic origin (detail)
- Mexican 14% Puerto Rican 3%
- Common ancestry
- Iranian 3% Lithuanian 2% Italian 2%
- Foreign-born
- 10% · Canada, Vietnam, South Korea
- Languages at home
- 83% English-only · Spanish 9% French/Haitian/Cajun 2% German/W. Germanic 1%
Political lean MEDSL · Bell
- 2024 margin
- R (+16.2) · D 41.3% · R 57.6% · Other 1.1%
- 2008→2024 swing
- -6.5pp toward R · 2008: -9.8pp · 2024: -16.2pp
- All cycles
- 2024: R+16.2 2020: R+8.5 2016: R+15.1 2012: R+16.4 2008: R+9.8
Not yet ingested
- Civics
- —
Market trends
- HPI YoY
- ▼ -52.76%
- Current HPI
- 156.4499
- Rent YoY
- ▲ 0.93%
- Metro
- Killeen-Temple, TX
- State GDP YoY
- ▲ 3.95%
- F500 in state
- 110
Industry mix (Fortune 500 HQ in TX)
| Industry | F500 HQs | Revenue |
|---|---|---|
| Energy | 16 | $1,198B |
|
||
| Technology | 5 | $198B |
|
||
| Engineering / Construction | 4 | $72B |
|
||
| Energy Services | 3 | $60B |
|
||
| Utilities | 3 | $41B |
|
||
| Healthcare | 2 | $330B |
|
||
Price history
+94.0% since first listed10 events — show timeline
- 2026-05-08 Contingent — CTXMLS
- 2026-04-22 Relisted — CTXMLS
- 2026-04-17 Listed $129,999 CTXMLS
- 2021-07-07 Listing Removed — CTXMLS
- 2021-07-06 Listed $46,700 CTXMLS
- 2016-08-12 Sold (MLS) $60,000 CTXMLS
- 2016-07-15 Listing Removed — CTXMLS
- 2016-07-15 Listed $67,000 CTXMLS
- 2016-07-13 Listed $67,000 CTXMLS
- 1973-05-14 Sold (Public Records) — Public Records
Property tax history
+5.1%/yrLatest (2025): $2,579 · -4.9% YoY. Source: county tax records.
Cash-flow waterfall
monthlySold comps — $/sqft
last 12 mo · ≤1 miLoading sold comps…