 🏷️ Likely Rental
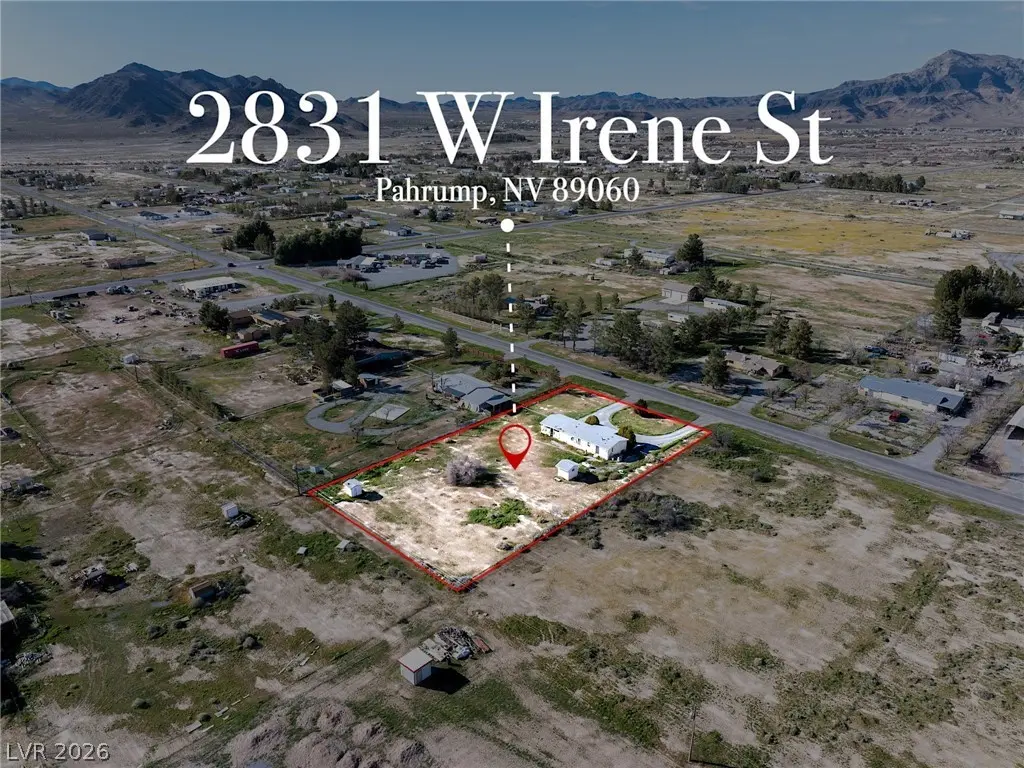
2831 W Irene St · Pahrump, NV
Flood risk 1/10 · Minimal
- FEMA flood zone
- X (shaded)
- Chance of flooding over 30 yrs
- 0.0%
- Est. flood insurance / yr
- $507 – $1,088
Fire risk 3/10 · Minor
- Est. fire insurance / yr
- $490 – $910
Heat risk 7/10 · Major
- Hot days now (above 103°F)
- 6 days/yr
- Hot days in 30 yrs
- 15 days/yr
Wind risk 1/10 · Minimal
- Chance of severe wind over 30 yrs
- —
Air-quality risk 1/10 · Minimal
- Unhealthy air days now
- 0 days/yr
- Unhealthy air days in 30 yrs
- 0 days/yr
Risk factors via First Street. Map © Google.
Why this score? — see what drove the B grade
The composite is a weighted blend of 9 inputs, each scored 0–100. Each bar is that input's sub-score; the figure is the points it added to the 100-point composite (weight × sub-score).
- Cash flow +27.2/30.0
- ARV discount +15.0/15.0
- DSCR +9.5/10.0
- 1% rule +6.2/10.0
- Livability +3.4/5.0
- Appreciation +2.5/10.0
- Rent growth +2.5/5.0
- Condition / age +2.5/5.0
- Schools +2.2/10.0
$160,000
🖨 Deal sheet (PDF) 📄 Offer letter ✓ Due diligence
Listing remarks MLS
Investment opportunity! 3 bed, 2 bath home with 1,128 sq ft on a fully fenced 1-acre lot. Currently tenant-occupied on a month-to-month lease, offering immediate rental income and flexibility for future plans.
Key facts
- 1.06 acre lot
- 2 parking spots
- Built 1985
Neighborhood map
What this means for you Summary
Snapshot
- This is a 3-bed/2.0-bath other listed at $160k.
Deal economics
- At list price, monthly cash flow is $460 ($6k/yr) — positive.
- The deal already cash-flows at list — no discount required.
- Meets the 1% rule at list price ($2k rent vs $160k).
- Recommended offer: $146k (9.0% below list) — sets the bar for market timing.
- Cap rate 9.7% vs local median 3.4% in Pahrump — top-decile yield for the area; either an underpriced asset or a hidden risk that comps aren't pricing in. Stress-test before assuming the spread holds.
Location & tenants
- Location reads 68/100 on livability (#30 in NV) — a middle-class / working-renter tenant base. Strengths: cost of living A+, housing A+, health & safety A+; Watch: employment D, schools F, crime F.
- Nye County School District (rural): math 20% / reading 33% proficiency, ranked #16 of 17 in NV (top 94%) — low school quality limits family demand, transient renter base, plan for 1-2y turnover.
- Market conditions: 655 active listings in the ZIP.
- This rent runs 43% of the median local income ($50k/yr) — at the standard rent-burdened threshold; future hikes will face affordability resistance.
Forward outlook
- Local home prices are declining (-3.0%/yr); year-one equity from $1k of loan paydown is wiped out by about $5k of value loss. Plan a longer hold.
- Nye County population projected at -28% by 2050 — secular population decline; favor cash flow + early exit over multi-decade hold.
- At projected returns (-3.0% appreciation + 3.0% rent growth), your $45k cash investment doubles in ~10 years — after that, you're playing with house money.
Negotiation context
- It's been on market 101 days — a 9% lower offer ($146k) is reasonable based on typical stale-listing flexibility.
- 2 sale attempts since 20y ago with the ask held roughly flat each time — persistent listings suggest the price (not the market) is what's stuck; bring a comps-based counter.
- Current owner paid $120k; 33% above their basis — modest negotiation headroom, anchor on the comps not their cost.
Risks & watch-outs
- Climate carrying-cost: extreme-heat days projected 6→15/yr by 2055 (HVAC capex compounding) — expect insurance premiums to compound above CPI over the hold.
Questions for the listing agent
- It's been on market 101 days. Have you received any prior offers? Is the seller open to a 9% concession, seller financing, or rate buy-down credit?
- Why hasn't it sold? Are there any deal-killer items the seller is aware of (foundation, flood, title, zoning, code violations)?
- Is there a deadline driving the sale (1031 exchange, divorce, estate, relocation)? That informs how much negotiation room exists.
- Schools are F-rated, which usually means shorter tenancies and higher turnover. Who's the typical renter profile here, and what's been the actual vacancy rate?
- Crime grade is F in this area — have there been break-ins, vandalism, or insurance claims at this property in the last 3 years? What carrier currently insures it and at what premium?
- What's the average days-on-market for RENTAL listings here right now (not sales)? A rising rental-DOM trend means longer vacancies and softer asking-rent achievability than the comps imply.
- What's the recent tenant-quality profile in this submarket — average credit score on applications, eviction rate, late-payment / NSF rate, and stable-employment percentage? A property-management company in the area should have these aggregated.
- How much new for-sale + rental construction is in the pipeline within 1–3 miles? Heavy new supply typically softens prices + rents 12–24 months out; constrained supply supports both.
Investment metrics
- 1% rule
- 1.12% ✓
- Cap rate
- 9.74%
- Cash-on-cash
- 12.32%
- DSCR
- 1.55
- GRM
- 7.5
CMA / ARV
- ARV (median comp)
- $225,817
- List price
- $160,000
- Delta
- -29.15%
- Verdict
- UNDERPRICED
- Comps
- 20 within 1.0 mi
Projected returns pro-forma
-3.0% appreciation · 3.0% rent growth · sell at horizon
- IRR
- 1.9%
- Equity multiple
- 1.07×
- Total profit
- $3,304
- Equity at exit
- $23,857
- IRR
- 11.5%
- Equity multiple
- 1.90×
- Total profit
- $40,331
- Equity at exit
- $13,834
Cash invested: $44,800 (down + closing). Projections, not guarantees.
Landlord ↔ Tenant lean methodology
- Overall (STATE)
- 71 Landlord-Friendly
- State Nevada
- 71 Landlord-Friendly · R+1
- County
- — inherits STATE
- City
- — inherits STATE
ZIP-level market 89060
- Home prices YoY
- -1.6%
- Active inventory
- 655
- Price-to-rent
- 7.5×
Monthly cashflow live
- Estimated rent
- $1,789 medium interval (Pro) →
- Mortgage (P&I)
- −$839
- Tax from tax record
- −$48 /mo · $573/yr
- Insurance
- −$67
- HOA
- −$0
- Vacancy / Maint / Mgmt
- −$376
- Net cashflow
- $460
Break-even live
Sensitivity live
| Price | -10% $551 | -5% $505 | +0% $460 | +5% $415 | +10% $369 |
|---|---|---|---|---|---|
| Rent | -10% $319 | -5% $389 | +0% $460 | +5% $531 | +10% $601 |
| Rate | -1.0pp $541 | -0.5pp $501 | base $460 | +0.5pp $419 | +1.0pp $376 |
UW: 25.0% down · 7.5% · 30yr · 1.5% tax · 5.0% vac · 8.0% maint · 8.0% mgmt
Financing live
Cash to close
- Down payment
- $40,000
- Closing costs
- $4,800
- Reserves months
- —
- Total cash needed
- —
Loan-product check · same deal, 3 products live
Conventional
25% down · 7.5% · 30yr
- Down + closing
- —
- Monthly P&I
- —
- Monthly cashflow
- —
- DSCR
- —
- Eligible?
- —
Personal DTI + credit; lowest rate.
DSCR
20% down · 8.5% · 30yr
- Down + closing
- —
- Monthly P&I
- —
- Monthly cashflow
- —
- DSCR
- —
- Eligible?
- —
No personal income docs; deal must DSCR.
Hard money
10% down · 12.0% · 12mo
- Down + closing
- —
- Monthly P&I
- —
- Monthly cashflow
- —
- DSCR
- —
- Eligible?
- —
Short-term bridge; refi at stabilization.
Listing history 19 events
-
2026-06-19days on market $160,000 Active 101 DOM
-
2026-06-18days on market $160,000 Active 100 DOM
-
2026-06-17days on market $160,000 Active 99 DOM
-
2026-06-16days on market $160,000 Active 98 DOM
-
2026-06-15days on market $160,000 Active 97 DOM
-
2026-06-14days on market $160,000 Active 95 DOM
-
2026-06-12days on market $160,000 Active 94 DOM
-
2026-06-09days on market $160,000 Active 91 DOM
-
2026-06-08days on market $160,000 Active 90 DOM
-
2026-06-07days on market $160,000 Active 89 DOM
-
2026-06-03days on market $160,000 Active 85 DOM
-
2026-06-02days on market $160,000 Active 84 DOM
-
2026-06-01days on market $160,000 Active 83 DOM
-
2026-05-31days on market $160,000 Active 82 DOM
-
2026-05-30days on market $160,000 Active 81 DOM
-
2026-03-10$160,000 Active 209-char remark
Show marketing remark (209 chars)
Investment opportunity! 3 bed, 2 bath home with 1,128 sq ft on a fully fenced 1-acre lot. Currently tenant-occupied on a month-to-month lease, offering immediate rental income and flexibility for future plans.
-
2007-01-10soldstatus $120,000
-
2007-01-09soldstatus $120,000 186-char remark
Show marketing remark (186 chars)
Nice older manufactured home in good condition. Large living room, separate dining area and laundry room. Split floorplan. Storage shed in back and additional storage on well pump house.
-
2006-08-04$134,000 186-char remark
Show marketing remark (186 chars)
Nice older manufactured home in good condition. Large living room, separate dining area and laundry room. Split floorplan. Storage shed in back and additional storage on well pump house.
ⓘ Source: listings_history table (triggers on properties + properties_extension) + one-shot
backfill from property_details.listing_events for pre-trigger history.
Tax reassessment forecast NV · Resets to sale price
- Current annual tax
- $573 · $48/mo
- Projected year-2 tax
- $944 · $79/mo
- Expected delta
- +$371/yr (+$31/mo · 64.8%)
ⓘ Screening estimate from a state-policy table — verify with the county assessor before closing.
Climate risk First Street
- Flood 1/10 Low FEMA zone X (shaded) · 0% chance over 30 yrs
- Wildfire 3/10 Moderate
- Heat 7/10 Severe 6 d/yr ≥103°F today · 15 d/yr by 30 yrs out
- Wind 1/10 Low
- Air quality 1/10 Low 0 unhealthy d/yr today · 0 by 30 yrs out
Nearby sold comps map
Loading sold comps map…
Walkable amenities ~0.75 mi
Loading nearby amenities…
Taxation est. · year 1
- Rental income
- $21,470
- − Mortgage interest
- −$8,962
- − Property taxes
- −$573
- − Insurance
- −$800
- − Repairs & maintenance
- −$1,718
- − Management
- −$1,718
- − Depreciation
- −$4,655
- Taxable income
- $3,045
- Est. tax owed @ 24.0%
- −$731
- After-tax cash flow
- $4,789/yr
For passive investors: Depreciation is non-cash, so a rental often shows a tax loss while cash-flowing — sheltering income. Rental losses are passive: they offset passive income freely, and up to $25,000/yr can offset ordinary (W-2) income if you actively participate and your MAGI is under $100k (phasing out to $0 by $150k); unused losses carry forward. On sale, claimed depreciation is recaptured at up to 25%, and gains may owe capital-gains tax (a 1031 exchange can defer both). Figures are a year-1 estimate at your 24.0% rate — not tax advice; consult a CPA.
Schools (NCES district)
- District
- Nye County School District
- NCES district ID
- 3200360
- Math proficiency
- 20% ▼ -6.00%
- Reading proficiency
- 33% ▼ -5.00%
- Median HH income
- $41,447
- Composite
- 22.43/100
- National rank
- #8110
- State rank
- #16 of 17 in NV
Livability — Pahrump
- Score
- 68/100
- State rank
- #30
- US rank
- #9226
Category grades
Schools grade is shown separately in the Schools card above.
Census & demographics
- Census place
- Pahrump, NV
- County
- Nye County · 47,491 people
- City population
- 47,491
- Metro
- Pahrump, NV
- Population (ZIP)
- 12,864
- Household income
- $50,000
- Rent vs Own
- Severe rent burden
- 170.0
Population outlook (Nye County) Hauer SSP2
- Today (2025)
- 40,727 people
- By 2030
- 38,812 · -4.7%
- By 2040
- 33,952 · -16.6%
- By 2050
- 29,393 · -27.8%
- By 2075
- 21,122 · -48.1%
- By 2100
- 14,400 · -64.6%
Race, ethnicity, and origin ACS 2023
- Neighborhood character
- Predominantly White (71%)
- Race & ethnicity
- White 71% Hispanic / Latino 20% Two or more races 12% Asian 2% Black 1% Pacific Islander 1%
- Hispanic origin (detail)
- Mexican 16%
- Common ancestry
- Iranian 4% Romanian 3% Lithuanian 2%
- Foreign-born
- 9% · Canada, China
- Languages at home
- 85% English-only · Spanish 12% Other Indo-European 1% German/W. Germanic 1%
Political lean MEDSL · Nye
- 2024 margin
- Solid R (+42.2) · D 28.0% · R 70.2% · Other 1.8%
- 2008→2024 swing
- -28.8pp toward R · 2008: -13.4pp · 2024: -42.2pp
- All cycles
- 2024: R+42.2 2020: R+40.4 2016: R+42.0 2012: R+24.2 2008: R+13.4
Not yet ingested
- Civics
- —
Market trends
- HPI YoY
- ▼ -4.93%
- Current HPI
- 312.3758
- Rent YoY
- —
- Metro
- Pahrump, NV
- State GDP YoY
- ▲ 3.08%
- F500 in state
- 6
Industry mix (Fortune 500 HQ in NV)
| Industry | F500 HQs | Revenue |
|---|---|---|
| Hotels / Casinos | 3 | $36B |
|
||
Price history
+19.4% since first listed4 events — show timeline
- 2026-03-10 Listed $160,000 GLVAR
- 2007-01-10 Sold (Public Records) $120,000 Public Records
- 2007-01-09 Sold (MLS) $120,000 GLVAR
- 2006-08-04 Listed $134,000 GLVAR
Property tax history
+0.2%/yrLatest (2025): $573 · +3.7% YoY. Source: county tax records.
Cash-flow waterfall
monthlySold comps — $/sqft
last 12 mo · ≤1 miLoading sold comps…