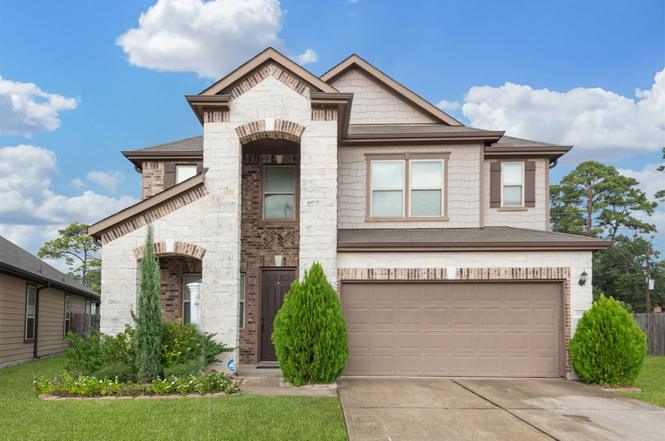
4006 Streambed Trl · Houston, TX
Flood risk 8/10 · Major
- FEMA flood zone
- X (unshaded)
- Chance of flooding over 30 yrs
- 0.99%
- Est. flood insurance / yr
- $507 – $1,088
Fire risk 3/10 · Minor
- Est. fire insurance / yr
- $1,222 – $2,270
Heat risk 9/10 · Severe
- Hot days now (above 111°F)
- 7 days/yr
- Hot days in 30 yrs
- 23 days/yr
Wind risk 8/10 · Major
- Chance of severe wind over 30 yrs
- 99.0%
Air-quality risk 3/10 · Minor
- Unhealthy air days now
- 3 days/yr
- Unhealthy air days in 30 yrs
- 3 days/yr
Risk factors via First Street. Map © Google.
Why this score? — see what drove the B- grade
The composite is a weighted blend of 9 inputs, each scored 0–100. Each bar is that input's sub-score; the figure is the points it added to the 100-point composite (weight × sub-score).
- Cash flow +30.0/30.0
- 1% rule +10.0/10.0
- DSCR +10.0/10.0
- Appreciation +3.9/10.0
- Livability +3.7/5.0
- Rent growth +2.5/5.0
- Condition / age +2.5/5.0
- Schools +2.0/10.0
- ARV discount +1.6/15.0
$390,000
🖨 Deal sheet 📄 Offer letter ✓ Due diligence
Listing remarks MLS
Feel right at home in this newly constructed home in the family-friendly subdivision of Cypress Creek Crossing! This beautiful home features stone and brick elevation and spacious rooms. The gourmet kitchen is fit with granite countertops and a corner pantry while the master en-suite features a large tub and double vanity. Only a short commute from 249 and the Grand Parkway. Short distance from the Vintage Park shopping and dining area. This beautiful new home awaits you, call today!
Key facts
- Large backyard
- Versatile game room
- 9,273 sq ft lot
Tags
Neighborhood map
What this means for you Summary
Snapshot
- This is a 5-bed/3.5-bath single-family listed at $390k.
Deal economics
- At list price, monthly cash flow is $3k ($33k/yr) — positive.
- The deal already cash-flows at list — no discount required.
- Meets the 1% rule at list price ($7k rent vs $390k).
- Recommended offer: $343k (12.0% below list) — sets the bar for market timing.
- Cap rate 14.9% vs local median 3.2% in Houston — top-decile yield for the area; either an underpriced asset or a hidden risk that comps aren't pricing in. Stress-test before assuming the spread holds.
Location & tenants
- Location reads 74/100 on livability (#184 in TX, #4,771 nationally) — a middle-class / working-renter tenant base. Strengths: amenities A+, cost of living A+, housing A+; Watch: crime F.
- Spring ISD (suburban): math 19% / reading 26% proficiency, ranked #730 of 826 in TX (top 88%) — low school quality limits family demand, transient renter base, plan for 1-2y turnover; 66% free/reduced lunch — lower-income household profile, screen leases tightly.
- Zoned schools: Pat Reynolds El (math 18% / reading 28%, grade F, #3,277 of 4,322 statewide, top 77%, 836 students, 86% FRL); Edwin M Wells Middle (math 8% / reading 17%, grade F, #1,616 of 1,662 statewide, top 97%, 907 students, 89% FRL); Westfield H S (math 13% / reading 17%, grade F, #1,507 of 1,632 statewide, top 93%, 2,574 students, 81% FRL) — zoned schools average 86% FRL vs 66% district-wide (19 pts higher); higher-poverty schools than district average — tighter screening recommended.
- Market conditions: 117 active listings in the ZIP; 3 comparable units currently listed for rent nearby; rentals at typical pace (median 22d on market — plan ~3-4 weeks tenant-placement turnaround); 29,883 units permitted in Harris County in 2024 (8,621 in 5+ unit buildings).
Forward outlook
- Local home prices are declining (-2.1%/yr); year-one equity from $3k of loan paydown is wiped out by about $8k of value loss. Plan a longer hold.
- Harris County population projected at +47% by 2050 — long-run rental-demand tailwind backs the buy-and-hold thesis.
- At projected returns (-2.1% appreciation + 3.0% rent growth), your $109k cash investment doubles in ~4 years — after that, you're playing with house money.
Negotiation context
- It's been on market 137 days — a 12% lower offer ($343k) is reasonable based on typical stale-listing flexibility.
- 2 sale attempts since 9y ago; this cycle's ask is 99900% above the opening price — seller raised mid-cycle; expect resistance to lowballs.
Risks & watch-outs
- Watch-outs: flood insurance adds $66/mo.
- Climate carrying-cost: severe flood risk; severe wind risk, 99% chance of damaging wind over 30y; extreme-heat days projected 7→23/yr by 2055 (HVAC capex compounding) — expect insurance premiums to compound above CPI over the hold.
Questions for the listing agent
- It's been on market 137 days. Have you received any prior offers? Is the seller open to a 12% concession, seller financing, or rate buy-down credit?
- What's the actual annual flood-insurance premium (NFIP or private), and is the property in a SFHA with mandatory coverage?
- What does the HOA fee cover, when was the last increase, and are there any pending special assessments or reserve-fund shortfalls?
- Why hasn't it sold? Are there any deal-killer items the seller is aware of (foundation, flood, title, zoning, code violations)?
- Is there a deadline driving the sale (1031 exchange, divorce, estate, relocation)? That informs how much negotiation room exists.
- Schools are D-rated, which usually means shorter tenancies and higher turnover. Who's the typical renter profile here, and what's been the actual vacancy rate?
- Crime grade is F in this area — have there been break-ins, vandalism, or insurance claims at this property in the last 3 years? What carrier currently insures it and at what premium?
- What's the average days-on-market for RENTAL listings here right now (not sales)? A rising rental-DOM trend means longer vacancies and softer asking-rent achievability than the comps imply.
- What's the recent tenant-quality profile in this submarket — average credit score on applications, eviction rate, late-payment / NSF rate, and stable-employment percentage? A property-management company in the area should have these aggregated.
- How much new for-sale + rental construction is in the pipeline within 1–3 miles? Heavy new supply typically softens prices + rents 12–24 months out; constrained supply supports both.
Investment metrics
- 1% rule
- 1.89% ✓
- Cap rate
- 14.93%
- Cash-on-cash
- 30.86%
- DSCR
- 2.37
- GRM
- 4.4
CMA / ARV
- ARV (on-the-fly)
- $344,537
- Comps found
- 12
Show comp detail 12 sales within ~0.75 mi
| Address | Dist | Beds/Ba | Sqft | Sold | Price | $/sf | Match |
|---|---|---|---|---|---|---|---|
| 4022 Streambed Trl | 0.04mi | 4/2.5 (-1) | 2,792 (-8%) | 2mo | $325,000 | $116 | 74 |
| 15515 San Milo Dr | 0.45mi | 4/3.5 (-1) | 3,056 (+0%) | 2mo | $345,000 | $113 | 72 |
| 15406 Falling Creek Dr | 0.43mi | 4/2.5 (-1) | 2,950 (-3%) | 3mo | $315,000 | $107 | 63 |
| 4218 Bayglen Ct | 0.68mi | 4/3.5 (-1) | 3,042 (-0%) | 2mo | $384,786 | $126 | 61 |
| 15302 Walters Rd | 0.57mi | 4/2.5 (-1) | 3,059 (+0%) | 4mo | $215,000 | $70 | 61 |
| 3614 Shanemoss Ct | 0.45mi | 4/2.5 (-1) | 2,852 (-6%) | 2mo | $299,990 | $105 | 58 |
| 15727 Misty Hollow Dr | 0.74mi | 4/3.5 (-1) | 3,119 (+2%) | 1mo | $359,000 | $115 | 56 |
| 15518 San Milo Dr | 0.46mi | 4/3.5 (-1) | 3,383 (+11%) | 2mo | $329,000 | $97 | 54 |
| 15007 Walters Rd | 0.44mi | 4/2.5 (-1) | 2,730 (-10%) | 1mo | $279,900 | $103 | 52 |
| 4418 Windmill Run Dr | 0.64mi | 4/3.0 (-1) | 2,760 (-10%) | 0mo | $332,000 | $120 | 47 |
| 4215 False Cypress Ln | 0.37mi | 4/2.5 (-1) | 2,596 (-15%) | 3mo | $285,000 | $110 | 47 |
| 15714 Misty Hollow Dr | 0.69mi | 5/3.5 | 3,462 (+14%) | 1mo | $399,900 | $116 | 45 |
Match score weights: distance 35% · size 25% · config 20% · recency 20%. Top-matched comps best support the ARV.
Projected returns pro-forma
-2.14% appreciation · 3.0% rent growth · sell at horizon
- IRR
- 26.6%
- Equity multiple
- 2.15×
- Total profit
- $126,055
- Equity at exit
- $73,341
- IRR
- 33.1%
- Equity multiple
- 4.19×
- Total profit
- $348,659
- Equity at exit
- $60,401
Cash invested: $109,200 (down + closing). Projections, not guarantees.
Landlord ↔ Tenant lean methodology
- Overall (STATE)
- 87 Strongly Landlord-Friendly
- State Texas
- 87 Strongly Landlord-Friendly · R+5
- County
- — inherits STATE
- City
- — inherits STATE
ZIP-level market 77068
- Home prices YoY
- -1.0%
- Active inventory
- 117
- Price-to-rent
- 4.4×
Monthly cashflow live
- Estimated rent
- $7,352 medium interval (Pro) →
- Mortgage (P&I)
- −$2,045
- Tax from tax record
- −$723 /mo · $8,677/yr
- Insurance
- −$162
- Flood insurance flood zone
- −$66 /mo · $798/yr
- HOA
- −$69
- Vacancy / Maint / Mgmt
- −$1,544
- Net cashflow
- $2,742
Break-even live
UW: 25.0% down · 7.5% · 30yr · 1.5% tax · 5.0% vac · 8.0% maint · 8.0% mgmt
Financing live
Cash to close
- Down payment
- $97,500
- Closing costs
- $11,700
- Reserves months
- —
- Total cash needed
- —
Loan-product check · same deal, 3 products live
Conventional
25% down · 7.5% · 30yr
- Down + closing
- —
- Monthly P&I
- —
- Monthly cashflow
- —
- DSCR
- —
- Eligible?
- —
Personal DTI + credit; lowest rate.
DSCR
20% down · 8.5% · 30yr
- Down + closing
- —
- Monthly P&I
- —
- Monthly cashflow
- —
- DSCR
- —
- Eligible?
- —
No personal income docs; deal must DSCR.
Hard money
10% down · 12.0% · 12mo
- Down + closing
- —
- Monthly P&I
- —
- Monthly cashflow
- —
- DSCR
- —
- Eligible?
- —
Short-term bridge; refi at stabilization.
Rent comps 3 comps
| Address | Beds | Baths | Sqft | Rent | $/sqft | DOM | Units | Dist |
|---|---|---|---|---|---|---|---|---|
| 4622 Falling Sun Dr Houston, TX | 4.0 | 3.0 | 2485 | $2,500 | $1.01 | 43d | 1 | 0.74mi |
| 5135 Westerham Pl Unit 1262307P Houston, TX | 5.0 | 3.5 | 3358 | $17,582 | $5.24 | 22d | 1 | 1.29mi |
| 5415 Olympia Fields Ln Houston, TX | 4.0 | 4.0 | 4163 | $3,500 | $0.84 | 3d | 1 | 1.49mi |
HOA detail
- Monthly dues
- $69 · $828/yr
Listing history 22 events
-
2026-06-18days on market $390,000 Active 137 DOM
-
2026-06-17days on market $390,000 Active 136 DOM
-
2026-06-16days on market $390,000 Active 135 DOM
-
2026-06-15days on market $390,000 Active 134 DOM
-
2026-06-13days on market $390,000 Active 132 DOM
-
2026-06-13days on market $390,000 Active 131 DOM
-
2026-06-09days on market $390,000 Active 128 DOM
-
2026-06-08days on market $390,000 Active 127 DOM
-
2026-06-07days on market $390,000 Active 126 DOM
-
2026-06-04days on market $390,000 Active 123 DOM
-
2026-06-03days on market $390,000 Active 122 DOM
-
2026-06-02days on market $390,000 Active 121 DOM
-
2026-06-01days on market $390,000 Active 120 DOM
-
2026-05-31days on market $390,000 Active 119 DOM
-
2026-04-30status Pending
-
2026-04-25status Pending
-
2026-01-05price $390,000
-
2026-01-05$390 Active
-
2017-05-26soldstatus Sold 488-char remark
Show marketing remark (488 chars)
Feel right at home in this newly constructed home in the family-friendly subdivision of Cypress Creek Crossing! This beautiful home features stone and brick elevation and spacious rooms. The gourmet kitchen is fit with granite countertops and a corner pantry while the master en-suite features a large tub and double vanity. Only a short commute from 249 and the Grand Parkway. Short distance from the Vintage Park shopping and dining area. This beautiful new home awaits you, call today!
-
2017-04-11status Pending 488-char remark
Show marketing remark (488 chars)
Feel right at home in this newly constructed home in the family-friendly subdivision of Cypress Creek Crossing! This beautiful home features stone and brick elevation and spacious rooms. The gourmet kitchen is fit with granite countertops and a corner pantry while the master en-suite features a large tub and double vanity. Only a short commute from 249 and the Grand Parkway. Short distance from the Vintage Park shopping and dining area. This beautiful new home awaits you, call today!
-
2017-04-06price $244,995 488-char remark
Show marketing remark (488 chars)
Feel right at home in this newly constructed home in the family-friendly subdivision of Cypress Creek Crossing! This beautiful home features stone and brick elevation and spacious rooms. The gourmet kitchen is fit with granite countertops and a corner pantry while the master en-suite features a large tub and double vanity. Only a short commute from 249 and the Grand Parkway. Short distance from the Vintage Park shopping and dining area. This beautiful new home awaits you, call today!
-
2017-03-29$249,995 Active 488-char remark
Show marketing remark (488 chars)
Feel right at home in this newly constructed home in the family-friendly subdivision of Cypress Creek Crossing! This beautiful home features stone and brick elevation and spacious rooms. The gourmet kitchen is fit with granite countertops and a corner pantry while the master en-suite features a large tub and double vanity. Only a short commute from 249 and the Grand Parkway. Short distance from the Vintage Park shopping and dining area. This beautiful new home awaits you, call today!
ⓘ Source: listings_history table (triggers on properties + properties_extension) + one-shot
backfill from property_details.listing_events for pre-trigger history.
Tax reassessment forecast TX · Resets to sale price
- Current annual tax
- $8,677 · $723/mo
- Projected year-2 tax
- $8,677 · $723/mo
- Expected delta
- $0/yr ($0/mo · 0.0%)
ⓘ Screening estimate from a state-policy table — verify with the county assessor before closing.
Climate risk First Street
- Flood 8/10 Severe FEMA zone X (unshaded) · 99% chance over 30 yrs
- Wildfire 3/10 Moderate
- Heat 9/10 Extreme 7 d/yr ≥111°F today · 23 d/yr by 30 yrs out
- Wind 8/10 Severe 99% chance of damaging wind over 30 yrs
- Air quality 3/10 Moderate 3 unhealthy d/yr today · 3 by 30 yrs out
Nearby sold comps map
Loading sold comps map…
Walkable amenities ~0.75 mi
Loading nearby amenities…
Taxation est. · year 1
- Rental income
- $88,225
- − Mortgage interest
- −$21,846
- − Property taxes
- −$8,677
- − Insurance
- −$2,748
- − Repairs & maintenance
- −$7,058
- − Management
- −$7,058
- − HOA
- −$828
- − Depreciation
- −$11,345
- Taxable income
- $28,665
- Est. tax owed @ 24.0%
- −$6,880
- After-tax cash flow
- $26,023/yr
For passive investors: Depreciation is non-cash, so a rental often shows a tax loss while cash-flowing — sheltering income. Rental losses are passive: they offset passive income freely, and up to $25,000/yr can offset ordinary (W-2) income if you actively participate and your MAGI is under $100k (phasing out to $0 by $150k); unused losses carry forward. On sale, claimed depreciation is recaptured at up to 25%, and gains may owe capital-gains tax (a 1031 exchange can defer both). Figures are a year-1 estimate at your 24.0% rate — not tax advice; consult a CPA.
Schools (NCES district)
- District
- Spring ISD
- NCES district ID
- 4841220
- Math proficiency
- 19% ▼ -13.00%
- Reading proficiency
- 26% ▼ -6.00%
- Median HH income
- $51,584
- Composite
- 20.12/100
- National rank
- #8643
- State rank
- #730 of 826 in TX
Livability — Houston
- Score
- 74/100
- State rank
- #184
- US rank
- #4771
Category grades
Schools grade is shown separately in the Schools card above.
Census & demographics
- City population
- 3,226,434
- Population (ZIP)
- 12,289
Population outlook (Harris County) Hauer SSP2
- Today (2025)
- 5,571,493 people
- By 2030
- 6,089,821 · +9.3%
- By 2040
- 7,142,806 · +28.2%
- By 2050
- 8,185,864 · +46.9%
- By 2075
- 10,574,329 · +89.8%
- By 2100
- 12,109,958 · +117.4%
Race, ethnicity, and origin ACS 2023
- Neighborhood character
- Highly diverse neighborhood (Simpson 0.72)
- Race & ethnicity
- Hispanic / Latino 35% Black 31% White 23% Two or more races 11% Asian 6% Native American 1%
- Hispanic origin (detail)
- Mexican 27%
- Common ancestry
- Scandinavian 2% Romanian 1% Serbian 1%
- Foreign-born
- 21% · Canada, Vietnam, China
- Languages at home
- 65% English-only · Spanish 28% Vietnamese 4% Chinese 1%
Political lean MEDSL · Harris
- 2024 margin
- Lean D (+5.5) · D 52.0% · R 46.4% · Other 1.6%
- 2008→2024 swing
- +3.9pp toward D · 2008: 1.6pp · 2024: 5.5pp
- All cycles
- 2024: D+5.5 2020: D+13.3 2016: D+12.4 2012: D+0.1 2008: D+1.6
Not yet ingested
- Civics
- —
Market trends
- HPI YoY
- ▼ -2.14%
- Current HPI
- 206.5475
- Rent YoY
- —
- Metro
- —
- State GDP YoY
- ▲ 3.95%
- F500 in state
- 110
Industry mix (Fortune 500 HQ in TX)
| Industry | F500 HQs | Revenue |
|---|---|---|
| Energy | 16 | $1,198B |
|
||
| Technology | 5 | $198B |
|
||
| Engineering / Construction | 4 | $72B |
|
||
| Energy Services | 3 | $60B |
|
||
| Utilities | 3 | $41B |
|
||
| Healthcare | 2 | $330B |
|
||
Price history
+56.0% since first listed8 events — show timeline
- 2026-04-30 Pending — HARMLS
- 2026-04-25 Pending — HARMLS
- 2026-01-05 Price Changed $390,000 HARMLS
- 2026-01-05 Listed $390 HARMLS
- 2017-05-26 Sold (MLS) — HARMLS
- 2017-04-11 Pending — HARMLS
- 2017-04-06 Price Changed $244,995 HARMLS
- 2017-03-29 Listed $249,995 HARMLS
Property tax history
+11.8%/yrLatest (2025): $8,677 · +1.1% YoY. Source: county tax records.
Cash-flow waterfall
monthlySold comps — $/sqft
last 12 mo · ≤1 miLoading sold comps…