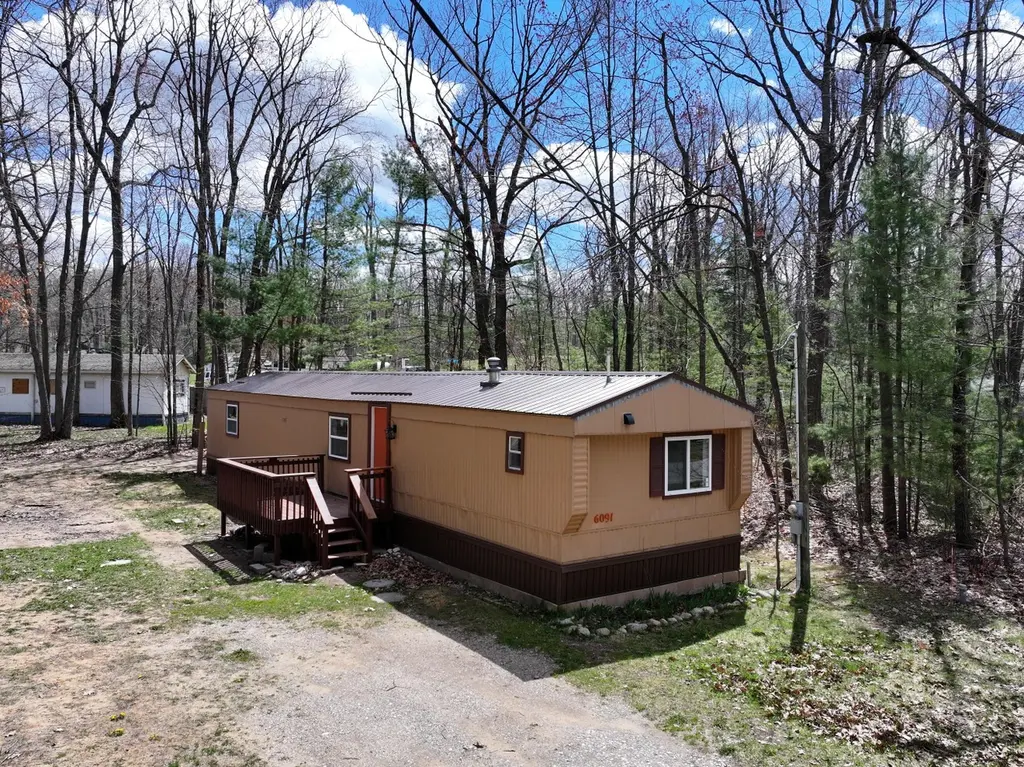
6091 Kellogg Dr · Otsego Lake, MI
Flood risk 1/10 · Minimal
- FEMA flood zone
- —
- Chance of flooding over 30 yrs
- 0.0%
- Est. flood insurance / yr
- —
Fire risk 3/10 · Minor
- Est. fire insurance / yr
- $784 – $1,456
Heat risk 1/10 · Minimal
- Hot days now (above 93°F)
- 7 days/yr
- Hot days in 30 yrs
- 13 days/yr
Wind risk 1/10 · Minimal
- Chance of severe wind over 30 yrs
- —
Air-quality risk 1/10 · Minimal
- Unhealthy air days now
- 0 days/yr
- Unhealthy air days in 30 yrs
- 0 days/yr
Risk factors via First Street. Map © Google.
Why this score? — see what drove the C grade
The composite is a weighted blend of 9 inputs, each scored 0–100. Each bar is that input's sub-score; the figure is the points it added to the 100-point composite (weight × sub-score).
- Cash flow +26.3/30.0
- DSCR +8.9/10.0
- 1% rule +6.3/10.0
- ARV discount +6.0/15.0
- Schools +4.1/10.0
- Rent growth +2.5/5.0
- Livability +2.5/5.0
- Condition / age +2.5/5.0
- Appreciation +0.0/10.0
$115,000
🖨 Deal sheet 📄 Offer letter ✓ Due diligence
Listing remarks
Completely remodeled 3-bedroom, 2-bath home located just minutes from downtown Gaylord. This home features a desirable split floor plan with the primary suite on one side and two additional bedrooms on the other. Recent updates include a new roof, brand new bathrooms, a tiled walk-in shower in the primary suite, new appliances, new flooring, fresh paint, and more. Be sure to check the full list of upgrades in the documents. Renovated inside and out & move-in ready! Conveniently located near I-75, shopping, restaurants, and Otsego Lake. Seller is a licensed real estate agent.
Key facts
- Remodeled
- Tiled walk-in shower
- Split floor plan
Tags
Property features AI
Finance
- Other: Lot is approximately 0.23 acres (dimensions 80 x 125 x 80 x 125); Paved road access; Zoned R-3
Exterior
- Security: Smoke detector(s)
- Utilities: Well water; Septic sewer
- Home design: Single family residence; Residential property
- Construction: Pillar/post/pier foundation; Built prior to or in 2026
- Exterior features: Deck
Interior
- Kitchen: Microwave; Refrigerator; Oven; Range
- Bedrooms: Primary bedroom located on the main level
- Flooring: Simulated wood flooring
- Bathrooms: 2 full bathrooms; Accessible full bath
- Heating & cooling: Forced air heating (natural gas); Ceiling fan(s)
- Interior features: Walk-in closet(s); Main bedroom on ground floor
- Laundry & utility: Laundry located on the main level
Neighborhood map
What this means for you Summary
Snapshot
- This is a 3-bed/2.0-bath single-family listed at $115k.
Deal economics
- At list price, monthly cash flow is $298 ($4k/yr) — positive.
- The deal already cash-flows at list — no discount required.
- Meets the 1% rule at list price ($1k rent vs $115k).
- Recommended offer: $112k (3.0% below list) — sets the bar for market timing.
Location & tenants
- Location reads: area grade C — affects rentability + tenant quality, not the cash-flow math above.
- Gaylord Community Schools (rural): math 43% / reading 53% proficiency, ranked #123 of 540 in MI (top 23%) — families likely to look elsewhere, expect single-tenant / working-renter base with shorter leases.
- Market conditions: 206 active listings in the ZIP; 24 units permitted in Otsego County in 2024 (0 in 5+ unit buildings).
Forward outlook
- Local home prices are declining (-3.0%/yr); year-one equity from $795 of loan paydown is wiped out by about $3k of value loss. Plan a longer hold.
- Otsego County population projected at -11% by 2050 — secular population decline; favor cash flow + early exit over multi-decade hold.
- At projected returns (-3.0% appreciation + 3.0% rent growth), your $32k cash investment doubles in ~10 years — after that, you're playing with house money.
Negotiation context
- It's been on market 51 days — a 3% lower offer ($112k) is reasonable based on typical stale-listing flexibility.
- 2 sale attempts since 12y ago; this cycle's ask has dropped $14k (11%) from the opening price — seller is motivated, your offer sets the floor, not the list.
- Current owner paid $48k; list at $115k implies a 137% gain — meaningful room to come down on a strong offer.
Questions for the listing agent
- It's been on market 51 days. Have you received any prior offers? Is the seller open to a 3% concession, seller financing, or rate buy-down credit?
- Is there a deadline driving the sale (1031 exchange, divorce, estate, relocation)? That informs how much negotiation room exists.
- What's the average days-on-market for RENTAL listings here right now (not sales)? A rising rental-DOM trend means longer vacancies and softer asking-rent achievability than the comps imply.
- What's the recent tenant-quality profile in this submarket — average credit score on applications, eviction rate, late-payment / NSF rate, and stable-employment percentage? A property-management company in the area should have these aggregated.
- How much new for-sale + rental construction is in the pipeline within 1–3 miles? Heavy new supply typically softens prices + rents 12–24 months out; constrained supply supports both.
Investment metrics
- 1% rule
- 1.13% ✓
- Cap rate
- 9.40%
- Cash-on-cash
- 11.11%
- DSCR
- 1.49
- GRM
- 7.4
CMA / ARV
- ARV (median comp)
- $111,329
- List price
- $115,000
- Delta
- 3.30%
- Verdict
- FAIR
- Comps
- 19 within 1.0 mi
Show comp detail 4 sales within ~0.75 mi
| Address | Dist | Beds/Ba | Sqft | Sold | Price | $/sf | Match |
|---|---|---|---|---|---|---|---|
| 510 Edelweiss Trl | 0.18mi | 2/2.0 (-1) | 1,000 (+2%) | 9mo | $60,000 | $60 | 75 |
| 434 Trillium Trl | 0.21mi | 2/1.0 (-1) | 980 (0%) | 12mo | $90,000 | $92 | 71 |
| 976 Lakeview Ave | 0.34mi | 2/1.0 (-1) | 1,040 (+6%) | 2mo | $415,000 | $399 | 64 |
| 654 Sharon St | 0.74mi | 2/2.0 (-1) | 1,064 (+9%) | 14mo | $135,000 | $127 | 34 |
Match score weights: distance 35% · size 25% · config 20% · recency 20%. Top-matched comps best support the ARV.
Projected returns pro-forma
-3.0% appreciation · 3.0% rent growth · sell at horizon
- IRR
- 0.3%
- Equity multiple
- 1.01×
- Total profit
- $335
- Equity at exit
- $17,147
- IRR
- 9.9%
- Equity multiple
- 1.77×
- Total profit
- $24,657
- Equity at exit
- $9,943
Cash invested: $32,200 (down + closing). Projections, not guarantees.
Landlord ↔ Tenant lean methodology
- Overall (STATE)
- 62 Landlord-Friendly
- State Michigan
- 62 Landlord-Friendly · EVEN
- County
- — inherits STATE
- City
- — inherits STATE
ZIP-level market 49735
- Home prices YoY
- -27.8%
- Active inventory
- 206
- Price-to-rent
- 7.4×
Monthly cashflow live
- Estimated rent
- $1,297 medium interval (Pro) →
- Mortgage (P&I)
- −$603
- Tax from tax record
- −$76 /mo · $909/yr
- Insurance
- −$48
- HOA
- −$0
- Vacancy / Maint / Mgmt
- −$272
- Net cashflow
- $298
Break-even live
UW: 25.0% down · 7.5% · 30yr · 1.5% tax · 5.0% vac · 8.0% maint · 8.0% mgmt
Financing live
Cash to close
- Down payment
- $28,750
- Closing costs
- $3,450
- Reserves months
- —
- Total cash needed
- —
Loan-product check · same deal, 3 products live
Conventional
25% down · 7.5% · 30yr
- Down + closing
- —
- Monthly P&I
- —
- Monthly cashflow
- —
- DSCR
- —
- Eligible?
- —
Personal DTI + credit; lowest rate.
DSCR
20% down · 8.5% · 30yr
- Down + closing
- —
- Monthly P&I
- —
- Monthly cashflow
- —
- DSCR
- —
- Eligible?
- —
No personal income docs; deal must DSCR.
Hard money
10% down · 12.0% · 12mo
- Down + closing
- —
- Monthly P&I
- —
- Monthly cashflow
- —
- DSCR
- —
- Eligible?
- —
Short-term bridge; refi at stabilization.
Listing history 19 events
-
2026-06-18days on market $115,000 Active 51 DOM
-
2026-06-17days on market $115,000 Active 50 DOM
-
2026-06-16days on market $115,000 Active 49 DOM
-
2026-06-15days on market $115,000 Active 48 DOM
-
2026-06-13days on market $115,000 Active 46 DOM
-
2026-06-12days on market $115,000 Active 45 DOM
-
2026-06-09days on market $115,000 Active 42 DOM
-
2026-06-08days on market $115,000 Active 41 DOM
-
2026-06-07days on market $115,000 Active 40 DOM
-
2026-06-07days on market $115,000 Active 39 DOM
-
2026-06-04days on market $115,000 Active 36 DOM
-
2026-06-02days on market $115,000 Active 35 DOM
-
2026-06-01days on market $115,000 Active 34 DOM
-
2026-05-31days on market $115,000 Active 33 DOM
-
2026-05-31days on market $115,000 Active 32 DOM
-
2026-05-15price $115,000 587-char remark
-
2026-04-28$129,000 Active 587-char remark
-
2014-12-23soldstatus $48,500
-
2014-07-17$34,900
ⓘ Source: listings_history table (triggers on properties + properties_extension) + one-shot
backfill from property_details.listing_events for pre-trigger history.
Tax reassessment forecast MI · Partial reset (capped growth)
- Current annual tax
- $909 · $76/mo
- Projected year-2 tax
- $1,340 · $112/mo
- Expected delta
- +$431/yr (+$36/mo · 47.4%)
ⓘ Screening estimate from a state-policy table — verify with the county assessor before closing.
Climate risk First Street
- Flood 1/10 Low 0% chance over 30 yrs
- Wildfire 3/10 Moderate
- Heat 1/10 Low 7 d/yr ≥93°F today · 13 d/yr by 30 yrs out
- Wind 1/10 Low
- Air quality 1/10 Low 0 unhealthy d/yr today · 0 by 30 yrs out
Nearby sold comps map
Loading sold comps map…
Walkable amenities ~0.75 mi
Loading nearby amenities…
Taxation est. · year 1
- Rental income
- $15,569
- − Mortgage interest
- −$6,442
- − Property taxes
- −$909
- − Insurance
- −$575
- − Repairs & maintenance
- −$1,245
- − Management
- −$1,245
- − Depreciation
- −$3,345
- Taxable income
- $1,806
- Est. tax owed @ 24.0%
- −$434
- After-tax cash flow
- $3,145/yr
For passive investors: Depreciation is non-cash, so a rental often shows a tax loss while cash-flowing — sheltering income. Rental losses are passive: they offset passive income freely, and up to $25,000/yr can offset ordinary (W-2) income if you actively participate and your MAGI is under $100k (phasing out to $0 by $150k); unused losses carry forward. On sale, claimed depreciation is recaptured at up to 25%, and gains may owe capital-gains tax (a 1031 exchange can defer both). Figures are a year-1 estimate at your 24.0% rate — not tax advice; consult a CPA.
Schools (NCES district)
- District
- Gaylord Community Schools
- NCES district ID
- 2615730
- Math proficiency
- 43% ▼ -5.00%
- Reading proficiency
- 53% ▼ -5.00%
- Median HH income
- $48,682
- Composite
- 40.97/100
- National rank
- #3597
- State rank
- #123 of 540 in MI
Livability — Otsego Lake
No livability data for this city. (Only ~50 U.S. cities are tracked.)
Census & demographics
- Population (ZIP)
- 20,678
Population outlook (Otsego County) Hauer SSP2
- Today (2025)
- 24,175 people
- By 2030
- 23,836 · -1.4%
- By 2040
- 22,718 · -6.0%
- By 2050
- 21,411 · -11.4%
- By 2075
- 18,864 · -22.0%
- By 2100
- 15,011 · -37.9%
Race, ethnicity, and origin ACS 2023
- Neighborhood character
- Predominantly White (93%)
- Race & ethnicity
- White 93% Two or more races 4% Hispanic / Latino 2%
- Common ancestry
- Romanian 12% Lithuanian 6% Slovak 2%
- Foreign-born
- 1% · Canada
- Languages at home
- 97% English-only · Other Indo-European 1% German/W. Germanic 1%
Political lean MEDSL · Otsego
- 2024 margin
- Solid R (+35.3) · D 31.6% · R 67.0% · Other 1.4%
- 2008→2024 swing
- -26.5pp toward R · 2008: -8.9pp · 2024: -35.3pp
- All cycles
- 2024: R+35.3 2020: R+34.1 2016: R+37.6 2012: R+19.7 2008: R+8.9
Not yet ingested
- Civics
- —
Market trends
- HPI YoY
- ▼ -94.52%
- Current HPI
- 245.8639
- Rent YoY
- —
- Metro
- —
- State GDP YoY
- ▲ 1.37%
- F500 in state
- 28
Industry mix (Fortune 500 HQ in MI)
| Industry | F500 HQs | Revenue |
|---|---|---|
| Automotive Parts | 3 | $48B |
|
||
| Automotive | 2 | $372B |
|
||
| Chemicals | 1 | $45B |
|
||
| Automotive Retail | 1 | $29B |
|
||
| Healthcare / Medical Devices | 1 | $23B |
|
||
| Automotive Technology | 1 | $20B |
|
||
Price history
+229.5% since first listed4 events — show timeline
- 2026-05-15 Price Changed $115,000 WWMLS
- 2026-04-28 Listed $129,000 WWMLS
- 2014-12-23 Sold (Public Records) $48,500 Public Records
- 2014-07-17 Listed $34,900 WWMLS
Property tax history
+8.9%/yrLatest (2025): $909 · +27.6% YoY. Source: county tax records.
Cash-flow waterfall
monthlySold comps — $/sqft
last 12 mo · ≤1 miLoading sold comps…