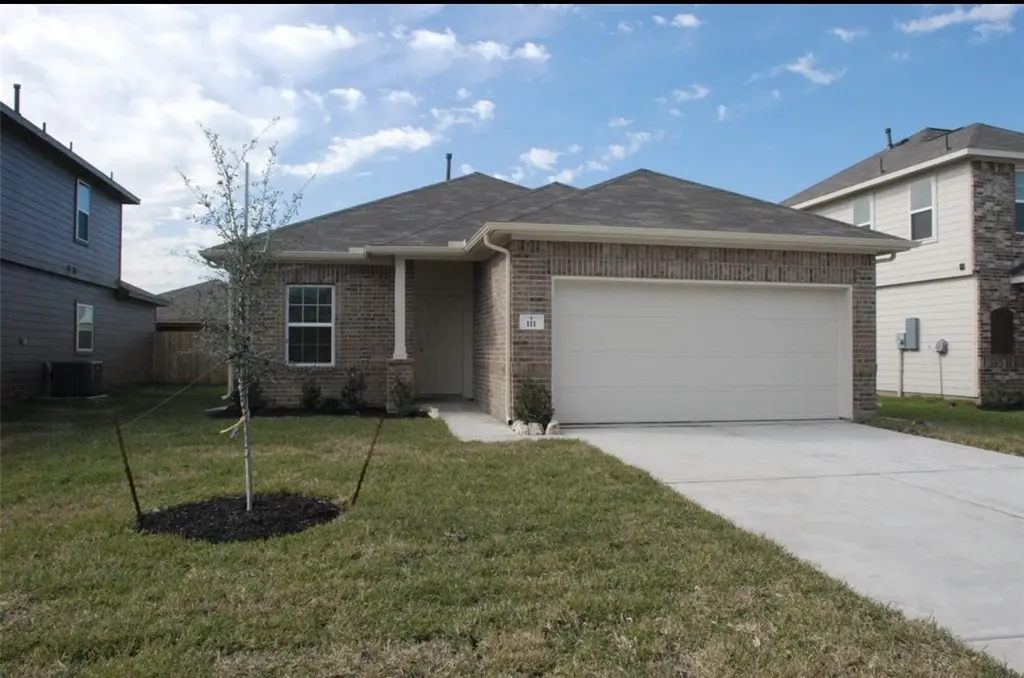
111 Cheyenne River Dr · La Marque, TX
Flood risk 9/10 · Severe
- FEMA flood zone
- X (shaded)
- Chance of flooding over 30 yrs
- 0.99%
- Est. flood insurance / yr
- $507 – $1,088
Fire risk 4/10 · Minor
- Est. fire insurance / yr
- $1,222 – $2,270
Heat risk 10/10 · Severe
- Hot days now (above 110°F)
- 7 days/yr
- Hot days in 30 yrs
- 28 days/yr
Wind risk 9/10 · Severe
- Chance of severe wind over 30 yrs
- 99.0%
Air-quality risk 3/10 · Minor
- Unhealthy air days now
- 2 days/yr
- Unhealthy air days in 30 yrs
- 2 days/yr
Risk factors via First Street. Map © Google.
Why this score? — see what drove the C- grade
The composite is a weighted blend of 9 inputs, each scored 0–100. Each bar is that input's sub-score; the figure is the points it added to the 100-point composite (weight × sub-score).
- Cash flow +16.8/30.0
- ARV discount +11.5/15.0
- 1% rule +5.7/10.0
- DSCR +5.2/10.0
- Rent growth +3.5/5.0
- Schools +3.5/10.0
- Livability +3.0/5.0
- Condition / age +2.5/5.0
- Appreciation +0.0/10.0
$227,000
🖨 Deal sheet 📄 Offer letter ✓ Due diligence
Listing remarks MLS
This 4-2-2 house is upgraded and well-maintained. Upgrades include matching tiles in the living and wet areas, garden bath with separate shower, granite countertops, high cabinets, 2024 fence, 2025 new carpet and painting and a lot more. Must see and call your agent for a showing now!
Key facts
- 2024 fence
- New carpet
- Garden bath
Tags
Neighborhood map
What this means for you Summary
Snapshot
- This is a 4-bed/2.0-bath single-family listed at $227k.
Deal economics
- At list price, monthly cash flow is $80 ($961/yr) — positive.
- The deal already cash-flows at list — no discount required.
- Meets the 1% rule at list price ($2k rent vs $227k).
- Recommended offer: $200k (12.0% below list) — sets the bar for market timing.
- Cap rate 7.1% vs local median 5.6% in La Marque — meaningfully above typical; check what's discounted (condition, days-on-market, listing class) to confirm the premium yield is real.
Location & tenants
- Location reads 59/100 on livability (#1,136 in TX) — a working-class tenant base; expect higher turnover. Strengths: cost of living A+, housing A+; Watch: employment D, schools F, crime F.
- Santa Fe ISD (suburban): math 38% / reading 39% proficiency, ranked #385 of 826 in TX (top 47%) — families likely to look elsewhere, expect single-tenant / working-renter base with shorter leases.
- Market conditions: Rents rising (+4.0%/yr); 654 active listings in the ZIP; 6 comparable units currently listed for rent nearby; rentals leasing fast (median 11d on market — plan ~1-2 weeks tenant-placement turnaround); 3,258 units permitted in Galveston County in 2024 (0 in 5+ unit buildings).
- This rent runs 39% of the median local income ($75k/yr) — at the standard rent-burdened threshold; future hikes will face affordability resistance.
Forward outlook
- Local home prices are declining (-3.0%/yr); year-one equity from $2k of loan paydown is wiped out by about $7k of value loss. Plan a longer hold.
- Galveston County population projected at +43% by 2050 — long-run rental-demand tailwind backs the buy-and-hold thesis.
Negotiation context
- It's been on market 141 days — a 12% lower offer ($200k) is reasonable based on typical stale-listing flexibility.
- 4 sale attempts since 11y ago; this cycle's ask has dropped $26k (10%) from the opening price — seller is motivated, your offer sets the floor, not the list.
Risks & watch-outs
- Watch-outs: flood insurance adds $66/mo.
- Climate carrying-cost: severe flood risk; severe wind risk, 99% chance of damaging wind over 30y; extreme-heat days projected 7→28/yr by 2055 (HVAC capex compounding) — expect insurance premiums to compound above CPI over the hold.
Questions for the listing agent
- It's been on market 141 days. Have you received any prior offers? Is the seller open to a 12% concession, seller financing, or rate buy-down credit?
- What's the actual annual flood-insurance premium (NFIP or private), and is the property in a SFHA with mandatory coverage?
- What does the HOA fee cover, when was the last increase, and are there any pending special assessments or reserve-fund shortfalls?
- Why hasn't it sold? Are there any deal-killer items the seller is aware of (foundation, flood, title, zoning, code violations)?
- Is there a deadline driving the sale (1031 exchange, divorce, estate, relocation)? That informs how much negotiation room exists.
- Schools are F-rated, which usually means shorter tenancies and higher turnover. Who's the typical renter profile here, and what's been the actual vacancy rate?
- Crime grade is F in this area — have there been break-ins, vandalism, or insurance claims at this property in the last 3 years? What carrier currently insures it and at what premium?
- What's the average days-on-market for RENTAL listings here right now (not sales)? A rising rental-DOM trend means longer vacancies and softer asking-rent achievability than the comps imply.
- What's the recent tenant-quality profile in this submarket — average credit score on applications, eviction rate, late-payment / NSF rate, and stable-employment percentage? A property-management company in the area should have these aggregated.
- How much new for-sale + rental construction is in the pipeline within 1–3 miles? Heavy new supply typically softens prices + rents 12–24 months out; constrained supply supports both.
Investment metrics
- 1% rule
- 1.07% ✓
- Cap rate
- 7.07%
- Cash-on-cash
- 2.77%
- DSCR
- 1.12
- GRM
- 7.8
CMA / ARV
- ARV (median comp)
- $249,375
- List price
- $227,000
- Delta
- -8.97%
- Verdict
- FAIR
- Comps
- 20 within 1.0 mi
Show comp detail 12 sales within ~0.75 mi
| Address | Dist | Beds/Ba | Sqft | Sold | Price | $/sf | Match |
|---|---|---|---|---|---|---|---|
| 109 Indigo Brush Dr | 0.05mi | 3/2.5 (-1) | 1,719 (+7%) | 4mo | $235,000 | $137 | 76 |
| 2215 Manta Way | 0.37mi | 3/2.0 (-1) | 1,575 (-2%) | 1mo | $245,000 | $156 | 74 |
| 2322 Nautica Terrace Dr | 0.39mi | 3/2.0 (-1) | 1,575 (-2%) | 1mo | $250,000 | $159 | 73 |
| 2315 Oyster Bay Ave | 0.38mi | 3/2.5 (-1) | 1,615 (+1%) | 3mo | $250,000 | $155 | 71 |
| 2317 Nautica Terrace Dr | 0.38mi | 3/2.0 (-1) | 1,666 (+4%) | 1mo | $242,500 | $146 | 70 |
| 12801 Pirate Bend Dr | 0.32mi | 3/2.0 (-1) | 1,535 (-4%) | 4mo | $264,000 | $172 | 70 |
| 315 Hawks View Dr | 0.14mi | 3/2.0 (-1) | 1,436 (-10%) | 5mo | $245,000 | $171 | 67 |
| 12609 Pirate Bend Dr | 0.31mi | 3/2.0 (-1) | 1,720 (+7%) | 5mo | $265,000 | $154 | 64 |
| 2210 Mirror Ridge Ct | 0.29mi | 4/2.0 | 1,831 (+14%) | 5mo | $299,990 | $164 | 58 |
| 140 Mustang Stampede Dr | 0.26mi | 3/2.0 (-1) | 1,376 (-14%) | 3mo | $224,900 | $163 | 57 |
| 2310 Nautica Terrace Dr | 0.36mi | 3/2.0 (-1) | 1,419 (-12%) | 4mo | $230,000 | $162 | 55 |
| 13137 Leisure Cove Dr | 0.65mi | 4/2.5 | 1,785 (+11%) | 2mo | $309,900 | $174 | 48 |
Match score weights: distance 35% · size 25% · config 20% · recency 20%. Top-matched comps best support the ARV.
Projected returns pro-forma
-3.0% appreciation · 3.95% rent growth · sell at horizon
- IRR
- -12.6%
- Equity multiple
- 0.54×
- Total profit
- $-29,133
- Equity at exit
- $33,846
- IRR
- -1.8%
- Equity multiple
- 0.87×
- Total profit
- $-8,151
- Equity at exit
- $19,627
Cash invested: $63,560 (down + closing). Projections, not guarantees.
Landlord ↔ Tenant lean methodology
- Overall (STATE)
- 87 Strongly Landlord-Friendly
- State Texas
- 87 Strongly Landlord-Friendly · R+5
- County
- — inherits STATE
- City
- — inherits STATE
ZIP-level market 77568
- Home prices YoY
- -22.7%
- Rents YoY
- 4.0%
- Active inventory
- 654
- Price-to-rent
- 7.8×
Monthly cashflow live
- Estimated rent
- $2,433 high interval (Pro) →
- Mortgage (P&I)
- −$1,190
- Tax from tax record
- −$433 /mo · $5,192/yr
- Insurance
- −$95
- Flood insurance flood zone
- −$66 /mo · $798/yr
- HOA
- −$58
- Vacancy / Maint / Mgmt
- −$511
- Net cashflow
- $80
Break-even live
UW: 25.0% down · 7.5% · 30yr · 1.5% tax · 5.0% vac · 8.0% maint · 8.0% mgmt
Financing live
Cash to close
- Down payment
- $56,750
- Closing costs
- $6,810
- Reserves months
- —
- Total cash needed
- —
Loan-product check · same deal, 3 products live
Conventional
25% down · 7.5% · 30yr
- Down + closing
- —
- Monthly P&I
- —
- Monthly cashflow
- —
- DSCR
- —
- Eligible?
- —
Personal DTI + credit; lowest rate.
DSCR
20% down · 8.5% · 30yr
- Down + closing
- —
- Monthly P&I
- —
- Monthly cashflow
- —
- DSCR
- —
- Eligible?
- —
No personal income docs; deal must DSCR.
Hard money
10% down · 12.0% · 12mo
- Down + closing
- —
- Monthly P&I
- —
- Monthly cashflow
- —
- DSCR
- —
- Eligible?
- —
Short-term bridge; refi at stabilization.
Rent comps 6 comps
| Address | Beds | Baths | Sqft | Rent | $/sqft | DOM | Units | Dist |
|---|---|---|---|---|---|---|---|---|
| 114 Mustang Stampede Dr La Marque, TX | 3.0 | 2.0 | 1752 | $2,050 | $1.17 | 1d | 1 | 0.22mi |
| 640 Totem Trail Dr La Marque, TX | 4.0 | 2.5 | 2134 | $2,309 | $1.08 | 11d | 1 | 0.35mi |
| 2301 Starboard Sail Alta Loma, TX | 4.0 | 2.0 | 1856 | $2,181 | $1.18 | 11d | 1 | 0.45mi |
| 12524 Jetty Cv Santa Fe, TX | 3.0 | 2.0 | 1803 | $2,506 | $1.39 | 22d | 1 | 0.51mi |
| 2437 Regatta Ln La Marque, TX | 4.0 | 2.0 | 1844 | $2,079 | $1.13 | 5d | 1 | 0.53mi |
| 3301 Gulf Fwy La Marque, TX | 1.0–3.0 | 1.0–2.0 | 991 | $2,430 | $2.45 | 2d | 22 | 0.94mi |
HOA detail
- Monthly dues
- $58 · $696/yr
Listing history 14 events
-
2026-05-17status Active 285-char remark
Show marketing remark (285 chars)
This 4-2-2 house is upgraded and well-maintained. Upgrades include matching tiles in the living and wet areas, garden bath with separate shower, granite countertops, high cabinets, 2024 fence, 2025 new carpet and painting and a lot more. Must see and call your agent for a showing now!
-
2026-05-10status Pending 285-char remark
Show marketing remark (285 chars)
This 4-2-2 house is upgraded and well-maintained. Upgrades include matching tiles in the living and wet areas, garden bath with separate shower, granite countertops, high cabinets, 2024 fence, 2025 new carpet and painting and a lot more. Must see and call your agent for a showing now!
-
2026-04-29price $227,000 285-char remark
Show marketing remark (285 chars)
This 4-2-2 house is upgraded and well-maintained. Upgrades include matching tiles in the living and wet areas, garden bath with separate shower, granite countertops, high cabinets, 2024 fence, 2025 new carpet and painting and a lot more. Must see and call your agent for a showing now!
-
2026-02-18price $232,000 285-char remark
Show marketing remark (285 chars)
This 4-2-2 house is upgraded and well-maintained. Upgrades include matching tiles in the living and wet areas, garden bath with separate shower, granite countertops, high cabinets, 2024 fence, 2025 new carpet and painting and a lot more. Must see and call your agent for a showing now!
-
2026-01-08$253,000 Active 285-char remark
Show marketing remark (285 chars)
This 4-2-2 house is upgraded and well-maintained. Upgrades include matching tiles in the living and wet areas, garden bath with separate shower, granite countertops, high cabinets, 2024 fence, 2025 new carpet and painting and a lot more. Must see and call your agent for a showing now!
-
2025-10-07historical
-
2025-07-01price $264,900
-
2025-06-22$269,900 Active
-
2019-12-10soldstatus
-
2017-03-10soldstatus
-
2015-10-30soldstatus Sold
-
2015-10-27status Pending
-
2015-10-09price $179,000
-
2015-09-14$182,500 Active
ⓘ Source: listings_history table (triggers on properties + properties_extension) + one-shot
backfill from property_details.listing_events for pre-trigger history.
Tax reassessment forecast TX · Resets to sale price
- Current annual tax
- $5,192 · $433/mo
- Projected year-2 tax
- $5,192 · $433/mo
- Expected delta
- $0/yr ($0/mo · 0.0%)
ⓘ Screening estimate from a state-policy table — verify with the county assessor before closing.
Climate risk First Street
- Flood 9/10 Extreme FEMA zone X (shaded) · 99% chance over 30 yrs
- Wildfire 4/10 Moderate
- Heat 10/10 Extreme 7 d/yr ≥110°F today · 28 d/yr by 30 yrs out
- Wind 9/10 Extreme 99% chance of damaging wind over 30 yrs
- Air quality 3/10 Moderate 2 unhealthy d/yr today · 2 by 30 yrs out
Nearby sold comps map
Loading sold comps map…
Walkable amenities ~0.75 mi
Loading nearby amenities…
Taxation est. · year 1
- Rental income
- $29,198
- − Mortgage interest
- −$12,716
- − Property taxes
- −$5,192
- − Insurance
- −$1,932
- − Repairs & maintenance
- −$2,336
- − Management
- −$2,336
- − HOA
- −$696
- − Depreciation
- −$6,604
- Taxable loss
- −$2,614
- Est. tax savings @ 24.0%
- +$627
- After-tax cash flow
- $1,588/yr
For passive investors: Depreciation is non-cash, so a rental often shows a tax loss while cash-flowing — sheltering income. Rental losses are passive: they offset passive income freely, and up to $25,000/yr can offset ordinary (W-2) income if you actively participate and your MAGI is under $100k (phasing out to $0 by $150k); unused losses carry forward. On sale, claimed depreciation is recaptured at up to 25%, and gains may owe capital-gains tax (a 1031 exchange can defer both). Figures are a year-1 estimate at your 24.0% rate — not tax advice; consult a CPA.
Schools (NCES district)
- District
- Santa Fe ISD
- NCES district ID
- 4839270
- Math proficiency
- 38% ▼ -10.00%
- Reading proficiency
- 39% ▼ -2.00%
- Median HH income
- $66,769
- Composite
- 34.86/100
- National rank
- #5091
- State rank
- #385 of 826 in TX
Livability — La Marque
- Score
- 59/100
- State rank
- #1136
- US rank
- #20037
Category grades
Schools grade is shown separately in the Schools card above.
Census & demographics
- Census place
- La Marque, TX
- County
- Galveston County · 357,330 people
- City population
- 23,083
- Metro
- Houston-The Woodlands-Sugar Land, TX
- Population (ZIP)
- 23,083
- Household income
- $74,694
- Rent vs Own
- Severe rent burden
- 700.0
Population outlook (Galveston County) Hauer SSP2
- Today (2025)
- 390,640 people
- By 2030
- 425,226 · +8.9%
- By 2040
- 493,765 · +26.4%
- By 2050
- 559,698 · +43.3%
- By 2075
- 719,260 · +84.1%
- By 2100
- 819,628 · +109.8%
Race, ethnicity, and origin ACS 2023
- Neighborhood character
- Highly diverse neighborhood (Simpson 0.71)
- Race & ethnicity
- White 37% Hispanic / Latino 29% Black 26% Two or more races 17% Asian 3%
- Hispanic origin (detail)
- Mexican 22% Puerto Rican 1%
- Common ancestry
- Lithuanian 1% Italian 1% Serbian 1%
- Foreign-born
- 8% · Canada
- Languages at home
- 77% English-only · Spanish 21% Tagalog/Filipino 1% Other Asian/Pacific 1%
Political lean MEDSL · Galveston
- 2024 margin
- Strong R (+27.4) · D 35.7% · R 63.1% · Other 1.2%
- 2008→2024 swing
- -7.9pp toward R · 2008: -19.5pp · 2024: -27.4pp
- All cycles
- 2024: R+27.4 2020: R+22.6 2016: R+22.6 2012: R+26.9 2008: R+19.5
Not yet ingested
- Civics
- —
Market trends
- HPI YoY
- ▼ -69.39%
- Current HPI
- 236.0239
- Rent YoY
- ▲ 3.95%
- Metro
- Houston-The Woodlands-Sugar Land, TX
- State GDP YoY
- ▲ 3.95%
- F500 in state
- 110
Industry mix (Fortune 500 HQ in TX)
| Industry | F500 HQs | Revenue |
|---|---|---|
| Energy | 16 | $1,198B |
|
||
| Technology | 5 | $198B |
|
||
| Engineering / Construction | 4 | $72B |
|
||
| Energy Services | 3 | $60B |
|
||
| Utilities | 3 | $41B |
|
||
| Healthcare | 2 | $330B |
|
||
Price history
+24.4% since first listed14 events — show timeline
- 2026-05-17 Relisted — HARMLS
- 2026-05-10 Pending — HARMLS
- 2026-04-29 Price Changed $227,000 HARMLS
- 2026-02-18 Price Changed $232,000 HARMLS
- 2026-01-08 Listed $253,000 HARMLS
- 2025-10-07 Listing Removed — HARMLS
- 2025-07-01 Price Changed $264,900 HARMLS
- 2025-06-22 Listed $269,900 HARMLS
- 2019-12-10 Sold (Public Records) — Public Records
- 2017-03-10 Sold (Public Records) — Public Records
- 2015-10-30 Sold (MLS) — HARMLS
- 2015-10-27 Pending — HARMLS
- 2015-10-09 Price Changed $179,000 HARMLS
- 2015-09-14 Listed $182,500 HARMLS
Property tax history
+23.5%/yrLatest (2025): $5,192 · -5.3% YoY. Source: county tax records.
Cash-flow waterfall
monthlySold comps — $/sqft
last 12 mo · ≤1 miLoading sold comps…