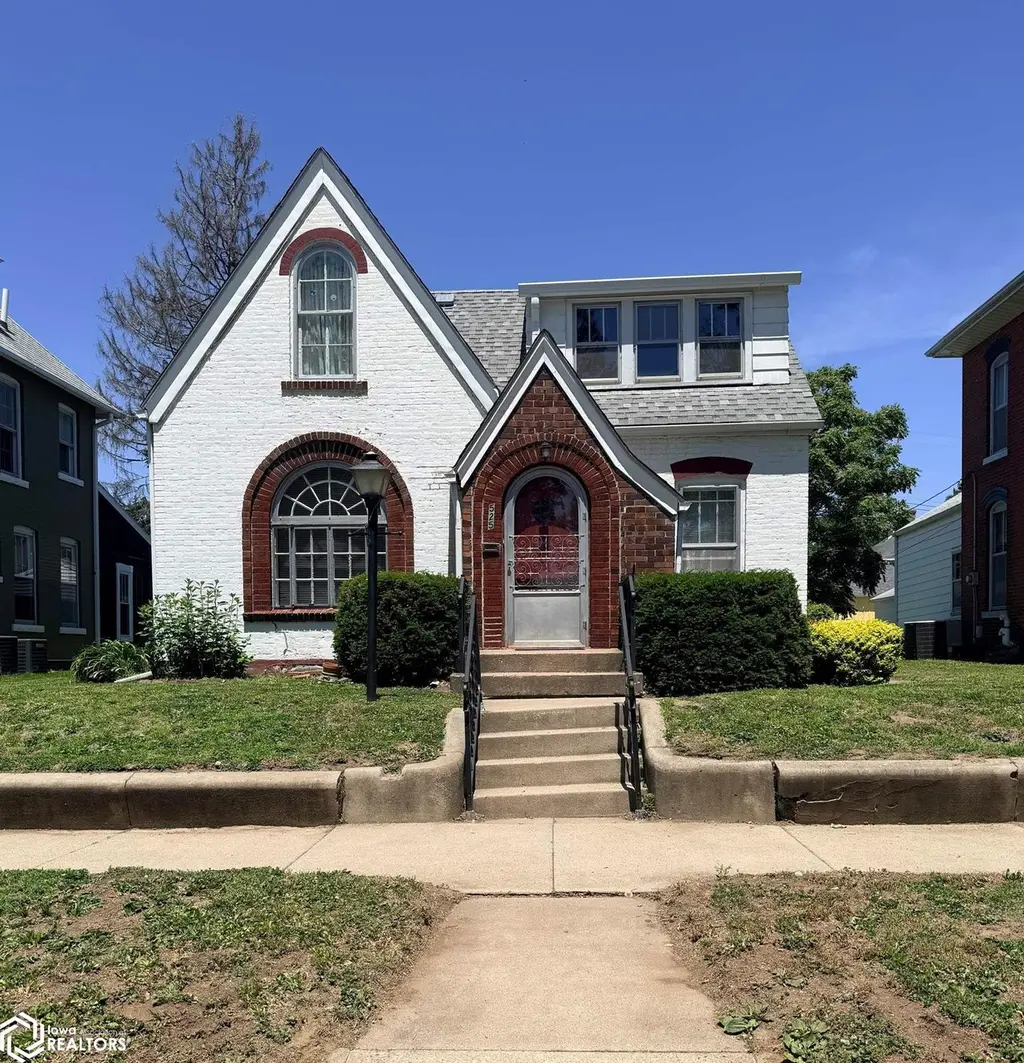
525 Avenue F · Fort Madison, IA
Flood risk 1/10 · Minimal
- FEMA flood zone
- X (unshaded)
- Chance of flooding over 30 yrs
- 0.0%
- Est. flood insurance / yr
- $473 – $860
Fire risk 3/10 · Minor
- Est. fire insurance / yr
- $902 – $1,676
Heat risk 3/10 · Minor
- Hot days now (above 106°F)
- 7 days/yr
- Hot days in 30 yrs
- 16 days/yr
Wind risk 2/10 · Minimal
- Chance of severe wind over 30 yrs
- —
Air-quality risk 2/10 · Minimal
- Unhealthy air days now
- 0 days/yr
- Unhealthy air days in 30 yrs
- 1 days/yr
Risk factors via First Street. Map © Google.
Why this score? — see what drove the D- grade
The composite is a weighted blend of 9 inputs, each scored 0–100. Each bar is that input's sub-score; the figure is the points it added to the 100-point composite (weight × sub-score).
- Cash flow +14.6/30.0
- Schools +4.8/10.0
- DSCR +4.4/10.0
- 1% rule +4.0/10.0
- Livability +3.8/5.0
- Rent growth +2.5/5.0
- Condition / age +2.5/5.0
- ARV discount +1.6/15.0
- Appreciation +0.0/10.0
$149,900
🖨 Deal sheet (PDF) 📄 Offer letter ✓ Due diligence
Listing remarks MLS
Looking for charm? I found it! This beautifully kept home has refinished hardwood floors throughout main level, large living room, formal dining room, eat in kitchen, full bath on main level. The second floor has same great hardwood under the carpet. Home offers ample storage, two car garage, beautiful landscaping. The work has all been done by the meticulous family and done very well. Located in an old Victorian neighborhood and even a slight river view, down the street from Old Settlers Park!! Call a realtor for your showing!!
Key facts
- Arched doorways
- Extra-large garage
- Wood privacy fence
Tags
Property features AI
Exterior
- Parking: Detached heated garage with garage door opener (2 car spaces)
- Utilities: Public water; Public sewer; 200+ amp electric service with circuit breakers
- Home design: Single family residence; One and one-half stories
- Construction: Brick and vinyl siding construction
- Exterior features: Privacy wood fencing; Shingle and rubber roofing; Public maintained road access; City street frontage; Lot approximately 0.17 acres (50 x 145)
Interior
- Kitchen: Range; Dishwasher; Refrigerator; Freezer; Disposal
- Flooring: Carpet; Hardwood; Vinyl
- Bathrooms: One full bathroom; One three-quarter bathroom
- Heating & cooling: Forced air heating; Central air conditioning
- Interior features: Range, Dishwasher, Refrigerator, Freezer, Disposal, Electric water heater
- Laundry & utility: Washer; Dryer; Electric water heater
Neighborhood map
What this means for you Summary
Snapshot
- This is a 4-bed/2.0-bath single-family listed at $150k.
Deal economics
- At list price, monthly cash flow is $35 ($421/yr) — positive.
- The deal already cash-flows at list — no discount required.
- To meet the 1% rule (rent ≥ 1% of price), the offer needs to be $135k (10.3% below list).
- Recommended offer: $135k (10.3% below list) — sets the bar for 1% rule.
- Cap rate 6.6% vs local median 5.3% in Fort Madison — meaningfully above typical; check what's discounted (condition, days-on-market, listing class) to confirm the premium yield is real.
Location & tenants
- Location reads 75/100 on livability (#230 in IA, #4,353 nationally) — a middle-class / working-renter tenant base. Strengths: cost of living A+, housing A+, health & safety A+; Watch: commute F, employment D-.
- Fort Madison Community School District (town): math 55% / reading 58% proficiency, ranked #260 of 289 in IA (top 90%) — acceptable for families but not a draw, mixed tenant base, ~2y average lease.
- Zoned schools: Lincoln Elementary School (math 72% / reading 42%, grade C+, #436 of 616 statewide, top 74%, 236 students, 57% FRL); Fort Madison Middle School (math 56% / reading 63%, grade B, #185 of 246 statewide, top 78%, 695 students, 56% FRL); Fort Madison High School (math 48% / reading 60%, grade C-, #293 of 336 statewide, top 87%, 555 students, 45% FRL).
- Market conditions: 65 active listings in the ZIP; 15 units permitted in Lee County in 2024 (0 in 5+ unit buildings).
Forward outlook
- Local home prices are declining (-3.0%/yr); year-one equity from $1k of loan paydown is wiped out by about $4k of value loss. Plan a longer hold.
- Lee County population projected at -15% by 2050 — secular population decline; favor cash flow + early exit over multi-decade hold.
Negotiation context
- It's been on market 19 days — a 2% lower offer ($148k) is reasonable based on typical stale-listing flexibility.
- 2 sale attempts since 11y ago with the ask held roughly flat each time — persistent listings suggest the price (not the market) is what's stuck; bring a comps-based counter.
- Current owner paid $86k; list at $150k implies a 73% gain — meaningful room to come down on a strong offer.
Risks & watch-outs
- Watch-outs: built in 1900 — expect roof / HVAC / electrical / plumbing capex.
Questions for the listing agent
- Built in 1900 — when were the roof, HVAC, electrical panel, plumbing, and water heater last replaced?
- Is there a deadline driving the sale (1031 exchange, divorce, estate, relocation)? That informs how much negotiation room exists.
- Schools are B-rated — typically a magnet for longer-tenancy family renters. What's the average tenant stay here, and is there a school-zone premium baked into asking?
- The area grade is low — what's the realistic commute time and amenity access for the typical tenant pool here? Any planned neighborhood developments (good or bad) we should know about?
- What's the average days-on-market for RENTAL listings here right now (not sales)? A rising rental-DOM trend means longer vacancies and softer asking-rent achievability than the comps imply.
- What's the recent tenant-quality profile in this submarket — average credit score on applications, eviction rate, late-payment / NSF rate, and stable-employment percentage? A property-management company in the area should have these aggregated.
- How much new for-sale + rental construction is in the pipeline within 1–3 miles? Heavy new supply typically softens prices + rents 12–24 months out; constrained supply supports both.
Investment metrics
- 1% rule
- 0.90% ✗
- Cap rate
- 6.57%
- Cash-on-cash
- 1.00%
- DSCR
- 1.04
- GRM
- 9.3
CMA / ARV
- ARV (on-the-fly)
- $132,464
- Comps found
- 12
Show comp detail 12 sales within ~0.75 mi
| Address | Dist | Beds/Ba | Sqft | Sold | Price | $/sf | Match |
|---|---|---|---|---|---|---|---|
| 523 Avenue D | 0.14mi | 3/1.5 (-1) | 1,962 (+1%) | 12mo | $78,000 | $40 | 75 |
| 528 Avenue D | 0.11mi | 3/2.0 (-1) | 1,868 (-4%) | 17mo | $15,000 | $8 | 68 |
| 916 Avenue D | 0.37mi | 3/1.5 (-1) | 2,060 (+6%) | 4mo | $42,000 | $20 | 63 |
| 911 Avenue D | 0.37mi | 4/3.0 | 2,112 (+8%) | 4mo | $205,000 | $97 | 62 |
| 1024 Avenue F | 0.47mi | 4/1.5 | 1,785 (-8%) | 3mo | $85,000 | $48 | 60 |
| 327 Avenue E | 0.21mi | 3/2.5 (-1) | 1,792 (-8%) | 13mo | $151,500 | $85 | 59 |
| 412 4th St | 0.20mi | 3/2.5 (-1) | 1,696 (-13%) | 4mo | $110,000 | $65 | 58 |
| 1304 Avenue F | 0.72mi | 4/2.0 | 2,034 (+4%) | 9mo | $83,500 | $41 | 52 |
| 1126 Avenue C | 0.61mi | 3/2.5 (-1) | 1,912 (-2%) | 17mo | $147,000 | $77 | 48 |
| 1135 Avenue C | 0.63mi | 4/1.5 | 2,128 (+9%) | 7mo | $249,900 | $117 | 47 |
| 1106 Avenue C | 0.56mi | 3/1.5 (-1) | 1,752 (-10%) | 10mo | $119,000 | $68 | 42 |
| 1232 Avenue F | 0.68mi | 3/2.0 (-1) | 1,728 (-11%) | 17mo | $175,000 | $101 | 30 |
Match score weights: distance 35% · size 25% · config 20% · recency 20%. Top-matched comps best support the ARV.
Projected returns pro-forma
-3.0% appreciation · 3.0% rent growth · sell at horizon
- IRR
- -14.7%
- Equity multiple
- 0.47×
- Total profit
- $-22,041
- Equity at exit
- $22,351
- IRR
- -6.0%
- Equity multiple
- 0.61×
- Total profit
- $-16,254
- Equity at exit
- $12,961
Cash invested: $41,972 (down + closing). Projections, not guarantees.
Landlord ↔ Tenant lean methodology
- Overall (STATE)
- 83 Strongly Landlord-Friendly
- State Iowa
- 83 Strongly Landlord-Friendly · R+6
- County
- — inherits STATE
- City
- — inherits STATE
ZIP-level market 52627
- Home prices YoY
- -28.6%
- Active inventory
- 65
- Price-to-rent
- 9.3×
Monthly cashflow live
- Estimated rent
- $1,345 medium interval (Pro) →
- Mortgage (P&I)
- −$786
- Tax from tax record
- −$179 /mo · $2,148/yr
- Insurance
- −$62
- HOA
- −$0
- Vacancy / Maint / Mgmt
- −$282
- Net cashflow
- $35
Break-even live
Sensitivity live
| Price | -10% $120 | -5% $78 | +0% $35 | +5% $-7 | +10% $-50 |
|---|---|---|---|---|---|
| Rent | -10% $-71 | -5% $-18 | +0% $35 | +5% $88 | +10% $141 |
| Rate | -1.0pp $111 | -0.5pp $73 | base $35 | +0.5pp $-4 | +1.0pp $-43 |
UW: 25.0% down · 7.5% · 30yr · 1.5% tax · 5.0% vac · 8.0% maint · 8.0% mgmt
Financing live
Cash to close
- Down payment
- $37,475
- Closing costs
- $4,497
- Reserves months
- —
- Total cash needed
- —
Loan-product check · same deal, 3 products live
Conventional
25% down · 7.5% · 30yr
- Down + closing
- —
- Monthly P&I
- —
- Monthly cashflow
- —
- DSCR
- —
- Eligible?
- —
Personal DTI + credit; lowest rate.
DSCR
20% down · 8.5% · 30yr
- Down + closing
- —
- Monthly P&I
- —
- Monthly cashflow
- —
- DSCR
- —
- Eligible?
- —
No personal income docs; deal must DSCR.
Hard money
10% down · 12.0% · 12mo
- Down + closing
- —
- Monthly P&I
- —
- Monthly cashflow
- —
- DSCR
- —
- Eligible?
- —
Short-term bridge; refi at stabilization.
Listing history 15 events
-
2026-06-22days on market $149,900 Active 19 DOM
-
2026-06-21days on market $149,900 Active 18 DOM
-
2026-06-19days on market $149,900 Active 16 DOM
-
2026-06-18days on market $149,900 Active 15 DOM
-
2026-06-17days on market $149,900 Active 14 DOM
-
2026-06-16days on market $149,900 Active 13 DOM
-
2026-06-15days on market $149,900 Active 12 DOM
-
2026-06-14days on market $149,900 Active 10 DOM
-
2026-06-12days on market $149,900 Active 9 DOM
-
2026-06-09days on market $149,900 Active 6 DOM
-
2026-06-08days on market $149,900 Active 5 DOM
-
2026-06-07days on market $149,900 Active 4 DOM
-
2026-06-07days on market $149,900 Active 3 DOM
-
2026-06-03remarks 699-char remark
-
2026-06-03$149,900 Active 1 DOM
ⓘ Source: listings_history table (triggers on properties + properties_extension) + one-shot
backfill from property_details.listing_events for pre-trigger history.
Tax reassessment forecast IA · Partial reset (capped growth)
- Current annual tax
- $2,148 · $179/mo
- Projected year-2 tax
- $2,251 · $188/mo
- Expected delta
- +$103/yr (+$9/mo · 4.8%)
ⓘ Screening estimate from a state-policy table — verify with the county assessor before closing.
Climate risk First Street
- Flood 1/10 Low FEMA zone X (unshaded) · 0% chance over 30 yrs
- Wildfire 3/10 Moderate
- Heat 3/10 Moderate 7 d/yr ≥106°F today · 16 d/yr by 30 yrs out
- Wind 2/10 Low
- Air quality 2/10 Low 0 unhealthy d/yr today · 1 by 30 yrs out
Nearby sold comps map
Loading sold comps map…
Walkable amenities ~0.75 mi
Loading nearby amenities…
Taxation est. · year 1
- Rental income
- $16,141
- − Mortgage interest
- −$8,397
- − Property taxes
- −$2,148
- − Insurance
- −$750
- − Repairs & maintenance
- −$1,291
- − Management
- −$1,291
- − Depreciation
- −$4,361
- Taxable loss
- −$2,096
- Est. tax savings @ 24.0%
- +$503
- After-tax cash flow
- $924/yr
For passive investors: Depreciation is non-cash, so a rental often shows a tax loss while cash-flowing — sheltering income. Rental losses are passive: they offset passive income freely, and up to $25,000/yr can offset ordinary (W-2) income if you actively participate and your MAGI is under $100k (phasing out to $0 by $150k); unused losses carry forward. On sale, claimed depreciation is recaptured at up to 25%, and gains may owe capital-gains tax (a 1031 exchange can defer both). Figures are a year-1 estimate at your 24.0% rate — not tax advice; consult a CPA.
Schools (NCES district)
- District
- Fort Madison Community School District
- NCES district ID
- 1911850
- Math proficiency
- 55% ▼ -7.00%
- Reading proficiency
- 58% ▼ -2.00%
- Median HH income
- $46,801
- Composite
- 47.87/100
- National rank
- #2218
- State rank
- #260 of 289 in IA
Livability — Fort Madison
- Score
- 75/100
- State rank
- #230
- US rank
- #4353
Category grades
Schools grade is shown separately in the Schools card above.
Census & demographics
- Census place
- Fort Madison, IA
- Population (ZIP)
- 12,585
Population outlook (Lee County) Hauer SSP2
- Today (2025)
- 33,813 people
- By 2030
- 32,835 · -2.9%
- By 2040
- 30,690 · -9.2%
- By 2050
- 28,777 · -14.9%
- By 2075
- 25,568 · -24.4%
- By 2100
- 21,983 · -35.0%
Race, ethnicity, and origin ACS 2023
- Neighborhood character
- Predominantly White (88%)
- Race & ethnicity
- White 88% Two or more races 5% Hispanic / Latino 5% Black 4%
- Common ancestry
- Slovak 2% Portuguese 1% Italian 1%
- Foreign-born
- 1%
- Languages at home
- 98% English-only · Spanish 2%
Political lean MEDSL · Lee
- 2024 margin
- Strong R (+27.8) · D 35.0% · R 62.9% · Other 2.1%
- 2008→2024 swing
- -43.8pp toward R · 2008: 16.0pp · 2024: -27.8pp
- All cycles
- 2024: R+27.8 2020: R+19.3 2016: R+16.1 2012: D+16.0 2008: D+16.0
Not yet ingested
- Civics
- —
Market trends
- HPI YoY
- ▼ -70.32%
- Current HPI
- 175.7708
- Rent YoY
- —
- Metro
- —
- State GDP YoY
- ▲ 2.48%
- F500 in state
- 4
Industry mix (Fortune 500 HQ in IA)
| Industry | F500 HQs | Revenue |
|---|---|---|
| Financial Services | 1 | $16B |
|
||
| Retail / Convenience | 1 | $15B |
|
||
Price history
+73.3% since first listed4 events — show timeline
- 2026-06-02 Listed $149,900 IAR
- 2015-07-01 Sold (Public Records) $86,500 Public Records
- 2015-06-26 Sold (MLS) $86,500 IAR
- 2015-05-04 Listed $86,500 IAR
Property tax history
+3.1%/yrLatest (2025): $2,148 · +1.6% YoY. Source: county tax records.
Cash-flow waterfall
monthlySold comps — $/sqft
last 12 mo · ≤1 miLoading sold comps…