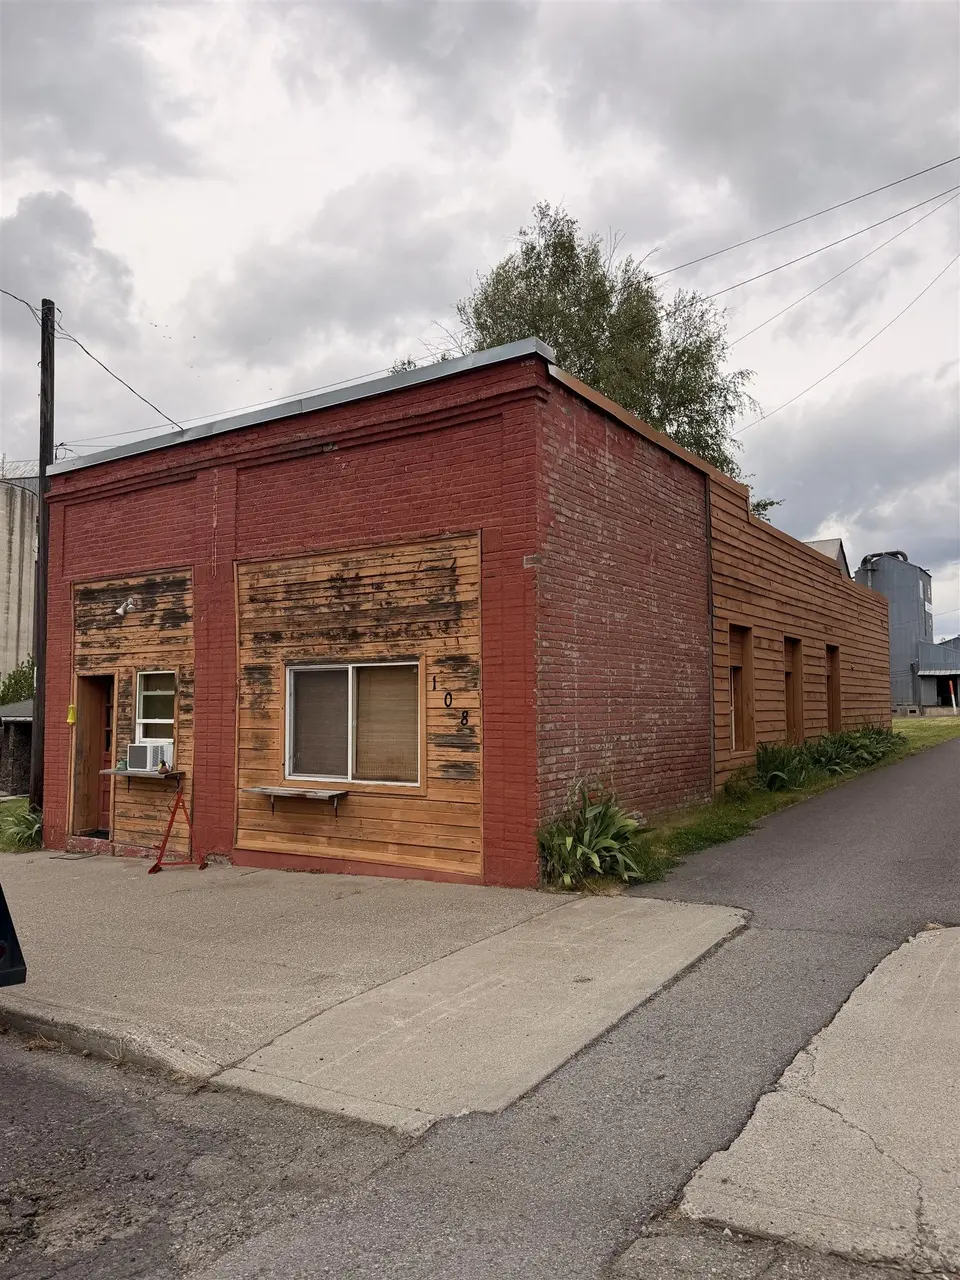
108 W 5th St · Rosalia, WA
Flood risk 1/10 · Minimal
- FEMA flood zone
- —
- Chance of flooding over 30 yrs
- 0.0%
- Est. flood insurance / yr
- —
Fire risk 4/10 · Minor
- Est. fire insurance / yr
- $604 – $1,122
Heat risk 3/10 · Minor
- Hot days now (above 93°F)
- 7 days/yr
- Hot days in 30 yrs
- 15 days/yr
Wind risk 1/10 · Minimal
- Chance of severe wind over 30 yrs
- —
Air-quality risk 7/10 · Major
- Unhealthy air days now
- 11 days/yr
- Unhealthy air days in 30 yrs
- 11 days/yr
Risk factors via First Street. Map © Google.
Why this score? — see what drove the B- grade
The composite is a weighted blend of 9 inputs, each scored 0–100. Each bar is that input's sub-score; the figure is the points it added to the 100-point composite (weight × sub-score).
- Cash flow +18.1/30.0
- ARV discount +15.0/15.0
- Appreciation +10.0/10.0
- DSCR +5.7/10.0
- Schools +5.0/10.0
- 1% rule +4.9/10.0
- Livability +3.1/5.0
- Rent growth +2.5/5.0
- Condition / age +2.2/5.0
$115,000
🖨 Deal sheet 📄 Offer letter ✓ Due diligence
Listing remarks
This property offers so much potential. Featuring 2 bedrooms, a living room, bathroom, a large backyard, and plenty of flexibility, it could be kept as a cozy residential space or transformed into the perfect small business opportunity. A unique property with charm, space, and room to make it your own.
Key facts
- Large backyard
- 1,000 sq ft lot
- Built 1918
Tags
Property features AI
Exterior
- Parking: No designated parking
- Utilities: High-speed internet available
- Home design: Single-family residence; One-story layout
- Construction: Brick and wood siding exterior; Roof details available in remarks
- Exterior features: Level, open corner lot; City street frontage
Interior
- Kitchen: Refrigerator
- Bedrooms: 2 bedrooms
- Heating & cooling: Electric heating
- Interior features: Refrigerator included; Accessible doorways and hallways (32 inches or wider)
Neighborhood map
What this means for you Summary
Snapshot
- This is a 2-bed/1.0-bath single-family listed at $115k. Condition is rated fair.
Deal economics
- At list price, monthly cash flow is $102 ($1k/yr) — positive.
- The deal already cash-flows at list — no discount required.
- To meet the 1% rule (rent ≥ 1% of price), the offer needs to be $114k (1.3% below list).
- Recommended offer: $113k (1.5% below list) — sets the bar for market timing.
Location & tenants
- Location reads 61/100 on livability (#442 in WA) — a middle-class / working-renter tenant base. Strengths: cost of living A+, housing A+, schools B; Watch: employment D+, crime F, amenities F.
- Rosalia School District (rural): math 50% / reading 65% proficiency, ranked #93 of 291 in WA (top 32%) — acceptable for families but not a draw, mixed tenant base, ~2y average lease.
- Market conditions: 13 active listings in the ZIP; 49 units permitted in Whitman County in 2024 (0 in 5+ unit buildings).
Forward outlook
- In year one you build about $12k of equity ($795 loan paydown + $12k appreciation (10.0% local appreciation)).
- Whitman County population projected at +57% by 2050 — long-run rental-demand tailwind backs the buy-and-hold thesis.
- At projected returns (10.0% appreciation + 3.0% rent growth), your $32k cash investment doubles in ~3 years — after that, you're playing with house money.
- By year 3, paydown + projected appreciation supports a ~$31k cash-out refi (75% LTV) — recoverable capital for the next deal without selling this one.
Negotiation context
- It's been on market 23 days — a 2% lower offer ($113k) is reasonable based on typical stale-listing flexibility.
Risks & watch-outs
- Watch-outs: built in 1918 — expect roof / HVAC / electrical / plumbing capex.
Questions for the listing agent
- Have any recent inspections been done? Can we get a copy of the seller's disclosures and any deferred-maintenance estimates?
- Built in 1918 — when were the roof, HVAC, electrical panel, plumbing, and water heater last replaced?
- Is there a deadline driving the sale (1031 exchange, divorce, estate, relocation)? That informs how much negotiation room exists.
- Schools are B-rated — typically a magnet for longer-tenancy family renters. What's the average tenant stay here, and is there a school-zone premium baked into asking?
- Crime grade is F in this area — have there been break-ins, vandalism, or insurance claims at this property in the last 3 years? What carrier currently insures it and at what premium?
- What's the average days-on-market for RENTAL listings here right now (not sales)? A rising rental-DOM trend means longer vacancies and softer asking-rent achievability than the comps imply.
- What's the recent tenant-quality profile in this submarket — average credit score on applications, eviction rate, late-payment / NSF rate, and stable-employment percentage? A property-management company in the area should have these aggregated.
- How much new for-sale + rental construction is in the pipeline within 1–3 miles? Heavy new supply typically softens prices + rents 12–24 months out; constrained supply supports both.
Investment metrics
- 1% rule
- 0.99% ✗
- Cap rate
- 7.36%
- Cash-on-cash
- 3.80%
- DSCR
- 1.17
- GRM
- 8.4
CMA / ARV
- ARV (on-the-fly)
- $225,000
- Comps found
- 2
Show comp detail 2 sales within ~0.75 mi
| Address | Dist | Beds/Ba | Sqft | Sold | Price | $/sf | Match |
|---|---|---|---|---|---|---|---|
| 714 S Park Ave | 0.22mi | 3/2.0 (+1) | 1,248 (-0%) | 19mo | $225,000 | $180 | 64 |
| 814 S Park Ave | 0.29mi | 3/2.0 (+1) | 1,344 (+8%) | 14mo | $185,000 | $138 | 53 |
Match score weights: distance 35% · size 25% · config 20% · recency 20%. Top-matched comps best support the ARV.
Projected returns pro-forma
10.0% appreciation · 3.0% rent growth · sell at horizon
- IRR
- 27.0%
- Equity multiple
- 3.15×
- Total profit
- $69,144
- Equity at exit
- $103,601
- IRR
- 23.6%
- Equity multiple
- 7.17×
- Total profit
- $198,544
- Equity at exit
- $223,420
Cash invested: $32,200 (down + closing). Projections, not guarantees.
Landlord ↔ Tenant lean methodology
- Overall (STATE)
- 28 Tenant-Leaning
- State Washington
- 28 Tenant-Leaning · D+8
- County
- — inherits STATE
- City
- — inherits STATE
ZIP-level market 99170
- Home prices YoY
- 10.8%
- Active inventory
- 13
- Price-to-rent
- 8.4×
Monthly cashflow live
- Estimated rent
- $1,135 medium interval (Pro) →
- Mortgage (P&I)
- −$603
- Tax est. 1.5%
- −$144 /mo · $1,725/yr
- Insurance
- −$48
- HOA
- −$0
- Vacancy / Maint / Mgmt
- −$238
- Net cashflow
- $102
Break-even live
UW: 25.0% down · 7.5% · 30yr · 1.5% tax · 5.0% vac · 8.0% maint · 8.0% mgmt
Financing live
Cash to close
- Down payment
- $28,750
- Closing costs
- $3,450
- Reserves months
- —
- Total cash needed
- —
Loan-product check · same deal, 3 products live
Conventional
25% down · 7.5% · 30yr
- Down + closing
- —
- Monthly P&I
- —
- Monthly cashflow
- —
- DSCR
- —
- Eligible?
- —
Personal DTI + credit; lowest rate.
DSCR
20% down · 8.5% · 30yr
- Down + closing
- —
- Monthly P&I
- —
- Monthly cashflow
- —
- DSCR
- —
- Eligible?
- —
No personal income docs; deal must DSCR.
Hard money
10% down · 12.0% · 12mo
- Down + closing
- —
- Monthly P&I
- —
- Monthly cashflow
- —
- DSCR
- —
- Eligible?
- —
Short-term bridge; refi at stabilization.
Listing history 16 events
-
2026-06-18days on market $115,000 Active 23 DOM
-
2026-06-17days on market $115,000 Active 22 DOM
-
2026-06-16days on market $115,000 Active 21 DOM
-
2026-06-15days on market $115,000 Active 20 DOM
-
2026-06-15days on market $115,000 Active 19 DOM
-
2026-06-13days on market $115,000 Active 18 DOM
-
2026-06-12days on market $115,000 Active 17 DOM
-
2026-06-09days on market $115,000 Active 14 DOM
-
2026-06-08days on market $115,000 Active 13 DOM
-
2026-06-08days on market $115,000 Active 12 DOM
-
2026-06-05days on market $115,000 Active 10 DOM
-
2026-06-03days on market $115,000 Active 8 DOM
-
2026-06-02days on market $115,000 Active 7 DOM
-
2026-06-01days on market $115,000 Active 6 DOM
-
2026-05-31days on market $115,000 Active 5 DOM
-
2026-05-26$115,000 Active
ⓘ Source: listings_history table (triggers on properties + properties_extension) + one-shot
backfill from property_details.listing_events for pre-trigger history.
Climate risk First Street
- Flood 1/10 Low 0% chance over 30 yrs
- Wildfire 4/10 Moderate
- Heat 3/10 Moderate 7 d/yr ≥93°F today · 15 d/yr by 30 yrs out
- Wind 1/10 Low
- Air quality 7/10 Severe 11 unhealthy d/yr today · 11 by 30 yrs out
Nearby sold comps map
Loading sold comps map…
Walkable amenities ~0.75 mi
Loading nearby amenities…
Taxation est. · year 1
- Rental income
- $13,621
- − Mortgage interest
- −$6,442
- − Property taxes
- −$1,725
- − Insurance
- −$575
- − Repairs & maintenance
- −$1,090
- − Management
- −$1,090
- − Depreciation
- −$3,345
- Taxable loss
- −$646
- Est. tax savings @ 24.0%
- +$155
- After-tax cash flow
- $1,379/yr
For passive investors: Depreciation is non-cash, so a rental often shows a tax loss while cash-flowing — sheltering income. Rental losses are passive: they offset passive income freely, and up to $25,000/yr can offset ordinary (W-2) income if you actively participate and your MAGI is under $100k (phasing out to $0 by $150k); unused losses carry forward. On sale, claimed depreciation is recaptured at up to 25%, and gains may owe capital-gains tax (a 1031 exchange can defer both). Figures are a year-1 estimate at your 24.0% rate — not tax advice; consult a CPA.
Condition & rehab AI · 6 photos
This property requires significant exterior and interior repairs, but has potential for a substantial increase in value with proper renovations.
Repairs flagged
- Major Exterior siding — Missing siding and exposed framing
- Major Roof — No visible roof damage, but the satellite image shows a flat roof which may need inspection
- Major Windows — Windows appear old and may need replacement
- Major HVAC system — No visible HVAC system, but the satellite image shows a condenser unit which may need inspection
Value-add opportunities
- Resale Paint interior walls — Fresh paint can make a significant difference in the home's appearance
- Rental Replace carpet — New carpet can improve the home's rental appeal
- Both Landscaping — A well-maintained lawn and landscaping can enhance both resale and rental value
Renovation cost estimate screening
| Repair item | Severity | Est. cost |
|---|---|---|
| Exterior siding · Missing siding and exposed framing | Major | $15,000–50,000 |
| Roof · No visible roof damage, but the satellite image shows a flat roof which may need inspection | Major | $15,000–50,000 |
| Windows · Windows appear old and may need replacement | Major | $15,000–50,000 |
| HVAC system · No visible HVAC system, but the satellite image shows a condenser unit which may need inspection | Major | $15,000–50,000 |
| Total estimated repair cost · 4 items | $60,000–200,000 |
Value-add ROI direction
- Resale Paint interior walls — Fresh paint can make a significant difference in the home's appearance ↑
- Rental Replace carpet — New carpet can improve the home's rental appeal ↑
- Both Landscaping — A well-maintained lawn and landscaping can enhance both resale and rental value ↑
ⓘ Cost ranges are severity-bucket heuristics (US national rule-of-thumb). Get contractor quotes + a written scope before underwriting a rehab budget.
Schools (NCES district)
- District
- Rosalia School District
- NCES district ID
- 5307560
- Math proficiency
- 50% ▼ -5.00%
- Reading proficiency
- 65% ▬ 0.00%
- Median HH income
- $40,507
- Composite
- 49.78/100
- National rank
- #4215
- State rank
- #93 of 291 in WA
Livability — Rosalia
- Score
- 61/100
- State rank
- #442
- US rank
- #17985
Category grades
Schools grade is shown separately in the Schools card above.
Census & demographics
- Census place
- Rosalia, WA
- Population (ZIP)
- 1,015
Population outlook (Whitman County) Hauer SSP2
- Today (2025)
- 57,639 people
- By 2030
- 63,440 · +10.1%
- By 2040
- 75,870 · +31.6%
- By 2050
- 90,294 · +56.7%
- By 2075
- 131,756 · +128.6%
- By 2100
- 169,239 · +193.6%
Race, ethnicity, and origin ACS 2023
- Neighborhood character
- Predominantly White (86%)
- Race & ethnicity
- White 86% Two or more races 10% Hispanic / Latino 5%
- Hispanic origin (detail)
- Mexican 1%
- Common ancestry
- Portuguese 5% Slovak 4% Lithuanian 3%
- Foreign-born
- 1% · Canada
- Languages at home
- 99% English-only · Spanish 1%
Political lean MEDSL · Whitman
- 2024 margin
- Lean D (+9.0) · D 52.8% · R 43.8% · Other 3.4%
- 2008→2024 swing
- +3.5pp toward D · 2008: 5.5pp · 2024: 9.0pp
- All cycles
- 2024: D+9.0 2020: D+10.0 2016: D+0.5 2012: R+3.7 2008: D+5.5
Not yet ingested
- Civics
- —
Market trends
- HPI YoY
- ▲ 36.78%
- Current HPI
- 376.16
- Rent YoY
- —
- Metro
- —
- State GDP YoY
- ▲ 4.65%
- F500 in state
- 22
Industry mix (Fortune 500 HQ in WA)
| Industry | F500 HQs | Revenue |
|---|---|---|
| Retail | 2 | $269B |
|
||
| Technology / Retail | 1 | $638B |
|
||
| Technology | 1 | $245B |
|
||
| Telecommunications | 1 | $38B |
|
||
| Food / Beverage | 1 | $36B |
|
||
| Automotive / Trucks | 1 | $34B |
|
||
Price history
1 event — show timeline
- 2026-05-26 Listed $115,000 SPOKANEMLS as Distributed by MLS Grid
Cash-flow waterfall
monthlySold comps — $/sqft
last 12 mo · ≤1 miLoading sold comps…