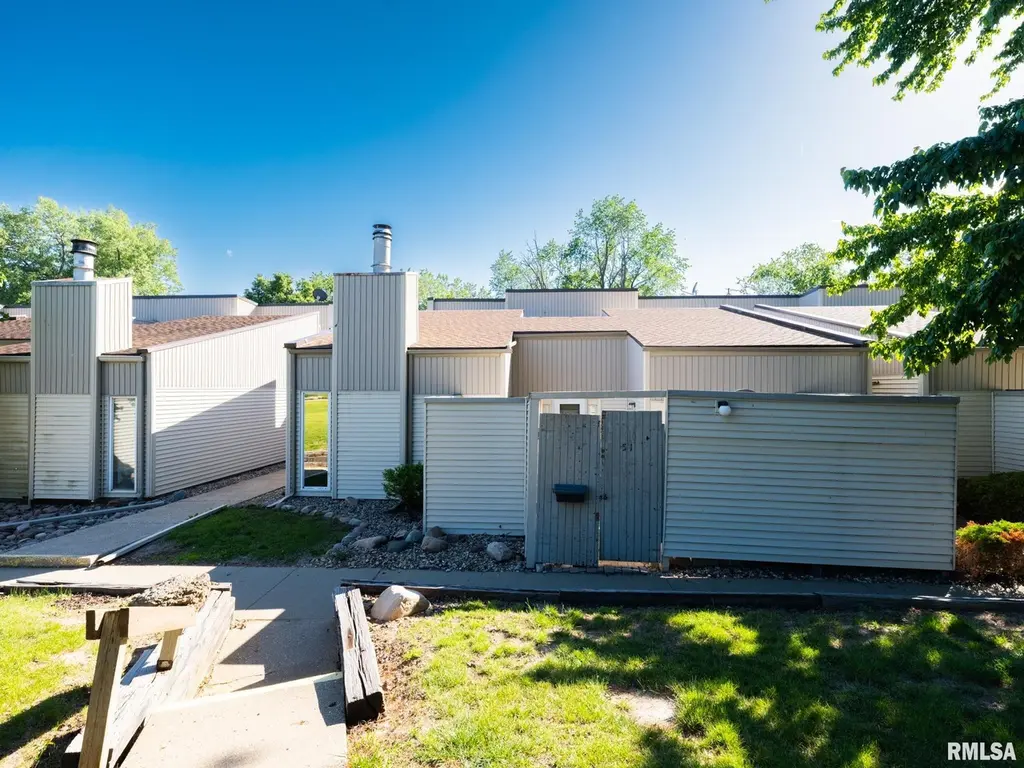
6809 N Frostwood Pkwy #51 · Peoria, IL
Flood risk 1/10 · Minimal
- FEMA flood zone
- X
- Chance of flooding over 30 yrs
- 0.0%
- Est. flood insurance / yr
- $507 – $1,088
Fire risk 1/10 · Minimal
- Est. fire insurance / yr
- $804 – $1,492
Heat risk 3/10 · Minor
- Hot days now (above 104°F)
- 7 days/yr
- Hot days in 30 yrs
- 18 days/yr
Wind risk 2/10 · Minimal
- Chance of severe wind over 30 yrs
- 1.0%
Air-quality risk 2/10 · Minimal
- Unhealthy air days now
- 1 days/yr
- Unhealthy air days in 30 yrs
- 2 days/yr
Risk factors via First Street. Map © Google.
Why this score? — see what drove the C- grade
The composite is a weighted blend of 9 inputs, each scored 0–100. Each bar is that input's sub-score; the figure is the points it added to the 100-point composite (weight × sub-score).
- Cash flow +20.2/30.0
- 1% rule +9.4/10.0
- ARV discount +7.5/15.0
- DSCR +6.4/10.0
- Livability +3.7/5.0
- Rent growth +2.5/5.0
- Condition / age +2.5/5.0
- Schools +1.1/10.0
- Appreciation +0.0/10.0
$90,000
🖨 Deal sheet 📄 Offer letter ✓ Due diligence
Listing remarks
Great opportunity to enjoy carefree living conveniently located close to shopping, dining and easy interstate access. This 2 bed/2 bath is perfect for those wanting to have everything on one level and never having to mow grass or shovel snow again! Open floor plan with updated kitchen, fireplace and charming wet bar area. The attached 2 car garage, in addition to assigned carport parking, adds to the ease and comfort. New AC 2024, patio doors updated 2025. All appliances remain in the home but not warranted. This checks all the boxes for anyone looking to downsize, first time buyers or anyone just those wanting to kick back and relax. Home is being sold in "as-is" condition. Agent
Key facts
- Wet bar area
- Attached garage
- Updated kitchen
Tags
Property features AI
Finance
- HOA & community: HOA fee (association fee) — $271; HOA covers landscaping, grounds maintenance, road maintenance, snow removal, common area maintenance, and structure maintenance
Exterior
- Parking: Attached 2-car garage
- Utilities: Public water; Public sewer
- Home design: Condo / attached property; 2 total stories; unit living area listed as single-story; Built in 1976
- Construction: Not new construction
- Exterior features: Shingle roof; Level lot; Paved road access
Interior
- Kitchen: Dishwasher; Microwave; Refrigerator; Tile flooring in the kitchen
- Bedrooms: 2 bedrooms (both on the main level) — Bedroom 1 ~12.1 x 13.8 ft (carpet) with egress window; Bedroom 2 ~10.3 x 15.8 ft (carpet) with egress window
- Flooring: Carpet in bedrooms and living areas; Tile in the kitchen
- Bathrooms: 2 full bathrooms
- Heating & cooling: Central air conditioning; Electric heating; Electric water heater
- Interior features: High speed internet available; Wood-burning fireplace in the family room; One fireplace
Neighborhood map
What this means for you Summary
Snapshot
- This is a 2-bed/2.0-bath condo listed at $90k.
Deal economics
- At list price, monthly cash flow is $114 ($1k/yr) — positive.
- The deal already cash-flows at list — no discount required.
- Meets the 1% rule at list price ($1k rent vs $90k).
- Cap rate 7.8% vs local median 5.6% in Peoria — top-decile yield for the area; either an underpriced asset or a hidden risk that comps aren't pricing in. Stress-test before assuming the spread holds.
Location & tenants
- Location reads 73/100 on livability (#270 in IL) — a middle-class / working-renter tenant base. Strengths: commute A+, cost of living A+, housing A+; Watch: employment D+, crime F.
- Peoria SD 150 (urban): math 11% / reading 14% proficiency, ranked #554 of 620 in IL (top 89%) — low school quality limits family demand, transient renter base, plan for 1-2y turnover; 70% free/reduced lunch — lower-income household profile, screen leases tightly.
- Zoned schools: Richwoods High School (math 30% / reading 35%, grade F, #152 of 693 statewide, top 22%, 1,580 students, 0% FRL) — zoned schools average 0% FRL vs 70% district-wide (70 pts lower); this property's tenant base skews higher-income than the district average.
- Zoned-school proficiency averages 32% at this address vs 12% district-wide (+20 pts) — the actual schools serving this property are materially stronger than the Peoria SD 150 average implies; a family-tenant draw the district grade alone would hide.
- Market conditions: 127 active listings in the ZIP; 8 comparable units currently listed for rent nearby; rentals leasing fast (median 13d on market — plan ~1-2 weeks tenant-placement turnaround); solid renter incomes; 73 units permitted in Peoria County in 2024 (0 in 5+ unit buildings).
Forward outlook
- Local home prices are declining (-3.0%/yr); year-one equity from $622 of loan paydown is wiped out by about $3k of value loss. Plan a longer hold.
- Peoria County population projected at -11% by 2050 — secular population decline; favor cash flow + early exit over multi-decade hold.
Negotiation context
- Only 4 days on market — expect competitive offers; lowballing is unlikely to land.
- 2 sale attempts with the ask held roughly flat each time — persistent listings suggest the price (not the market) is what's stuck; bring a comps-based counter.
Risks & watch-outs
- Watch-outs: HOA is 21% of rent.
Questions for the listing agent
- Built in 1976 — when were the roof, HVAC, electrical panel, plumbing, and water heater last replaced?
- What does the HOA fee cover, when was the last increase, and are there any pending special assessments or reserve-fund shortfalls?
- Any open or pending special assessments — roof, HVAC, plumbing, elevator, façade? What's the per-unit balance and payoff schedule, and is the seller paying it off at close or rolling it to the buyer?
- Is there a deadline driving the sale (1031 exchange, divorce, estate, relocation)? That informs how much negotiation room exists.
- Schools are F-rated, which usually means shorter tenancies and higher turnover. Who's the typical renter profile here, and what's been the actual vacancy rate?
- Crime grade is F in this area — have there been break-ins, vandalism, or insurance claims at this property in the last 3 years? What carrier currently insures it and at what premium?
- What's the average days-on-market for RENTAL listings here right now (not sales)? A rising rental-DOM trend means longer vacancies and softer asking-rent achievability than the comps imply.
- What's the recent tenant-quality profile in this submarket — average credit score on applications, eviction rate, late-payment / NSF rate, and stable-employment percentage? A property-management company in the area should have these aggregated.
- How much new apartment / multifamily construction is in the pipeline within 1–3 miles? Heavy new supply (>2% of stock underway) typically softens rents 12–24 months out; light construction supports rent growth.
Investment metrics
- 1% rule
- 1.44% ✓
- Cap rate
- 7.82%
- Cash-on-cash
- 5.45%
- DSCR
- 1.24
- GRM
- 5.8
CMA / ARV
No comps found within radius.
Projected returns pro-forma
-3.0% appreciation · 3.0% rent growth · sell at horizon
- IRR
- -7.6%
- Equity multiple
- 0.72×
- Total profit
- $-7,102
- Equity at exit
- $13,419
- IRR
- 2.2%
- Equity multiple
- 1.16×
- Total profit
- $3,994
- Equity at exit
- $7,782
Cash invested: $25,200 (down + closing). Projections, not guarantees.
Landlord ↔ Tenant lean methodology
- Overall (STATE)
- 43 Moderately Tenant-Leaning
- State Illinois
- 43 Moderately Tenant-Leaning · D+7
- County
- — inherits STATE
- City
- — inherits STATE
ZIP-level market 61615
- Home prices YoY
- -32.2%
- Active inventory
- 127
- Price-to-rent
- 5.8×
Monthly cashflow live
- Estimated rent
- $1,296 high interval (Pro) →
- Mortgage (P&I)
- −$472
- Tax from tax record
- −$129 /mo · $1,549/yr
- Insurance
- −$38
- HOA
- −$271
- Vacancy / Maint / Mgmt
- −$272
- Net cashflow
- $114
Break-even live
UW: 25.0% down · 7.5% · 30yr · 1.5% tax · 5.0% vac · 8.0% maint · 8.0% mgmt
Financing live
Cash to close
- Down payment
- $22,500
- Closing costs
- $2,700
- Reserves months
- —
- Total cash needed
- —
Loan-product check · same deal, 3 products live
Conventional
25% down · 7.5% · 30yr
- Down + closing
- —
- Monthly P&I
- —
- Monthly cashflow
- —
- DSCR
- —
- Eligible?
- —
Personal DTI + credit; lowest rate.
DSCR
20% down · 8.5% · 30yr
- Down + closing
- —
- Monthly P&I
- —
- Monthly cashflow
- —
- DSCR
- —
- Eligible?
- —
No personal income docs; deal must DSCR.
Hard money
10% down · 12.0% · 12mo
- Down + closing
- —
- Monthly P&I
- —
- Monthly cashflow
- —
- DSCR
- —
- Eligible?
- —
Short-term bridge; refi at stabilization.
Rent comps 8 comps
| Address | Beds | Baths | Sqft | Rent | $/sqft | DOM | Units | Dist |
|---|---|---|---|---|---|---|---|---|
| 4105 W Hollow Creek Dr Peoria, IL | 2.0 | 2.0 | 1121 | $1,300 | $1.16 | 13d | 3 | 0.22mi |
| 6900 N Summershade Cir Peoria, IL | 1.0–2.0 | 1.0–2.0 | 832 | $1,340 | $1.61 | 13d | 3 | 0.61mi |
| 3207 W Willow Knolls Dr Peoria, IL | 2.0 | 1.5 | 1000 | $1,100 | $1.10 | 43d | 1 | 1.08mi |
| 5505 N Frostwood Pkwy Peoria, IL | 2.0 | 2.0 | 1030 | $1,490 | $1.45 | 13d | 1 | 1.13mi |
| 5745 Autumn Ridge Ct Apt A Peoria, IL | 3.0 | 1.0 | 1150 | $1,100 | $0.96 | 43d | 1 | 1.31mi |
| 5605 N Withershin Pt Peoria, IL | 2.0 | 2.0 | 1000 | $1,335 | $1.33 | 13d | 1 | 1.42mi |
| 5605 N Withershin Pt Unit 1 Peoria, IL | 2.0 | 2.0 | 1000 | $1,335 | $1.33 | 13d | 1 | 1.42mi |
| 5711 W Ridgecrest Dr Peoria, IL | 1.0–2.0 | 1.0–2.0 | 875 | $1,095 | $1.25 | 13d | 8 | 1.42mi |
HOA detail condo
- Monthly dues
- $271 · $3,252/yr
- Assessments
- None detected in remarks — confirm with the listing agent.
Listing history 6 events
-
2026-06-03statusdays on market $90,000 Pending 4 DOM
-
2026-06-02days on market $90,000 Active 3 DOM
-
2026-06-01remarks 689-char remark
-
2026-06-01days on market $90,000 Active 2 DOM
-
2026-05-31remarks 683-char remark
-
2026-05-31$90,000 Active 1 DOM
ⓘ Source: listings_history table (triggers on properties + properties_extension) + one-shot
backfill from property_details.listing_events for pre-trigger history.
Tax reassessment forecast IL · Partial reset (capped growth)
- Current annual tax
- $1,549 · $129/mo
- Projected year-2 tax
- $1,796 · $150/mo
- Expected delta
- +$247/yr (+$21/mo · 16.0%)
ⓘ Screening estimate from a state-policy table — verify with the county assessor before closing.
Climate risk First Street
- Flood 1/10 Low FEMA zone X · 0% chance over 30 yrs
- Wildfire 1/10 Low
- Heat 3/10 Moderate 7 d/yr ≥104°F today · 18 d/yr by 30 yrs out
- Wind 2/10 Low 100% chance of damaging wind over 30 yrs
- Air quality 2/10 Low 1 unhealthy d/yr today · 2 by 30 yrs out
Nearby sold comps map
Loading sold comps map…
Walkable amenities ~0.75 mi
Loading nearby amenities…
Taxation est. · year 1
- Rental income
- $15,553
- − Mortgage interest
- −$5,041
- − Property taxes
- −$1,549
- − Insurance
- −$450
- − Repairs & maintenance
- −$1,244
- − Management
- −$1,244
- − HOA
- −$3,252
- − Depreciation
- −$2,618
- Taxable income
- $154
- Est. tax owed @ 24.0%
- −$37
- After-tax cash flow
- $1,336/yr
For passive investors: Depreciation is non-cash, so a rental often shows a tax loss while cash-flowing — sheltering income. Rental losses are passive: they offset passive income freely, and up to $25,000/yr can offset ordinary (W-2) income if you actively participate and your MAGI is under $100k (phasing out to $0 by $150k); unused losses carry forward. On sale, claimed depreciation is recaptured at up to 25%, and gains may owe capital-gains tax (a 1031 exchange can defer both). Figures are a year-1 estimate at your 24.0% rate — not tax advice; consult a CPA.
Schools (NCES district)
- District
- Peoria SD 150
- NCES district ID
- 1731230
- Math proficiency
- 11% ▼ -5.00%
- Reading proficiency
- 14% ▼ -4.00%
- Median HH income
- $41,951
- Composite
- 10.92/100
- National rank
- #9751
- State rank
- #554 of 620 in IL
Livability — Peoria
- Score
- 73/100
- State rank
- #270
- US rank
- #5096
Category grades
Schools grade is shown separately in the Schools card above.
Census & demographics
- Census place
- Peoria, IL
- County
- Peoria County · 120,495 people
- City population
- 114,670
- Metro
- Peoria, IL
- Population (ZIP)
- 23,523
- Household income
- $79,817
- Rent vs Own
- Severe rent burden
- 833.0
Population outlook (Peoria County) Hauer SSP2
- Today (2025)
- 183,007 people
- By 2030
- 179,643 · -1.8%
- By 2040
- 171,782 · -6.1%
- By 2050
- 163,508 · -10.7%
- By 2075
- 140,178 · -23.4%
- By 2100
- 114,493 · -37.4%
Race, ethnicity, and origin ACS 2023
- Neighborhood character
- Predominantly White (72%)
- Race & ethnicity
- White 72% Asian 10% Black 8% Hispanic / Latino 7% Two or more races 5%
- Hispanic origin (detail)
- Mexican 5%
- Common ancestry
- Italian 3% Romanian 3% Lithuanian 2%
- Foreign-born
- 13% · China, Canada, Jamaica
- Languages at home
- 83% English-only · Other Indo-European 4% Spanish 4% Chinese 3%
Political lean MEDSL · Peoria
- 2024 margin
- Toss-up / Even · D 51.5% · R 46.9% · Other 1.6%
- 2008→2024 swing
- -9.2pp toward R · 2008: 13.9pp · 2024: 4.7pp
- All cycles
- 2024: D+4.7 2020: D+6.3 2016: D+2.8 2012: D+4.4 2008: D+13.9
Not yet ingested
- Civics
- —
Market trends
- HPI YoY
- ▼ -79.30%
- Current HPI
- 166.9745
- Rent YoY
- —
- Metro
- Peoria, IL
- State GDP YoY
- ▲ 1.59%
- F500 in state
- 60
Industry mix (Fortune 500 HQ in IL)
| Industry | F500 HQs | Revenue |
|---|---|---|
| Insurance | 4 | $201B |
|
||
| Consumer Goods | 4 | $87B |
|
||
| Industrial Machinery | 3 | $64B |
|
||
| Healthcare | 2 | $55B |
|
||
| Retail / Pharmacy | 1 | $148B |
|
||
| Agriculture / Food | 1 | $86B |
|
||
Price history
+20.0% since first listed8 events — show timeline
- 2026-05-29 Listed $90,000 RMLSA as Distributed by MLS Grid
- 2025-12-17 Listing Removed — MRED as Distributed by MLS Grid
- 2025-09-22 Pending — RMLSA as Distributed by MLS Grid
- 2025-09-22 Listing Removed — RMLSA as Distributed by MLS Grid
- 2025-07-20 Listed — RMLSA as Distributed by MLS Grid
- 2013-08-12 Sold (Public Records) $79,000 Public Records
- 1992-10-12 Sold (Public Records) $75,000 Public Records
- 1992-10-12 Sold (Public Records) $75,000 Public Records
Property tax history
-2.7%/yrLatest (2024): $1,549 · +0.8% YoY. Source: county tax records.
Cash-flow waterfall
monthlySold comps — $/sqft
last 12 mo · ≤1 miLoading sold comps…