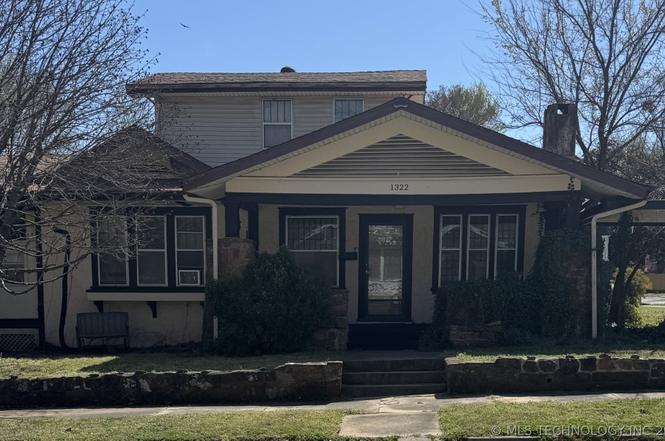
1322 W Easton Pl · Tulsa, OK
Flood risk 1/10 · Minimal
- FEMA flood zone
- X (unshaded)
- Chance of flooding over 30 yrs
- 0.0%
- Est. flood insurance / yr
- $507 – $1,088
Fire risk 4/10 · Minor
- Est. fire insurance / yr
- $2,463 – $4,575
Heat risk 6/10 · Moderate
- Hot days now (above 110°F)
- 7 days/yr
- Hot days in 30 yrs
- 17 days/yr
Wind risk 3/10 · Minor
- Chance of severe wind over 30 yrs
- 4.0%
Air-quality risk 2/10 · Minimal
- Unhealthy air days now
- 2 days/yr
- Unhealthy air days in 30 yrs
- 2 days/yr
Risk factors via First Street. Map © Google.
Why this score? — see what drove the B- grade
The composite is a weighted blend of 9 inputs, each scored 0–100. Each bar is that input's sub-score; the figure is the points it added to the 100-point composite (weight × sub-score).
- Cash flow +28.6/30.0
- ARV discount +10.2/15.0
- DSCR +10.0/10.0
- 1% rule +6.8/10.0
- Livability +3.8/5.0
- Rent growth +3.1/5.0
- Condition / age +2.5/5.0
- Schools +0.8/10.0
- Appreciation +0.0/10.0
$175,000
🖨 Deal sheet 📄 Offer letter ✓ Due diligence
Listing remarks MLS
TONS OF CHARM! TWO STORY HOME WITH LARGE FRONT PORCH. NEEDS SOME WORK. NO FHA OR VA. SELLER IS RELATED TO LISTING ASSOCIATE.
Key facts
- Old glass windows
- Large front porch
- Original wood floors
Tags
Property features AI
Finance
- HOA & community: Sidewalks and gutters in the community
Exterior
- Parking: Detached garage with workshop space (1-car)
- Security: Smoke detector(s); No safety shelter
- Utilities: Public water; Public sewer; Electricity available; Natural gas available; Cable and high-speed internet available; Phone available
- Home design: Faces north; Basement and crawlspace foundation
- Construction: Stucco and vinyl siding over wood frame; Asphalt/fiberglass roof
- Exterior features: Covered, enclosed porch with deck; Stamped concrete driveway; Rain gutters; Chain link fencing; Mature trees on lot
Interior
- Kitchen: Dishwasher; Oven; Range; Refrigerator
- Bedrooms: Master bedroom on first floor (no attached bath); Additional bedrooms on first and second floors (no attached baths)
- Flooring: Carpet; Wood
- Bathrooms: One full bathroom with bathtub (hall bath); One half bathroom
- Heating & cooling: Central heating (gas); Central air conditioning (two units)
- Interior features: Ceiling fan(s); Laminate counters; Wood and wood veneer trim and window frames; Storm windows and storm door(s); Gas range/oven connections
- Laundry & utility: Washer hookup; Electric dryer hookup; Utility room in basement (inside)
Neighborhood map
What this means for you Summary
Snapshot
- This is a 3-bed/1.5-bath single-family listed at $175k.
Deal economics
- At list price, monthly cash flow is $578 ($7k/yr) — positive.
- The deal already cash-flows at list — no discount required.
- Meets the 1% rule at list price ($2k rent vs $175k).
- Recommended offer: $154k (12.0% below list) — sets the bar for market timing.
- Cap rate 10.3% vs local median 3.9% in Tulsa — top-decile yield for the area; either an underpriced asset or a hidden risk that comps aren't pricing in. Stress-test before assuming the spread holds.
Location & tenants
- Location reads 75/100 on livability (#13 in OK, #4,058 nationally) — a middle-class / working-renter tenant base. Strengths: amenities A+, commute A+, cost of living A+; Watch: schools F, crime F, employment D-.
- Tulsa (urban): math 7% / reading 12% proficiency, ranked #250 of 270 in OK (top 93%) — low school quality limits family demand, transient renter base, plan for 1-2y turnover; 76% free/reduced lunch — lower-income household profile, screen leases tightly.
- Market conditions: Rents rising (+2.5%/yr); 113 active listings in the ZIP; 28 comparable units currently listed for rent nearby; rentals at typical pace (median 16d on market — plan ~3-4 weeks tenant-placement turnaround); 2,818 units permitted in Tulsa County in 2024 (518 in 5+ unit buildings).
- At $2,071/mo this rent would consume 54% of the median local household income ($46k/yr) (locally 782% of renters already pay >50% of income on rent) — very limited rent-growth headroom before tenants either downsize or default.
Forward outlook
- Local home prices are declining (-3.0%/yr); year-one equity from $1k of loan paydown is wiped out by about $5k of value loss. Plan a longer hold.
- Tulsa County population projected at +30% by 2050 — long-run rental-demand tailwind backs the buy-and-hold thesis.
- At projected returns (-3.0% appreciation + 2.5% rent growth), your $49k cash investment doubles in ~9 years — after that, you're playing with house money.
Negotiation context
- It's been on market 137 days — a 12% lower offer ($154k) is reasonable based on typical stale-listing flexibility.
- 3 sale attempts since 22y ago with the ask held roughly flat each time — persistent listings suggest the price (not the market) is what's stuck; bring a comps-based counter.
- Current owner paid $64k; list at $175k implies a 171% gain — meaningful room to come down on a strong offer.
Risks & watch-outs
- Watch-outs: built in 1920 — expect roof / HVAC / electrical / plumbing capex.
- Climate carrying-cost: extreme-heat days projected 7→17/yr by 2055 (HVAC capex compounding) — expect insurance premiums to compound above CPI over the hold.
Questions for the listing agent
- It's been on market 137 days. Have you received any prior offers? Is the seller open to a 12% concession, seller financing, or rate buy-down credit?
- Built in 1920 — when were the roof, HVAC, electrical panel, plumbing, and water heater last replaced?
- Why hasn't it sold? Are there any deal-killer items the seller is aware of (foundation, flood, title, zoning, code violations)?
- Is there a deadline driving the sale (1031 exchange, divorce, estate, relocation)? That informs how much negotiation room exists.
- Schools are F-rated, which usually means shorter tenancies and higher turnover. Who's the typical renter profile here, and what's been the actual vacancy rate?
- Crime grade is F in this area — have there been break-ins, vandalism, or insurance claims at this property in the last 3 years? What carrier currently insures it and at what premium?
- What's the average days-on-market for RENTAL listings here right now (not sales)? A rising rental-DOM trend means longer vacancies and softer asking-rent achievability than the comps imply.
- What's the recent tenant-quality profile in this submarket — average credit score on applications, eviction rate, late-payment / NSF rate, and stable-employment percentage? A property-management company in the area should have these aggregated.
- How much new for-sale + rental construction is in the pipeline within 1–3 miles? Heavy new supply typically softens prices + rents 12–24 months out; constrained supply supports both.
Investment metrics
- 1% rule
- 1.18% ✓
- Cap rate
- 10.26%
- Cash-on-cash
- 14.17%
- DSCR
- 1.63
- GRM
- 7.0
CMA / ARV
- ARV (on-the-fly)
- $186,160
- Comps found
- 12
Show comp detail 12 sales within ~0.75 mi
| Address | Dist | Beds/Ba | Sqft | Sold | Price | $/sf | Match |
|---|---|---|---|---|---|---|---|
| 308 N Tacoma Ave | 0.22mi | 3/1.0 | 1,479 (+3%) | 4mo | $117,000 | $79 | 79 |
| 613 N Yukon Ave | 0.48mi | 3/2.0 | 1,456 (+2%) | 7mo | $213,000 | $146 | 67 |
| 1740 W Fairview St | 0.29mi | 2/1.5 (-1) | 1,544 (+8%) | 3mo | $167,000 | $108 | 66 |
| 148 N Union Ave | 0.33mi | 4/2.0 (+1) | 1,334 (-7%) | 3mo | $73,000 | $55 | 64 |
| 1815 W Cameron St | 0.33mi | 3/2.0 | 1,623 (+13%) | 2mo | $240,000 | $148 | 59 |
| 647 N Union Pl | 0.32mi | 3/1.5 | 1,612 (+13%) | 8mo | $280,000 | $174 | 57 |
| 1812 W Reconciliation Way | 0.36mi | 3/3.0 | 1,264 (-12%) | 1mo | $245,000 | $194 | 57 |
| 782 N Zenith Ave | 0.66mi | 3/2.0 | 1,346 (-6%) | 1mo | $127,000 | $94 | 56 |
| 923 N Denver Ave | 0.73mi | 3/1.0 | 1,344 (-6%) | 2mo | $96,500 | $72 | 52 |
| 1407 W Admiral Blvd | 0.40mi | 2/2.0 (-1) | 1,260 (-12%) | 7mo | $84,000 | $67 | 48 |
| 704 N Zenith Ave | 0.61mi | 3/2.0 | 1,627 (+14%) | 2mo | $265,000 | $163 | 45 |
| 212 S Phoenix Ave | 0.63mi | 3/1.5 | 1,632 (+14%) | 3mo | $212,000 | $130 | 45 |
Match score weights: distance 35% · size 25% · config 20% · recency 20%. Top-matched comps best support the ARV.
Projected returns pro-forma
-3.0% appreciation · 2.45% rent growth · sell at horizon
- IRR
- 3.9%
- Equity multiple
- 1.15×
- Total profit
- $7,281
- Equity at exit
- $26,093
- IRR
- 12.9%
- Equity multiple
- 2.00×
- Total profit
- $48,901
- Equity at exit
- $15,131
Cash invested: $49,000 (down + closing). Projections, not guarantees.
Landlord ↔ Tenant lean methodology
- Overall (STATE)
- 83 Strongly Landlord-Friendly
- State Oklahoma
- 83 Strongly Landlord-Friendly · R+20
- County
- — inherits STATE
- City
- — inherits STATE
ZIP-level market 74127
- Home prices YoY
- -20.4%
- Rents YoY
- 2.5%
- Active inventory
- 113
- Price-to-rent
- 7.0×
Monthly cashflow live
- Estimated rent
- $2,071 high interval (Pro) →
- Mortgage (P&I)
- −$918
- Tax from tax record
- −$67 /mo · $802/yr
- Insurance
- −$73
- HOA
- −$0
- Vacancy / Maint / Mgmt
- −$435
- Net cashflow
- $578
Break-even live
UW: 25.0% down · 7.5% · 30yr · 1.5% tax · 5.0% vac · 8.0% maint · 8.0% mgmt
Financing live
Cash to close
- Down payment
- $43,750
- Closing costs
- $5,250
- Reserves months
- —
- Total cash needed
- —
Loan-product check · same deal, 3 products live
Conventional
25% down · 7.5% · 30yr
- Down + closing
- —
- Monthly P&I
- —
- Monthly cashflow
- —
- DSCR
- —
- Eligible?
- —
Personal DTI + credit; lowest rate.
DSCR
20% down · 8.5% · 30yr
- Down + closing
- —
- Monthly P&I
- —
- Monthly cashflow
- —
- DSCR
- —
- Eligible?
- —
No personal income docs; deal must DSCR.
Hard money
10% down · 12.0% · 12mo
- Down + closing
- —
- Monthly P&I
- —
- Monthly cashflow
- —
- DSCR
- —
- Eligible?
- —
Short-term bridge; refi at stabilization.
Rent comps 28 comps
| Address | Beds | Baths | Sqft | Rent | $/sqft | DOM | Units | Dist |
|---|---|---|---|---|---|---|---|---|
| 209 N Xenophon Ave Unit B Tulsa, OK | 3.0 | 2.0 | 1150 | $1,500 | $1.30 | 23d | 1 | 0.43mi |
| 424 N Boulder Ave Tulsa, OK | 1.0–3.0 | 1.0–2.5 | 1220 | $3,699 | $3.03 | 1d | 62 | 0.64mi |
| 2521 W Cameron St Tulsa, OK | 3.0 | 1.5 | 1161 | $1,295 | $1.12 | 19d | 1 | 0.75mi |
| 1127 N Boston Ave Tulsa, OK | 4.0 | 2.0 | 1745 | $2,275 | $1.30 | 23d | 1 | 0.98mi |
| 403 S Cheyenne Ave Tulsa, OK | 2.0 | 1.0–2.0 | 750 | $1,799 | $2.40 | 1d | 8 | 1.04mi |
| 1152 N Boston Pl Tulsa, OK | 4.0 | 2.0 | 1756 | $2,550 | $1.45 | 23d | 1 | 1.04mi |
| 406 S Boulder Ave Tulsa, OK | 1.0–2.0 | 1.0–2.0 | 1082 | $2,906 | $2.69 | 15d | 3 | 1.07mi |
| 324 S Main St Tulsa, OK | 1.0–2.0 | 1.0–2.0 | 757 | $1,807 | $2.39 | 1d | 6 | 1.08mi |
| 9 E 4th St Tulsa, OK | 3.0 | 1.0–2.0 | 894 | $2,499 | $2.80 | 1d | 5 | 1.11mi |
| 420 S Main St Tulsa, OK | 2.0 | 1.0–2.0 | 1291 | $2,700 | $2.09 | 1d | 13 | 1.14mi |
| 310 E 1st St Tulsa, OK | 1.0–2.0 | 1.0–2.0 | 1110 | $2,870 | $2.58 | 19d | 5 | 1.14mi |
| 310 E 1st St Tulsa, OK | 1.0–2.0 | 1.0–2.0 | 1226 | $2,870 | $2.34 | 1d | 4 | 1.14mi |
| 420 E Archer St Tulsa, OK | 1.0–2.0 | 1.0–2.5 | 1159 | $3,646 | $3.15 | 1d | 30 | 1.15mi |
| 1303 S Lawton Ave Tulsa, OK | 2.0 | 2.0 | 1250 | $1,575 | $1.26 | 3d | 1 | 1.15mi |
| 205 E Marshall St Tulsa, OK | 3.0 | 2.0 | 1452 | $1,725 | $1.19 | 23d | 1 | 1.16mi |
| 6 E 5th St Unit 105 Tulsa, OK | 2.0 | 2.0 | 1361 | $2,450 | $1.80 | 21d | 1 | 1.19mi |
| 6 E 5th St Unit 703 Tulsa, OK | 2.0 | 2.0 | 962 | $1,731 | $1.80 | 21d | 1 | 1.19mi |
| 6 E 5th St Tulsa, OK | 1.0–2.0 | 1.0–2.0 | 1103 | $2,500 | $2.27 | 15d | 4 | 1.19mi |
| 1321 S Lawton Ave Tulsa, OK | 2.0 | 2.0 | 1744 | $1,623 | $0.93 | 21d | 1 | 1.19mi |
| 415 E 2nd St S Tulsa, OK | 1.0–2.0 | 1.0–2.0 | 807 | $2,180 | $2.70 | 1d | 28 | 1.21mi |
| 1000 S Denver Ave Tulsa, OK | 1.0–2.0 | 1.0–2.0 | 940 | $1,546 | $1.64 | 1d | 19 | 1.26mi |
| 505 E 2nd St S Tulsa, OK | 2.0 | 2.0 | 1087 | $2,180 | $2.01 | 2d | 1 | 1.27mi |
| 401 S Elgin Ave Tulsa, OK | 1.0–2.0 | 1.0–2.0 | 770 | $1,499 | $1.95 | 23d | 3 | 1.33mi |
| 211 S Greenwood Ave Tulsa, OK | 1.0–2.0 | 1.0–2.0 | 933 | $2,344 | $2.51 | 1d | 3 | 1.36mi |
| 1703 S Jackson Ave Tulsa, OK | 1.0–2.0 | 1.0–2.0 | 745 | $1,409 | $1.89 | 23d | 28 | 1.44mi |
| 1703 S Jackson Ave Tulsa, OK | 1.0–2.0 | 1.0–2.0 | 745 | $1,375 | $1.84 | 15d | 1 | 1.44mi |
| 1401 S Elwood Ave Tulsa, OK | 3.0 | 1.0 | 1373 | $1,850 | $1.35 | 23d | 1 | 1.47mi |
| 7125 N 220th RD Tulsa, OK | 2.0 | 1.0–2.0 | 750 | $2,800 | $3.73 | 10d | 37 | 1.49mi |
Listing history 21 events
-
2026-06-18days on market $175,000 Active 137 DOM
-
2026-06-17days on market $175,000 Active 136 DOM
-
2026-06-16days on market $175,000 Active 135 DOM
-
2026-06-15days on market $175,000 Active 134 DOM
-
2026-06-13days on market $175,000 Active 132 DOM
-
2026-06-10days on market $175,000 Active 129 DOM
-
2026-06-09days on market $175,000 Active 128 DOM
-
2026-06-08days on market $175,000 Active 127 DOM
-
2026-06-07days on market $175,000 Active 126 DOM
-
2026-06-05days on market $175,000 Active 123 DOM
-
2026-06-03days on market $175,000 Active 122 DOM
-
2026-06-02days on market $175,000 Active 121 DOM
-
2026-06-01days on market $175,000 Active 120 DOM
-
2026-05-31days on market $175,000 Active 119 DOM
-
2026-01-23$175,000 Active
-
2005-12-14soldstatus $64,500
-
2005-12-12soldstatus $64,500 124-char remark
Show marketing remark (124 chars)
TONS OF CHARM! TWO STORY HOME WITH LARGE FRONT PORCH. NEEDS SOME WORK. NO FHA OR VA. SELLER IS RELATED TO LISTING ASSOCIATE.
-
2005-11-23historical 124-char remark
Show marketing remark (124 chars)
TONS OF CHARM! TWO STORY HOME WITH LARGE FRONT PORCH. NEEDS SOME WORK. NO FHA OR VA. SELLER IS RELATED TO LISTING ASSOCIATE.
-
2005-09-19$72,500 124-char remark
Show marketing remark (124 chars)
TONS OF CHARM! TWO STORY HOME WITH LARGE FRONT PORCH. NEEDS SOME WORK. NO FHA OR VA. SELLER IS RELATED TO LISTING ASSOCIATE.
-
2004-08-25historical
-
2004-02-23$65,000
ⓘ Source: listings_history table (triggers on properties + properties_extension) + one-shot
backfill from property_details.listing_events for pre-trigger history.
Tax reassessment forecast OK · Resets to sale price
- Current annual tax
- $802 · $67/mo
- Projected year-2 tax
- $1,575 · $131/mo
- Expected delta
- +$773/yr (+$64/mo · 96.4%)
ⓘ Screening estimate from a state-policy table — verify with the county assessor before closing.
Climate risk First Street
- Flood 1/10 Low FEMA zone X (unshaded) · 0% chance over 30 yrs
- Wildfire 4/10 Moderate
- Heat 6/10 Major 7 d/yr ≥110°F today · 17 d/yr by 30 yrs out
- Wind 3/10 Moderate 4% chance of damaging wind over 30 yrs
- Air quality 2/10 Low 2 unhealthy d/yr today · 2 by 30 yrs out
Nearby sold comps map
Loading sold comps map…
Walkable amenities ~0.75 mi
Loading nearby amenities…
Taxation est. · year 1
- Rental income
- $24,849
- − Mortgage interest
- −$9,803
- − Property taxes
- −$802
- − Insurance
- −$875
- − Repairs & maintenance
- −$1,988
- − Management
- −$1,988
- − Depreciation
- −$5,091
- Taxable income
- $4,303
- Est. tax owed @ 24.0%
- −$1,033
- After-tax cash flow
- $5,909/yr
For passive investors: Depreciation is non-cash, so a rental often shows a tax loss while cash-flowing — sheltering income. Rental losses are passive: they offset passive income freely, and up to $25,000/yr can offset ordinary (W-2) income if you actively participate and your MAGI is under $100k (phasing out to $0 by $150k); unused losses carry forward. On sale, claimed depreciation is recaptured at up to 25%, and gains may owe capital-gains tax (a 1031 exchange can defer both). Figures are a year-1 estimate at your 24.0% rate — not tax advice; consult a CPA.
Schools (NCES district)
- District
- Tulsa
- NCES district ID
- 4030240
- Math proficiency
- 7% ▼ -9.00%
- Reading proficiency
- 12% ▼ -7.00%
- Median HH income
- $37,895
- Composite
- 8.04/100
- National rank
- #9919
- State rank
- #250 of 270 in OK
Livability — Tulsa
- Score
- 75/100
- State rank
- #13
- US rank
- #4058
Category grades
Schools grade is shown separately in the Schools card above.
Census & demographics
- Census place
- Tulsa, OK
- County
- Osage County · 26,244 people
- City population
- 389,418
- Metro
- Tulsa, OK
- Population (ZIP)
- 16,324
- Household income
- $46,373
- Rent vs Own
- Severe rent burden
- 782.0
Population outlook (Tulsa County) Hauer SSP2
- Today (2025)
- 723,846 people
- By 2030
- 766,033 · +5.8%
- By 2040
- 851,386 · +17.6%
- By 2050
- 938,389 · +29.6%
- By 2075
- 1,166,011 · +61.1%
- By 2100
- 1,350,277 · +86.5%
Race, ethnicity, and origin ACS 2023
- Neighborhood character
- Diverse neighborhood (Simpson 0.66)
- Race & ethnicity
- White 50% Black 28% Two or more races 10% Hispanic / Latino 7% Native American 7%
- Hispanic origin (detail)
- Mexican 5%
- Common ancestry
- Slovak 2% Italian 1% Iranian 1%
- Foreign-born
- 4% · Canada, Jamaica
- Languages at home
- 94% English-only · Spanish 4%
Political lean MEDSL · Tulsa
- 2024 margin
- R (+15.2) · D 41.3% · R 56.5% · Other 2.2%
- 2008→2024 swing
- +9.2pp toward D · 2008: -24.5pp · 2024: -15.2pp
- All cycles
- 2024: R+15.2 2020: R+15.6 2016: R+22.9 2012: R+27.4 2008: R+24.5
Not yet ingested
- Civics
- —
Market trends
- HPI YoY
- ▼ -59.31%
- Current HPI
- 231.5994
- Rent YoY
- ▲ 2.45%
- Metro
- Tulsa, OK
- State GDP YoY
- ▲ 1.55%
- F500 in state
- 6
Industry mix (Fortune 500 HQ in OK)
| Industry | F500 HQs | Revenue |
|---|---|---|
| Energy | 3 | $48B |
|
||
Price history
+169.2% since first listed7 events — show timeline
- 2026-01-23 Listed $175,000 MLS Technology, Inc.
- 2005-12-14 Sold (Public Records) $64,500 Public Records
- 2005-12-12 Sold (MLS) $64,500 MLS Technology, Inc.
- 2005-11-23 Listing Removed — MLS Technology, Inc.
- 2005-09-19 Listed $72,500 MLS Technology, Inc.
- 2004-08-25 Listing Removed — MLS Technology, Inc.
- 2004-02-23 Listed $65,000 MLS Technology, Inc.
Property tax history
-0.1%/yrLatest (2025): $802 · +3.5% YoY. Source: county tax records.
Cash-flow waterfall
monthlySold comps — $/sqft
last 12 mo · ≤1 miLoading sold comps…