12368 SW Lexington Pl · Harbour Heights, FL
Flood risk 1/10 · Minimal
- FEMA flood zone
- X (unshaded)
- Chance of flooding over 30 yrs
- 0.0%
- Est. flood insurance / yr
- $507 – $1,088
Fire risk 5/10 · Moderate
- Est. fire insurance / yr
- $947 – $1,759
Heat risk 10/10 · Severe
- Hot days now (above 108°F)
- 7 days/yr
- Hot days in 30 yrs
- 27 days/yr
Wind risk 10/10 · Severe
- Chance of severe wind over 30 yrs
- 99.0%
Air-quality risk 2/10 · Minimal
- Unhealthy air days now
- 2 days/yr
- Unhealthy air days in 30 yrs
- 2 days/yr
Risk factors via First Street. Map © Google.
Why this score? — see what drove the D- grade
The composite is a weighted blend of 9 inputs, each scored 0–100. Each bar is that input's sub-score; the figure is the points it added to the 100-point composite (weight × sub-score).
- Cash flow +13.0/30.0
- ARV discount +7.5/15.0
- DSCR +3.9/10.0
- 1% rule +3.8/10.0
- Livability +3.2/5.0
- Schools +2.6/10.0
- Rent growth +2.5/5.0
- Condition / age +2.5/5.0
- Appreciation +0.6/10.0
$215,000
🖨 Deal sheet 📄 Offer letter ✓ Due diligence
Listing remarks MLS
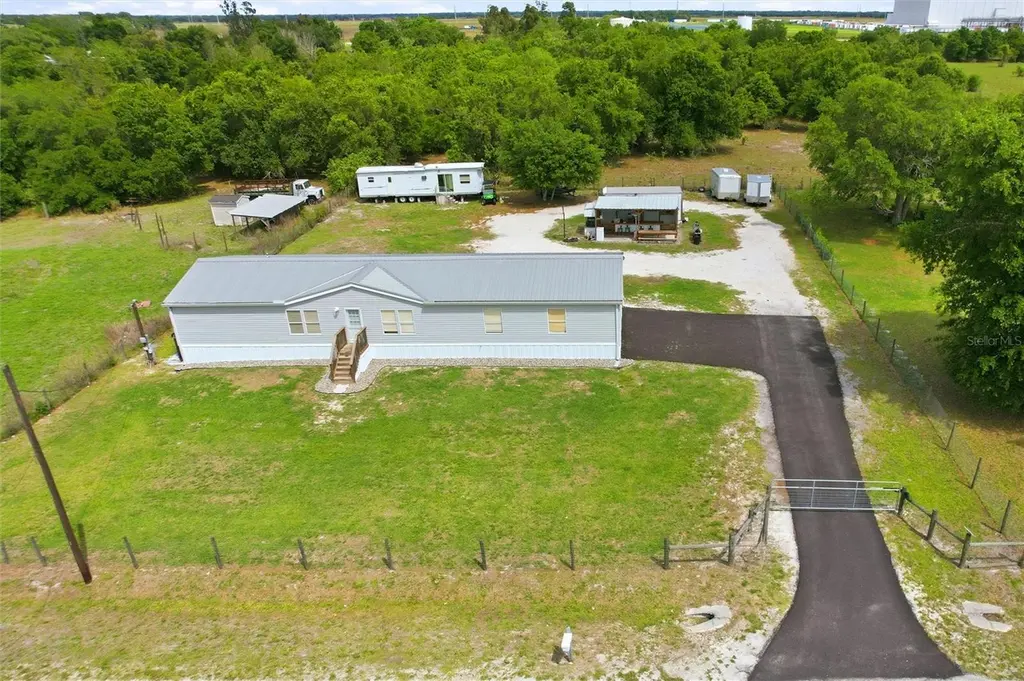
Nice lot in a desirable area with beautiful large oaks with a mobile that needs repairs. The property is being sold as vacant land and is a short distance from I-75 and just around the corner from Kings Hwy. Close to Arcadia or enjoy gulf at the new golf course being re-modeled in the area.
Key facts
- Fully fenced
- Paved driveway
- Gated entrance
Tags
Property features AI
Finance
- Other: Zoned RMF-M; Lot size approximately 0.62 acres (135 x 200); Public-maintained paved road access
- HOA & community: No HOA/association; Pets allowed
Exterior
- Parking: Boat parking; Driveway parking; Oversized parking
- Utilities: Well water; Septic system; Electricity available and connected; Cable available
- Home design: Manufactured double-wide home; Single-story; Faces west; Homestead eligible
- Construction: Vinyl siding; Metal roof; Built on crawlspace and slab foundation
- Exterior features: Patio; Exterior lighting; Rain gutters; Cleared, oversized lot on a paved dead-end street
Interior
- Kitchen: Range; Microwave; Refrigerator
- Bedrooms: 3 bedrooms
- Flooring: Laminate; Living area reported as 2052 square feet
- Bathrooms: 2 full bathrooms
- Heating & cooling: Central heating; Central air conditioning
- Interior features: Ceiling fans; High ceilings; Open floor plan; Living room/dining room combo; Split bedroom layout
- Laundry & utility: Washer hookup; Dryer hookup; Dedicated laundry room
Neighborhood map
What this means for you Summary
Snapshot
- This is a 3-bed/2.0-bath manufactured listed at $215k.
Deal economics
- At list price, monthly cash flow is $-13 ($-162/yr) — negative.
- To cash-flow at today's rent, offer at most $213k (1.1% below list).
- To meet the 1% rule (rent ≥ 1% of price), the offer needs to be $190k (11.5% below list).
- Recommended offer: $190k (11.5% below list) — sets the bar for 1% rule.
- Cap rate 6.2% vs local median 4.0% in Harbour Heights — top-decile yield for the area; either an underpriced asset or a hidden risk that comps aren't pricing in. Stress-test before assuming the spread holds.
Location & tenants
- Location reads 64/100 on livability (#684 in FL) — a middle-class / working-renter tenant base. Strengths: crime A+, housing A+, employment B; Watch: schools F, amenities F, commute F.
- Desoto (town): math 31% / reading 32% proficiency, ranked #69 of 73 in FL (top 94%) — families likely to look elsewhere, expect single-tenant / working-renter base with shorter leases; 71% free/reduced lunch — lower-income household profile, screen leases tightly.
- Market conditions: 149 active listings in the ZIP; 71 units permitted in DeSoto County in 2024 (0 in 5+ unit buildings).
Forward outlook
- Local home prices are declining (-3.0%/yr); year-one equity from $1k of loan paydown is wiped out by about $6k of value loss. Plan a longer hold.
- DeSoto County population projected at -10% by 2050 — secular population decline; favor cash flow + early exit over multi-decade hold.
Negotiation context
- Only 13 days on market — expect competitive offers; lowballing is unlikely to land.
- 2 sale attempts since 7y ago with the ask held roughly flat each time — persistent listings suggest the price (not the market) is what's stuck; bring a comps-based counter.
- Current owner paid $70k; list at $215k implies a 207% gain — meaningful room to come down on a strong offer.
Risks & watch-outs
- Climate carrying-cost: severe wind risk, 99% chance of damaging wind over 30y; moderate wildfire risk; extreme-heat days projected 7→27/yr by 2055 (HVAC capex compounding) — expect insurance premiums to compound above CPI over the hold.
Questions for the listing agent
- What do current leases actually rent for vs. the listed asking? Can we see a recent rent roll and the last 12 months of T-12 income?
- Is there a deadline driving the sale (1031 exchange, divorce, estate, relocation)? That informs how much negotiation room exists.
- Schools are F-rated, which usually means shorter tenancies and higher turnover. Who's the typical renter profile here, and what's been the actual vacancy rate?
- The area grade is low — what's the realistic commute time and amenity access for the typical tenant pool here? Any planned neighborhood developments (good or bad) we should know about?
- What's the average days-on-market for RENTAL listings here right now (not sales)? A rising rental-DOM trend means longer vacancies and softer asking-rent achievability than the comps imply.
- What's the recent tenant-quality profile in this submarket — average credit score on applications, eviction rate, late-payment / NSF rate, and stable-employment percentage? A property-management company in the area should have these aggregated.
- How much new for-sale + rental construction is in the pipeline within 1–3 miles? Heavy new supply typically softens prices + rents 12–24 months out; constrained supply supports both.
Investment metrics
- 1% rule
- 0.88% ✗
- Cap rate
- 6.22%
- Cash-on-cash
- -0.27%
- DSCR
- 0.99
- GRM
- 9.4
CMA / ARV
No comps found within radius.
Projected returns pro-forma
-3.0% appreciation · 3.0% rent growth · sell at horizon
- IRR
- -16.7%
- Equity multiple
- 0.41×
- Total profit
- $-35,652
- Equity at exit
- $32,057
- IRR
- -8.5%
- Equity multiple
- 0.47×
- Total profit
- $-31,959
- Equity at exit
- $18,589
Cash invested: $60,200 (down + closing). Projections, not guarantees.
Landlord ↔ Tenant lean methodology
- Overall (STATE)
- 87 Strongly Landlord-Friendly
- State Florida
- 87 Strongly Landlord-Friendly · R+3
- County
- — inherits STATE
- City
- — inherits STATE
ZIP-level market 34269
- Home prices YoY
- -2.9%
- Active inventory
- 149
- Price-to-rent
- 9.4×
Monthly cashflow live
- Estimated rent
- $1,902 medium interval (Pro) →
- Mortgage (P&I)
- −$1,127
- Tax from tax record
- −$299 /mo · $3,589/yr
- Insurance
- −$90
- HOA
- −$0
- Vacancy / Maint / Mgmt
- −$399
- Net cashflow
- $-13
Break-even live
UW: 25.0% down · 7.5% · 30yr · 1.5% tax · 5.0% vac · 8.0% maint · 8.0% mgmt
Financing live
Cash to close
- Down payment
- $53,750
- Closing costs
- $6,450
- Reserves months
- —
- Total cash needed
- —
Loan-product check · same deal, 3 products live
Conventional
25% down · 7.5% · 30yr
- Down + closing
- —
- Monthly P&I
- —
- Monthly cashflow
- —
- DSCR
- —
- Eligible?
- —
Personal DTI + credit; lowest rate.
DSCR
20% down · 8.5% · 30yr
- Down + closing
- —
- Monthly P&I
- —
- Monthly cashflow
- —
- DSCR
- —
- Eligible?
- —
No personal income docs; deal must DSCR.
Hard money
10% down · 12.0% · 12mo
- Down + closing
- —
- Monthly P&I
- —
- Monthly cashflow
- —
- DSCR
- —
- Eligible?
- —
Short-term bridge; refi at stabilization.
Listing history 9 events
-
2026-04-22status Pending
-
2026-04-09$215,000 Active
-
2021-09-24soldstatus $70,000
-
2019-09-23soldstatus $50,000
-
2019-09-20soldstatus $25,000 Sold 291-char remark
Show marketing remark (291 chars)
Nice lot in a desirable area with beautiful large oaks with a mobile that needs repairs. The property is being sold as vacant land and is a short distance from I-75 and just around the corner from Kings Hwy. Close to Arcadia or enjoy gulf at the new golf course being re-modeled in the area.
-
2019-08-09status Pending 291-char remark
Show marketing remark (291 chars)
Nice lot in a desirable area with beautiful large oaks with a mobile that needs repairs. The property is being sold as vacant land and is a short distance from I-75 and just around the corner from Kings Hwy. Close to Arcadia or enjoy gulf at the new golf course being re-modeled in the area.
-
2019-08-06$25,000 Active 291-char remark
Show marketing remark (291 chars)
Nice lot in a desirable area with beautiful large oaks with a mobile that needs repairs. The property is being sold as vacant land and is a short distance from I-75 and just around the corner from Kings Hwy. Close to Arcadia or enjoy gulf at the new golf course being re-modeled in the area.
-
2008-07-14soldstatus $19,000
-
2002-10-08soldstatus $50,000
ⓘ Source: listings_history table (triggers on properties + properties_extension) + one-shot
backfill from property_details.listing_events for pre-trigger history.
Tax reassessment forecast FL · Resets to sale price
- Current annual tax
- $3,589 · $299/mo
- Projected year-2 tax
- $3,589 · $299/mo
- Expected delta
- $0/yr ($0/mo · 0.0%)
ⓘ Screening estimate from a state-policy table — verify with the county assessor before closing.
Climate risk First Street
- Flood 1/10 Low FEMA zone X (unshaded) · 0% chance over 30 yrs
- Wildfire 5/10 Major
- Heat 10/10 Extreme 7 d/yr ≥108°F today · 27 d/yr by 30 yrs out
- Wind 10/10 Extreme 99% chance of damaging wind over 30 yrs
- Air quality 2/10 Low 2 unhealthy d/yr today · 2 by 30 yrs out
Nearby sold comps map
Loading sold comps map…
Walkable amenities ~0.75 mi
Loading nearby amenities…
Taxation est. · year 1
- Rental income
- $22,825
- − Mortgage interest
- −$12,043
- − Property taxes
- −$3,589
- − Insurance
- −$1,075
- − Repairs & maintenance
- −$1,826
- − Management
- −$1,826
- − Depreciation
- −$6,255
- Taxable loss
- −$3,789
- Est. tax savings @ 24.0%
- +$909
- After-tax cash flow
- $747/yr
For passive investors: Depreciation is non-cash, so a rental often shows a tax loss while cash-flowing — sheltering income. Rental losses are passive: they offset passive income freely, and up to $25,000/yr can offset ordinary (W-2) income if you actively participate and your MAGI is under $100k (phasing out to $0 by $150k); unused losses carry forward. On sale, claimed depreciation is recaptured at up to 25%, and gains may owe capital-gains tax (a 1031 exchange can defer both). Figures are a year-1 estimate at your 24.0% rate — not tax advice; consult a CPA.
Schools (NCES district)
- District
- Desoto
- NCES district ID
- 1200420
- Math proficiency
- 31% ▼ -9.00%
- Reading proficiency
- 32% ▼ -3.00%
- Median HH income
- $35,136
- Composite
- 26.03/100
- National rank
- #7305
- State rank
- #69 of 73 in FL
Livability — Harbour Heights
- Score
- 64/100
- State rank
- #684
- US rank
- #14202
Category grades
Schools grade is shown separately in the Schools card above.
Census & demographics
- Population (ZIP)
- 5,111
Population outlook (DeSoto County) Hauer SSP2
- Today (2025)
- 34,958 people
- By 2030
- 34,465 · -1.4%
- By 2040
- 33,137 · -5.2%
- By 2050
- 31,273 · -10.5%
- By 2075
- 23,898 · -31.6%
- By 2100
- 15,517 · -55.6%
Race, ethnicity, and origin ACS 2023
- Neighborhood character
- Predominantly White (83%)
- Race & ethnicity
- White 83% Hispanic / Latino 10% Two or more races 7% Black 4%
- Hispanic origin (detail)
- Mexican 8% Puerto Rican 2%
- Common ancestry
- Slovak 4% Romanian 3% Lithuanian 3%
- Foreign-born
- 3% · Canada
- Languages at home
- 94% English-only · Spanish 4% Other Indo-European 1% German/W. Germanic 1%
Political lean MEDSL · DeSoto
- 2024 margin
- Solid R (+42.9) · D 28.2% · R 71.2%
- 2008→2024 swing
- -30.6pp toward R · 2008: -12.3pp · 2024: -42.9pp
- All cycles
- 2024: R+42.9 2020: R+32.0 2016: R+27.7 2012: R+14.3 2008: R+12.3
Not yet ingested
- Civics
- —
Market trends
- HPI YoY
- ▼ -8.77%
- Current HPI
- 297.0303
- Rent YoY
- —
- Metro
- —
- State GDP YoY
- ▲ 3.28%
- F500 in state
- 36
Industry mix (Fortune 500 HQ in FL)
| Industry | F500 HQs | Revenue |
|---|---|---|
| Industrial Technology | 2 | $29B |
|
||
| Insurance | 2 | $17B |
|
||
| Retail | 1 | $60B |
|
||
| Technology Distribution | 1 | $58B |
|
||
| Homebuilding | 1 | $35B |
|
||
| Technology Manufacturing | 1 | $35B |
|
||
Price history
+330.0% since first listed9 events — show timeline
- 2026-04-22 Pending — Stellar MLS as Distributed by MLS Grid
- 2026-04-09 Listed $215,000 Stellar MLS as Distributed by MLS Grid
- 2021-09-24 Sold (Public Records) $70,000 Public Records
- 2019-09-23 Sold (Public Records) $50,000 Public Records
- 2019-09-20 Sold (MLS) $25,000 Stellar MLS as Distributed by MLS Grid
- 2019-08-09 Pending — Stellar MLS as Distributed by MLS Grid
- 2019-08-06 Listed $25,000 Stellar MLS as Distributed by MLS Grid
- 2008-07-14 Sold (Public Records) $19,000 Public Records
- 2002-10-08 Sold (Public Records) $50,000 Public Records
Property tax history
+22.7%/yrLatest (2025): $3,589 · +3.1% YoY. Source: county tax records.
Cash-flow waterfall
monthlySold comps — $/sqft
last 12 mo · ≤1 miLoading sold comps…