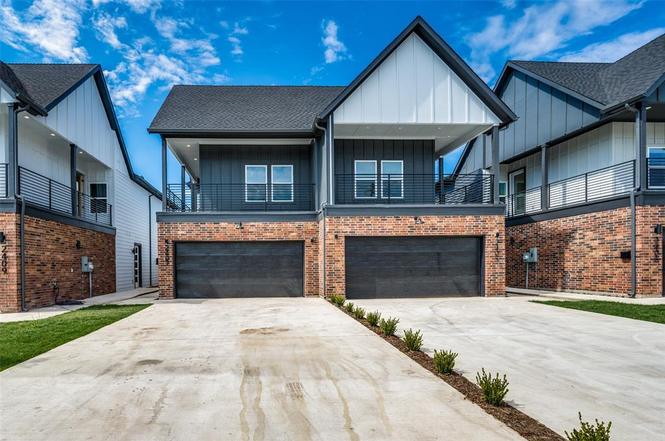
2412 Merlin St · Dallas, TX
Flood risk 1/10 · Minimal
- FEMA flood zone
- X (unshaded)
- Chance of flooding over 30 yrs
- 0.0%
- Est. flood insurance / yr
- $507 – $1,088
Fire risk 1/10 · Minimal
- Est. fire insurance / yr
- $1,222 – $2,270
Heat risk 7/10 · Major
- Hot days now (above 109°F)
- 7 days/yr
- Hot days in 30 yrs
- 23 days/yr
Wind risk 6/10 · Moderate
- Chance of severe wind over 30 yrs
- 27.0%
Air-quality risk 3/10 · Minor
- Unhealthy air days now
- 2 days/yr
- Unhealthy air days in 30 yrs
- 3 days/yr
Risk factors via First Street. Map © Google.
Why this score? — see what drove the C+ grade
The composite is a weighted blend of 9 inputs, each scored 0–100. Each bar is that input's sub-score; the figure is the points it added to the 100-point composite (weight × sub-score).
- Cash flow +22.7/30.0
- ARV discount +7.5/15.0
- DSCR +7.3/10.0
- Appreciation +5.4/10.0
- 1% rule +5.1/10.0
- Rent growth +4.3/5.0
- Livability +4.0/5.0
- Schools +2.8/10.0
- Condition / age +2.5/5.0
$285,000
🖨 Deal sheet 📄 Offer letter ✓ Due diligence
Listing remarks
Beautiful contemporary duplex in the newly developed community of Jefferies-Meyers right in the heart of Sunny South Dallas! This gorgeous home features an open concept layout and tons of builder upgrades that are sure to please the most discerning of buyers. The kitchen has waterfall granite countertops, stainless steel appliance and a large kitchen island. Throughout the home you have vinyl wood flooring with ceramic tile in the bathrooms. If having an outdoor escape is important to you this home also comes with a private balcony perfect for enjoying the Dallas skyline. Conveniently located near Fair Park with easy access to multiple major highways - I-30, I-75, I-35S, Dallas North Tollwa
Key facts
- Large kitchen island
- Vinyl wood flooring
- Ceramic tile
Tags
Neighborhood map
What this means for you Summary
Snapshot
- This is a 3-bed/2.5-bath land listed at $285k.
Deal economics
- At list price, monthly cash flow is $489 ($6k/yr) — positive.
- The deal already cash-flows at list — no discount required.
- Meets the 1% rule at list price ($3k rent vs $285k).
- Cap rate 8.4% vs local median 2.3% in Dallas — top-decile yield for the area; either an underpriced asset or a hidden risk that comps aren't pricing in. Stress-test before assuming the spread holds.
Location & tenants
- Location reads 81/100 on livability (#24 in TX, #1,380 nationally) — a professional / high-income tenant draw. Strengths: amenities A+, commute A+, housing A+; Watch: crime F.
- Dallas ISD (urban): math 31% / reading 36% proficiency, ranked #559 of 826 in TX (top 68%) — families likely to look elsewhere, expect single-tenant / working-renter base with shorter leases; 83% free/reduced lunch — lower-income household profile, screen leases tightly.
- Zoned schools: Paul L Dunbar Learning Center (math 27% / reading 22%, grade F, #3,052 of 4,322 statewide, top 74%, 531 students, 95% FRL).
- Market conditions: Rents rising fast (+7.2%/yr); 248 active listings in the ZIP; 40 comparable units currently listed for rent nearby; rentals at typical pace (median 17d on market — plan ~3-4 weeks tenant-placement turnaround); 12,577 units permitted in Dallas County in 2024 (6,829 in 5+ unit buildings).
- At $2,873/mo this rent would consume 76% of the median local household income ($46k/yr) (locally 1464% of renters already pay >50% of income on rent) — very limited rent-growth headroom before tenants either downsize or default.
Forward outlook
- In year one you build about $4k of equity ($2k loan paydown + $2k appreciation (0.8% local appreciation)).
- Dallas County population projected at +35% by 2050 — long-run rental-demand tailwind backs the buy-and-hold thesis.
- At projected returns (0.8% appreciation + 7.2% rent growth), your $80k cash investment doubles in ~6 years — after that, you're playing with house money.
- By year 8, paydown + projected appreciation supports a ~$35k cash-out refi (75% LTV) — recoverable capital for the next deal without selling this one.
Negotiation context
- Only 4 days on market — expect competitive offers; lowballing is unlikely to land.
Risks & watch-outs
- Climate carrying-cost: major wind risk, 27% chance of damaging wind over 30y; extreme-heat days projected 7→23/yr by 2055 (HVAC capex compounding) — expect insurance premiums to compound above CPI over the hold.
Questions for the listing agent
- Is there a deadline driving the sale (1031 exchange, divorce, estate, relocation)? That informs how much negotiation room exists.
- Crime grade is F in this area — have there been break-ins, vandalism, or insurance claims at this property in the last 3 years? What carrier currently insures it and at what premium?
- What's the average days-on-market for RENTAL listings here right now (not sales)? A rising rental-DOM trend means longer vacancies and softer asking-rent achievability than the comps imply.
- What's the recent tenant-quality profile in this submarket — average credit score on applications, eviction rate, late-payment / NSF rate, and stable-employment percentage? A property-management company in the area should have these aggregated.
- How much new for-sale + rental construction is in the pipeline within 1–3 miles? Heavy new supply typically softens prices + rents 12–24 months out; constrained supply supports both.
Investment metrics
- 1% rule
- 1.01% ✓
- Cap rate
- 8.35%
- Cash-on-cash
- 7.36%
- DSCR
- 1.33
- GRM
- 8.3
CMA / ARV
No comps found within radius.
Projected returns pro-forma
0.79% appreciation · 7.19% rent growth · sell at horizon
- IRR
- 11.2%
- Equity multiple
- 1.58×
- Total profit
- $46,104
- Equity at exit
- $94,180
- IRR
- 17.6%
- Equity multiple
- 3.34×
- Total profit
- $186,385
- Equity at exit
- $122,784
Cash invested: $79,800 (down + closing). Projections, not guarantees.
Landlord ↔ Tenant lean methodology
- Overall (STATE)
- 87 Strongly Landlord-Friendly
- State Texas
- 87 Strongly Landlord-Friendly · R+5
- County
- — inherits STATE
- City
- — inherits STATE
ZIP-level market 75215
- Home prices YoY
- 0.3%
- Rents YoY
- 7.2%
- Active inventory
- 248
- Price-to-rent
- 8.3×
Monthly cashflow live
- Estimated rent
- $2,873 high interval (Pro) →
- Mortgage (P&I)
- −$1,495
- Tax from tax record
- −$167 /mo · $2,004/yr
- Insurance
- −$119
- HOA
- −$0
- Vacancy / Maint / Mgmt
- −$603
- Net cashflow
- $489
Break-even live
UW: 25.0% down · 7.5% · 30yr · 1.5% tax · 5.0% vac · 8.0% maint · 8.0% mgmt
Financing live
Cash to close
- Down payment
- $71,250
- Closing costs
- $8,550
- Reserves months
- —
- Total cash needed
- —
Loan-product check · same deal, 3 products live
Conventional
25% down · 7.5% · 30yr
- Down + closing
- —
- Monthly P&I
- —
- Monthly cashflow
- —
- DSCR
- —
- Eligible?
- —
Personal DTI + credit; lowest rate.
DSCR
20% down · 8.5% · 30yr
- Down + closing
- —
- Monthly P&I
- —
- Monthly cashflow
- —
- DSCR
- —
- Eligible?
- —
No personal income docs; deal must DSCR.
Hard money
10% down · 12.0% · 12mo
- Down + closing
- —
- Monthly P&I
- —
- Monthly cashflow
- —
- DSCR
- —
- Eligible?
- —
Short-term bridge; refi at stabilization.
Rent comps 40 comps
| Address | Beds | Baths | Sqft | Rent | $/sqft | DOM | Units | Dist |
|---|---|---|---|---|---|---|---|---|
| 2406 Merlin St Dallas, TX | 3.0 | 2.5 | 2004 | $2,500 | $1.25 | 7d | 1 | 0.04mi |
| 2408 Meyers St Unit 204 Dallas, TX | 2.0 | 1.0 | 2375 | $770 | $0.32 | 2d | 1 | 0.14mi |
| 3230 Elihu St #5 Dallas, TX | 2.0 | 3.5 | 1400 | $2,700 | $1.93 | 43d | 1 | 0.46mi |
| 3230 Elihu St #2 Dallas, TX | 2.0 | 3.5 | 1400 | $2,300 | $1.64 | 43d | 1 | 0.46mi |
| 2900 Canton St Dallas, TX | 1.0–2.0 | 1.0–2.0 | 1029 | $2,525 | $2.45 | 1d | 14 | 0.64mi |
| 3900 Commerce St Dallas, TX | 2.0 | 1.0–2.0 | 1217 | $3,925 | $3.22 | 6d | 10 | 0.69mi |
| 1874 Beaumont St Dallas, TX | 4.0 | 5.0 | 2578 | $4,900 | $1.90 | 43d | 1 | 0.70mi |
| 835 S Good Latimer Expy Dallas, TX | 2.0 | 1.0–2.0 | 1198 | $2,680 | $2.24 | 2d | 26 | 0.71mi |
| 3131 Main St Dallas, TX | 2.0 | 1.0–2.0 | 989 | $3,400 | $3.44 | 1d | 28 | 0.74mi |
| 1110 S Cesar Chavez Blvd Dallas, TX | 2.0 | 1.0–2.5 | 946 | $1,977 | $2.09 | 1d | 42 | 0.77mi |
| 2507 Birmingham Ave Dallas, TX | 3.0 | 2.5 | 1516 | $2,500 | $1.65 | 24d | 1 | 0.78mi |
| 1900 S Ervay St Dallas, TX | 2.0 | 3.0 | 1302 | $3,700 | $2.84 | 43d | 1 | 0.80mi |
| 2210 Canton St Dallas, TX | 1.0–2.0 | 1.0–2.0 | 1138 | $2,349 | $2.06 | 1d | 55 | 0.86mi |
| 3308 Birmingham Ave Unit 7 Dallas, TX | 2.0 | 2.5 | 1287 | $2,125 | $1.65 | 14d | 1 | 0.87mi |
| 3308 Birmingham Ave Unit 1 Dallas, TX | 2.0 | 2.5 | 1451 | $2,275 | $1.57 | 24d | 1 | 0.87mi |
| 3308 Birmingham Ave Unit 03 Dallas, TX | 2.0 | 2.5 | 1451 | $2,275 | $1.57 | 43d | 1 | 0.87mi |
| 3308 Birmingham Ave Unit 6 Dallas, TX | 2.0 | 2.5 | 1341 | $2,175 | $1.62 | 16d | 1 | 0.87mi |
| 3308 Birmingham Ave Unit 11 Dallas, TX | 2.0 | 2.5 | 1505 | $2,375 | $1.58 | 43d | 1 | 0.87mi |
| 2901 Indiana Blvd Dallas, TX | 2.0 | 1.0–2.0 | 930 | $2,405 | $2.58 | 1d | 21 | 0.88mi |
| 1512 Seegar St Unit 1508 Dallas, TX | 3.0 | 3.5 | 2003 | $3,250 | $1.62 | 43d | 1 | 0.88mi |
| 1011 S Pearl Expy Dallas, TX | 1.0–3.0 | 1.0–2.0 | 1035 | $2,288 | $2.21 | 13d | 1 | 0.89mi |
| 1508 Seegar St Dallas, TX | 3.0 | 3.5 | 1966 | $3,124 | $1.59 | 14d | 9 | 0.89mi |
| 1805 Browder St #103 Dallas, TX | 3.0 | 3.5 | 2358 | $8,000 | $3.39 | 43d | 1 | 0.97mi |
| 1805 Browder St Unit 1019612P Dallas, TX | 3.0 | 3.5 | 2357 | $6,830 | $2.90 | 6d | 1 | 0.97mi |
| 3502 Edgewood St Dallas, TX | 4.0 | 2.0 | 1866 | $2,523 | $1.35 | 1d | 1 | 0.98mi |
| 2531 Elm St Dallas, TX | 3.0 | 3.0 | 1732 | $4,616 | $2.67 | 18d | 1 | 0.99mi |
| 2531 Elm St Dallas, TX | 3.0 | 3.0 | 1732 | $4,616 | $2.67 | 21d | 1 | 0.99mi |
| 2525 Elm St Dallas, TX | 3.0 | 1.0–3.0 | 1191 | $4,096 | $3.44 | 1d | 36 | 1.00mi |
| 1552 Cosette Dr Dallas, TX | 2.0 | 2.5 | 2344 | $3,355 | $1.43 | 16d | 1 | 1.00mi |
| 2847 Metropolitan Ave Dallas, TX | 3.0 | 1.0 | 1344 | $2,050 | $1.53 | 21d | 1 | 1.01mi |
| 2121 Albany St Dallas, TX | 2.0 | 2.5 | 1997 | $4,150 | $2.08 | 24d | 1 | 1.03mi |
| 2121 Albany St Dallas, TX | 2.0 | 2.5 | 2414 | $4,200 | $1.74 | 43d | 1 | 1.03mi |
| 3413 Wendelkin St Dallas, TX | 3.0 | 2.5 | 1724 | $2,650 | $1.54 | 1d | 1 | 1.07mi |
| 1100 Corinth St Dallas, TX | 2.0–3.0 | 2.5–3.5 | 1572 | $3,595 | $2.29 | 43d | 10 | 1.09mi |
| 3521 S Harwood St Dallas, TX | 3.0 | 2.5 | 1750 | $2,700 | $1.54 | 2d | 1 | 1.10mi |
| 1245 Gano St #602 Dallas, TX | 2.0 | 2.5 | 2465 | $2,800 | $1.14 | 21d | 1 | 1.14mi |
| 2013 Jackson St Dallas, TX | 1.0–2.0 | 1.0–2.0 | 952 | $3,266 | $3.43 | 1d | 69 | 1.19mi |
| 4536 Birch St Dallas, TX | 4.0 | 2.0 | 1259 | $2,200 | $1.75 | 43d | 1 | 1.21mi |
| 317 Alcalde St Unit 1018276P Dallas, TX | 4.0 | 2.5 | 2292 | $22,489 | $9.81 | 24d | 1 | 1.22mi |
| 1514 Washington St Unit 105 Dallas, TX | 2.0 | 2.5 | 1404 | $2,950 | $2.10 | 7d | 1 | 1.23mi |
Listing history 2 events
-
2025-07-22status Pending
-
2025-07-18$285,000 Active
ⓘ Source: listings_history table (triggers on properties + properties_extension) + one-shot
backfill from property_details.listing_events for pre-trigger history.
Tax reassessment forecast TX · Resets to sale price
- Current annual tax
- $2,004 · $167/mo
- Projected year-2 tax
- $5,216 · $435/mo
- Expected delta
- +$3,211/yr (+$268/mo · 160.2%)
ⓘ Screening estimate from a state-policy table — verify with the county assessor before closing.
Climate risk First Street
- Flood 1/10 Low FEMA zone X (unshaded) · 0% chance over 30 yrs
- Wildfire 1/10 Low
- Heat 7/10 Severe 7 d/yr ≥109°F today · 23 d/yr by 30 yrs out
- Wind 6/10 Major 27% chance of damaging wind over 30 yrs
- Air quality 3/10 Moderate 2 unhealthy d/yr today · 3 by 30 yrs out
Nearby sold comps map
Loading sold comps map…
Walkable amenities ~0.75 mi
Loading nearby amenities…
Taxation est. · year 1
- Rental income
- $34,473
- − Mortgage interest
- −$15,964
- − Property taxes
- −$2,004
- − Insurance
- −$1,425
- − Repairs & maintenance
- −$2,758
- − Management
- −$2,758
- − Depreciation
- −$8,291
- Taxable income
- $1,273
- Est. tax owed @ 24.0%
- −$305
- After-tax cash flow
- $5,564/yr
For passive investors: Depreciation is non-cash, so a rental often shows a tax loss while cash-flowing — sheltering income. Rental losses are passive: they offset passive income freely, and up to $25,000/yr can offset ordinary (W-2) income if you actively participate and your MAGI is under $100k (phasing out to $0 by $150k); unused losses carry forward. On sale, claimed depreciation is recaptured at up to 25%, and gains may owe capital-gains tax (a 1031 exchange can defer both). Figures are a year-1 estimate at your 24.0% rate — not tax advice; consult a CPA.
Schools (NCES district)
- District
- Dallas ISD
- NCES district ID
- 4816230
- Math proficiency
- 31% ▼ -16.00%
- Reading proficiency
- 36% ▼ -4.00%
- Median HH income
- $42,881
- Composite
- 28.41/100
- National rank
- #6763
- State rank
- #559 of 826 in TX
Livability — Dallas
- Score
- 81/100
- State rank
- #24
- US rank
- #1380
Category grades
Schools grade is shown separately in the Schools card above.
Census & demographics
- Census place
- Dallas, TX
- County
- Dallas County · 2,612,404 people
- City population
- 1,168,437
- Metro
- Dallas-Fort Worth-Arlington, TX
- Population (ZIP)
- 18,895
- Household income
- $45,557
- Rent vs Own
- Severe rent burden
- 1464.0
Population outlook (Dallas County) Hauer SSP2
- Today (2025)
- 2,979,839 people
- By 2030
- 3,191,823 · +7.1%
- By 2040
- 3,619,611 · +21.5%
- By 2050
- 4,026,915 · +35.1%
- By 2075
- 4,957,073 · +66.4%
- By 2100
- 5,508,725 · +84.9%
Race, ethnicity, and origin ACS 2023
- Neighborhood character
- Diverse neighborhood (Simpson 0.58)
- Race & ethnicity
- Black 59% Hispanic / Latino 25% White 11% Two or more races 10%
- Hispanic origin (detail)
- Mexican 21%
- Common ancestry
- Italian 1% Hispanic 1%
- Foreign-born
- 16% · Canada
- Languages at home
- 74% English-only · Spanish 26%
Political lean MEDSL · Dallas
- 2024 margin
- Strong D (+22.2) · D 60.2% · R 38.0% · Other 1.8%
- 2008→2024 swing
- +6.9pp toward D · 2008: 15.3pp · 2024: 22.2pp
- All cycles
- 2024: D+22.2 2020: D+31.6 2016: D+26.2 2012: D+15.4 2008: D+15.3
Not yet ingested
- Civics
- —
Market trends
- HPI YoY
- ▲ 0.79%
- Current HPI
- 224.2955
- Rent YoY
- ▲ 7.19%
- Metro
- Dallas-Fort Worth-Arlington, TX
- State GDP YoY
- ▲ 3.95%
- F500 in state
- 110
Industry mix (Fortune 500 HQ in TX)
| Industry | F500 HQs | Revenue |
|---|---|---|
| Energy | 16 | $1,198B |
|
||
| Technology | 5 | $198B |
|
||
| Engineering / Construction | 4 | $72B |
|
||
| Energy Services | 3 | $60B |
|
||
| Utilities | 3 | $41B |
|
||
| Healthcare | 2 | $330B |
|
||
Price history
2 events — show timeline
- 2025-07-22 Pending — NTREIS
- 2025-07-18 Listed $285,000 NTREIS
Property tax history
+20.7%/yrLatest (2025): $2,004 · +59.4% YoY. Source: county tax records.
Cash-flow waterfall
monthlySold comps — $/sqft
last 12 mo · ≤1 miLoading sold comps…